


0
US Dollar Index
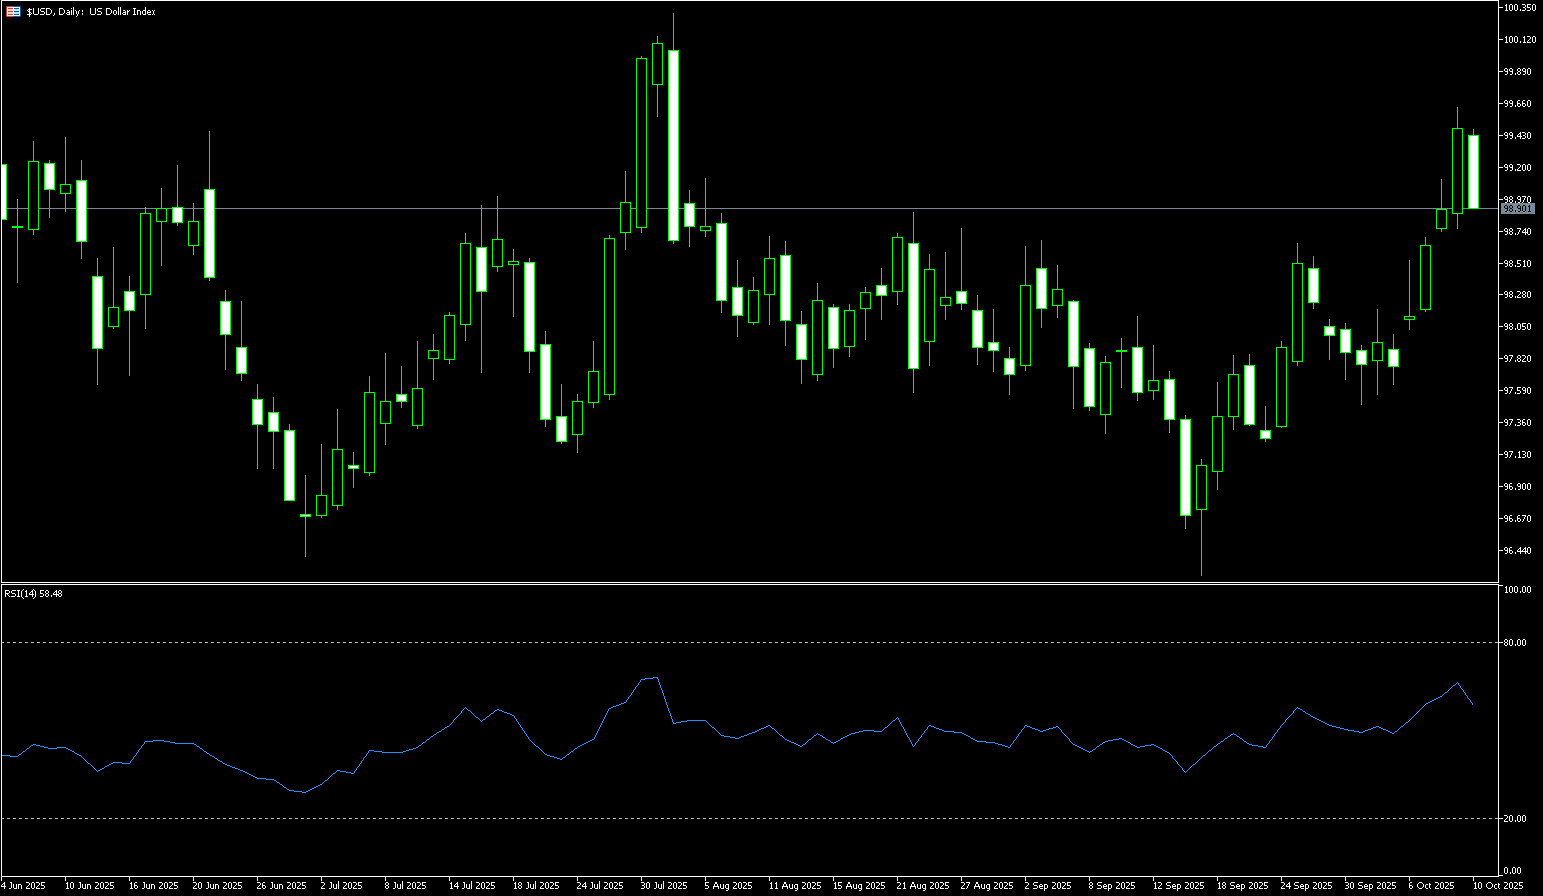
The US dollar index fell below the 99.00 mark before the weekend, resurfacing concerns about a tariff war after US President Trump said there was no reason to meet with China's Xi Jinping in South Korea in two weeks and indicated plans to raise tariffs to 100% on Chinese imports. Investors also digested the University of Michigan's preliminary report on consumer confidence, which showed morale remained largely unchanged in October but slightly above expectations. The US government shutdown is expected to continue into next week, potentially delaying the release of key economic data such as the consumer price index and labor market data, which could affect the Fed's outlook for rate cuts. The market now sees a 95% probability of a 25 basis point rate cut this month, while the probability in December has fallen from 90% to 80%. Meanwhile, the euro fell about 1.5% against the dollar due to political turmoil in France, where President Emmanuel Macron continues his search for his sixth prime minister in less than two years. The yen is expected to fall nearly 2.5% against the dollar this week after the victory of Sanae Takaichi, the new leader of Japan's ruling party, in the presidential election, reinforced expectations for higher spending and looser monetary policy. The euro and yen are under pressure, while the US dollar is expected to rise by over 1%.
In the short term, with no immediate resolution to the US government shutdown, some safe-haven buying driven by political uncertainty may continue to provide support for the US dollar, preventing a significant decline. A prolonged shutdown would materially impact fourth-quarter economic growth, potentially forcing the Federal Reserve to consider looser monetary policy, putting pressure on the US dollar in the medium to long term. The US dollar will face increasing downward pressure. Mild bullish momentum on the daily chart remains intact, with the dollar breaking through the 98 and 99 levels last week to reach a two-month high of 99.56. Meanwhile, the 14-day relative strength index (RSI) is above 64, indicating a stable to slightly stronger market. Short-term resistance lies at 99.56 (last Thursday's high). Next levels are the 99.94 (170-day simple moving average) and the 100.00 (psychologically significant market level). The first support level is 98.65 (the 134-day simple moving average). A break below this level could lead to a test of 98.24 (the 50.0% Fibonacci retracement level from 100.26 to 96.22). The next support level is 98.00.
Today, consider shorting the US Dollar Index at 98.95. Stop-loss: 99.10. Target: 98.40, 98.20.
WTI Spot Crude Oil
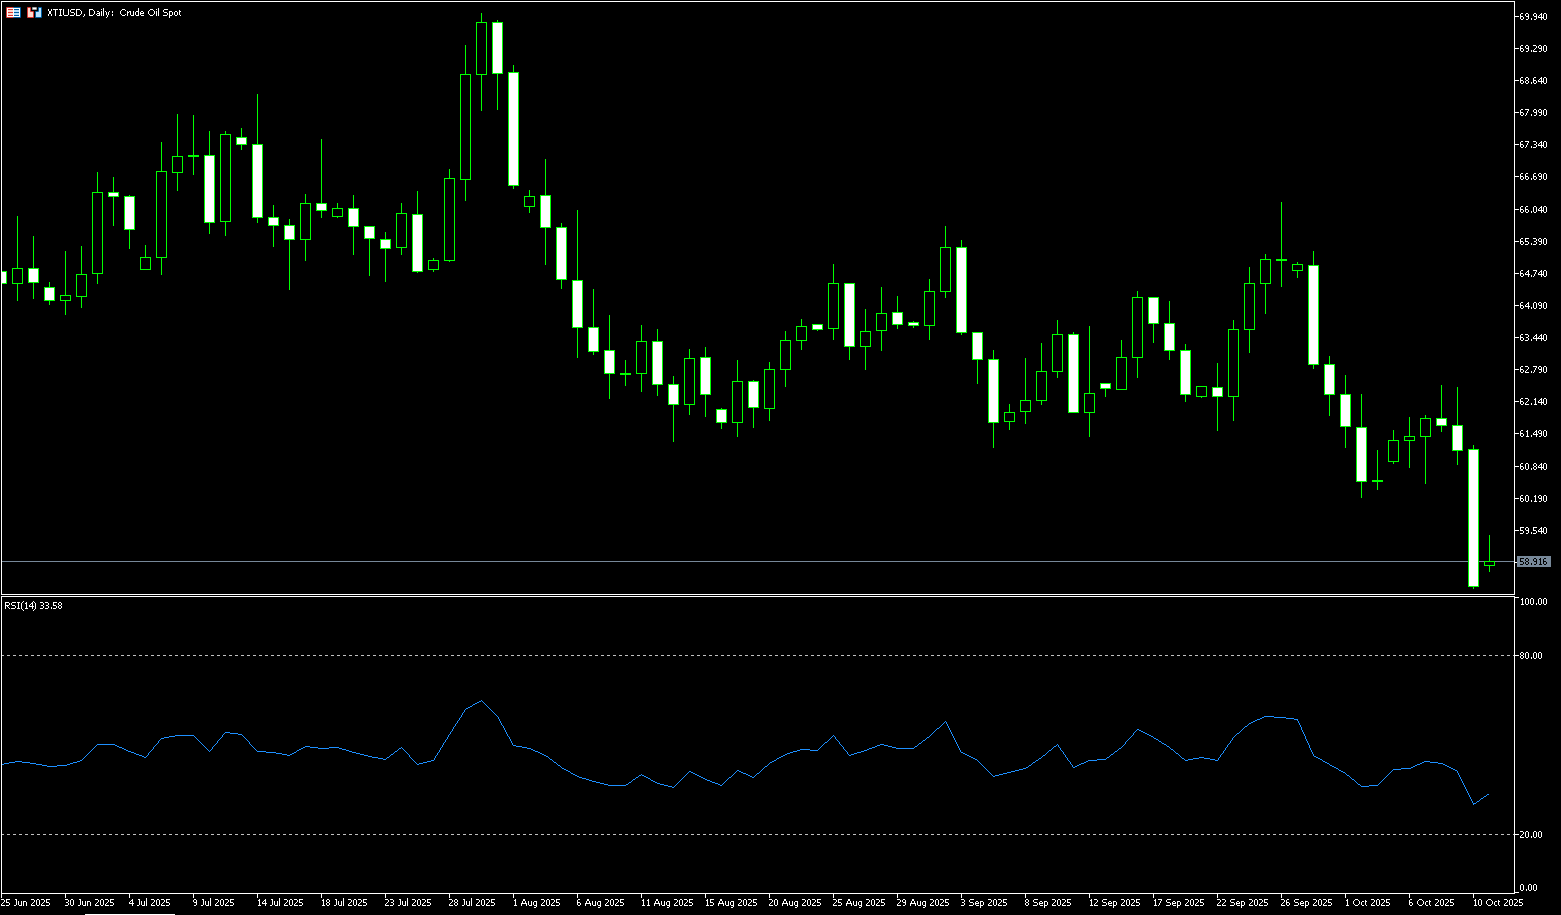
Last week, US crude oil experienced a period of rapid growth followed by a pullback. Last Friday (October 10), oil prices plummeted by over 5% as US President Trump's threat to raise tariffs on Chinese goods fueled market concerns about the outlook for crude oil demand and exacerbated concerns about oversupply. Brent crude oil futures fell $2.54, or 3.89%, to $62.68 per barrel, their lowest level since early May. U.S. crude oil (WTI) fell $3.24, or 5.31%, to $57.90 per barrel, also its lowest point since May. The sell-off stemmed from a market shift into risk-off mode, triggered by Trump's social media post threatening higher tariffs on Chinese goods. Investors also worried that a prolonged government shutdown could hamper economic growth, thereby dampening demand for crude oil in the United States, the world's largest crude oil consumer. The market generally believes that the combined effects of trade friction and fiscal uncertainty will put the crude oil market under pressure from weak demand and growing supply before the end of the year. If Trump's tariff threats escalate further, oil prices could face another round of selling.
From a daily technical perspective, WTI crude oil prices have continued to decline since reaching a high of $66.20 per barrel in mid-September, currently breaking through the support levels of $61 and $60, reaching a low of $57.90 since May. The candlestick pattern formed a large bearish candlestick pattern, reflecting market consolidation at a low level and weak buying interest. Regarding technical indicators, the 9-day SMA (61.01) crossed below the 20-day SMA (62.45), forming a bearish "death cross" pattern, indicating a weak short-term trend. The MACD indicator's red bar is shrinking and approaching the zero axis, indicating insufficient momentum. The RSI (Relative Strength Index) remains slightly above 30, indicating a mild oversold condition, suggesting that oil prices may encounter temporary resistance between $60.00 (psychological support) and $60.22 (October 2 low). If oil prices remain below this level, the next support level is around $56.12 (May 1 low); the next level is $54.78 (April 9 low). On the other hand, a break above the $60.00-$0.22 resistance zone could lead to a modest rebound to $61.01 (9-day SMA).
Consider going long on crude oil at 57.70 today. Stop-loss: 57.50, target: 59.00, 59.50.
Spot Gold
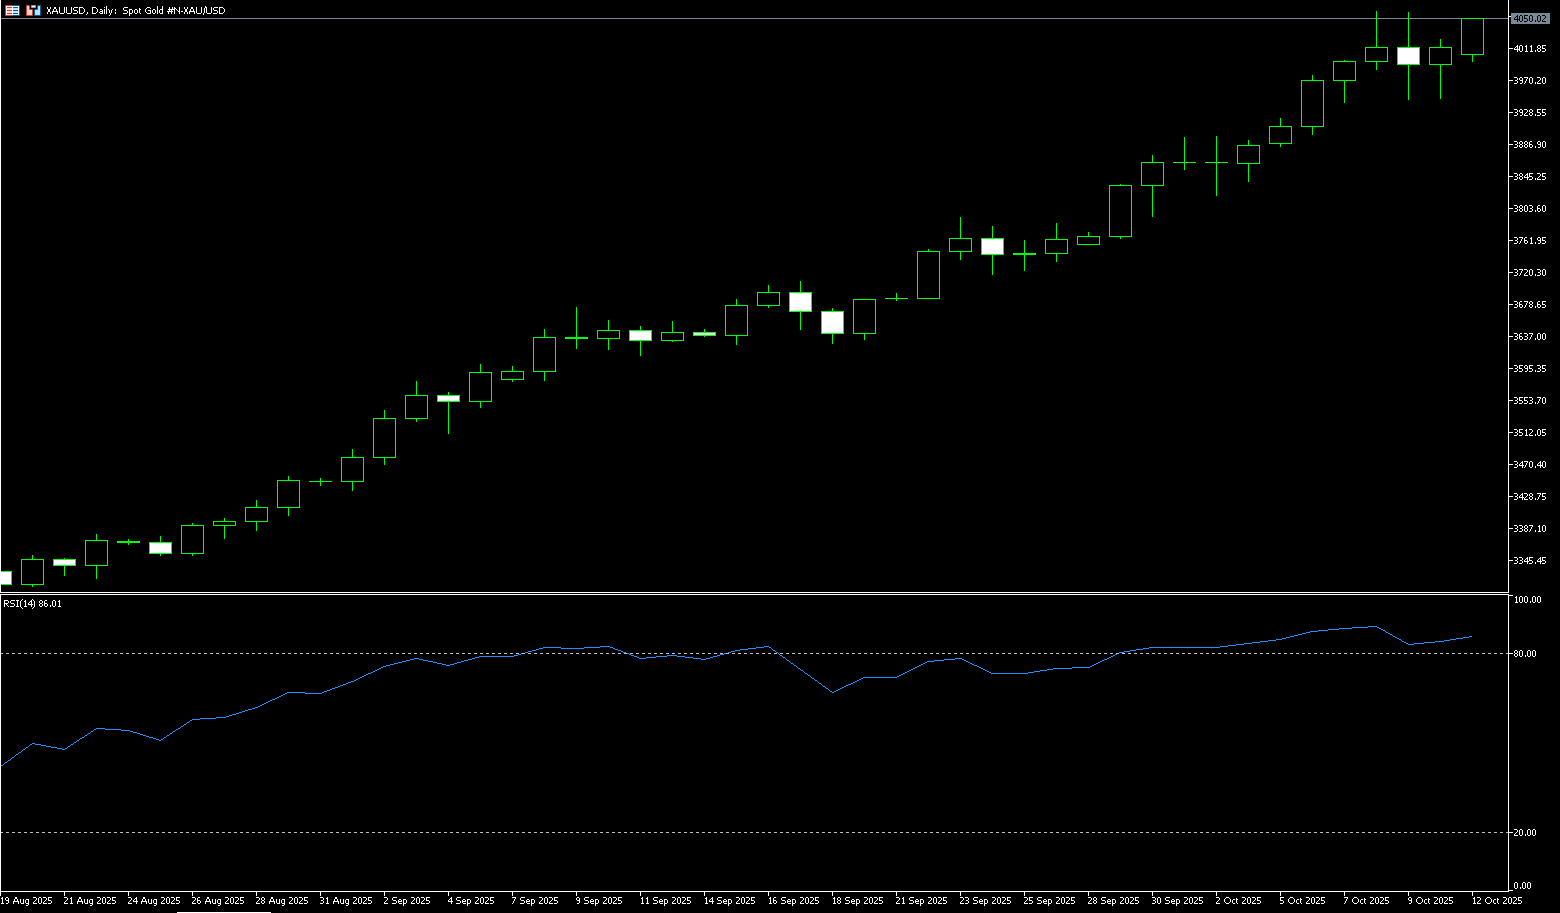
Last week, after a frenzy of record-breaking highs, the gold market staged another dramatic plunge. After hitting a record high of $4,059.30 per ounce, spot gold plummeted to $3,944.50, a daily fluctuation of nearly 2%. This sudden volatility, similar to the previous week's performance, dealt a cold blow to investors immersed in the bull market. Before the weekend, spot gold re-crossed the $4,000 mark to $4.18, approaching the record high of $4,059.30 reached on Wednesday, driven by renewed tensions between Washington and Beijing. Earlier, US President Trump stated that there was no reason to meet with Chinese President Xi Jinping in South Korea in two weeks, while preparing to increase tariffs on Chinese imports. Gold has risen approximately 52% this year, with a 3.35% gain this week, its eighth consecutive weekly gain, driven by ongoing geopolitical uncertainty, global economic concerns, and expectations of further US interest rate cuts. Meanwhile, the ceasefire agreement between Israel and Hamas has dimmed gold's luster as a geopolitical safe-haven asset, prompting some speculators to lock in profits.
Recently, the overall trend remains intact: Since late August, gold has maintained a solid upward trend, reaching new highs for several consecutive weeks. Last week, it even broke through the psychologically significant $4,000 mark. So far, no significant pullback has threatened this upward trend. The 14-day Relative Strength Index (RSI) technical indicator has consistently shown strong bullish momentum over the past 14 trading days. However, the indicator remains above overbought territory (70.00), suggesting that excessive buying pressure could lead to an imbalance. As long as the RSI remains within this range, a short-term technical correction is possible. The MACD lines are both near recent highs, suggesting momentum may have peaked and a period of market hesitation may begin in the coming trading days. Therefore, upside resistance could focus on $4,025 and $4,059.30 (last week's all-time high). A break below these levels could target the $4,100 level. On the downside, $3,983 (October 8 low) - $3,978 (6-day simple moving average) represents near-term support. This technical area, formed by recent pullbacks, could provide temporary support during short-term corrections. A clear break above this level could trigger a strong bearish extension to $3,947 (October 10 low) and $3,950.
Consider going long on gold at 4,014 today, with a stop-loss at 4,010 and targets at 4,050 and 4.060.
AUD/USD
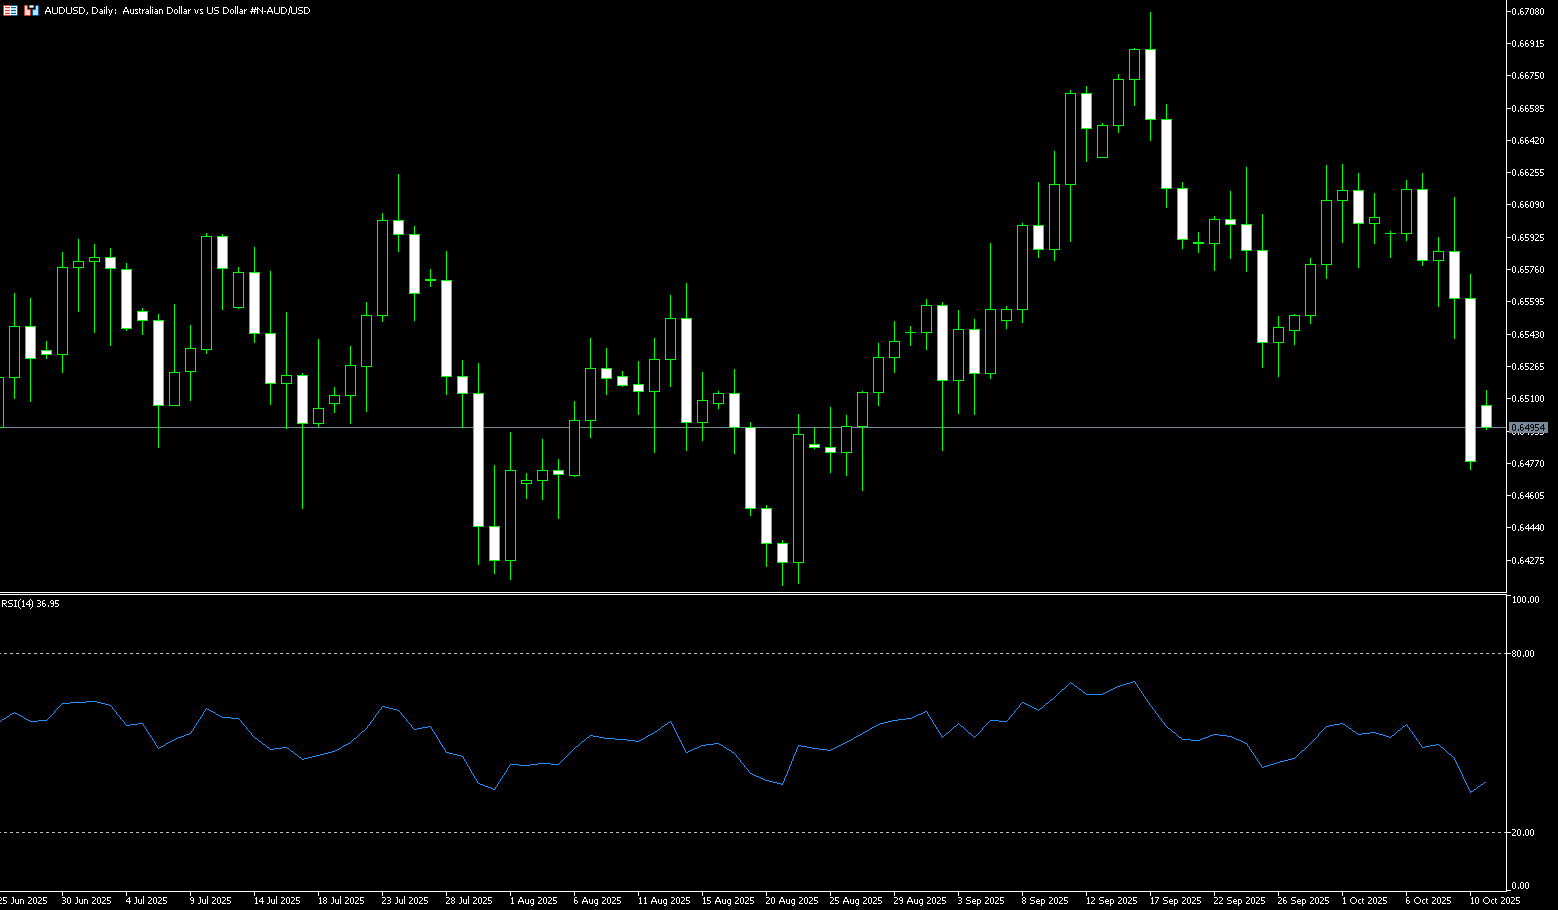
Before the weekend, the Australian dollar (AUD/USD) plummeted to a more than one-month low of 0.6472 after US President Trump threatened "huge tariff increases" on Chinese imports, reigniting concerns of a trade war between the world's two largest economies. Given Australia's close trade ties with China, these comments dealt a heavy blow to the Australian dollar, prompting traders to reduce their exposure to risk-sensitive currencies. Meanwhile, Australian consumer inflation expectations for October rose from 4.7% to 4.8%, the highest level since June. Heightened concerns that Australian inflation could exceed expectations in the third quarter supported the Reserve Bank of Australia's (RBA) cautious stance. Traders expect the RBA to maintain its official cash rate at 3.6% after its September decision. The currency gained support following cautious comments from RBA Governor Michelle Bullock. She emphasized the need for caution due to the volatility of monthly CPI data, adding that the labor market remains somewhat tight but likely close to equilibrium. Meanwhile, the Australian dollar is gradually declining amid a generally stronger US dollar. The ongoing government shutdown and weakness in other major currencies continue to support the dollar. However, diverging policy outlooks between the Reserve Bank of Australia and the Federal Reserve may underpin the AUD.
AUD/USD saw a sharp drop of 1.95% against the US dollar last weekend, plummeting to a more than one-month low of 0.6472. However, technical analysis on the daily chart suggests a resurgence of bearish bias after the pair broke through the 0.6600 and 0.6500 round-figure levels last week. However, the 14-day relative strength index (RSI) fell to a near six-week low near 34.00, suggesting a continued bearish bias. Therefore, on the downside, the pair is testing the 200-day simple moving average at 0.6420 as immediate support. A break below this level would weaken medium-term price momentum, potentially causing the pair to hover around the 0.6400 round-figure mark, followed by the 0.6372 level seen in June. A subsequent break above the 0.6500 round-figure mark would restore the bullish bias and target initial resistance at the 100-day simple moving average at 0.6532. A further break above this level would improve short-term price momentum and allow AUD/USD to challenge 0.6572 (last Friday's high) and the 0.6600 round-figure mark.
Consider shorting the Australian dollar at 0.6485 today, with a stop-loss at 0.6500 and targets at 0.6430 or 0.6420.
GBP/USD
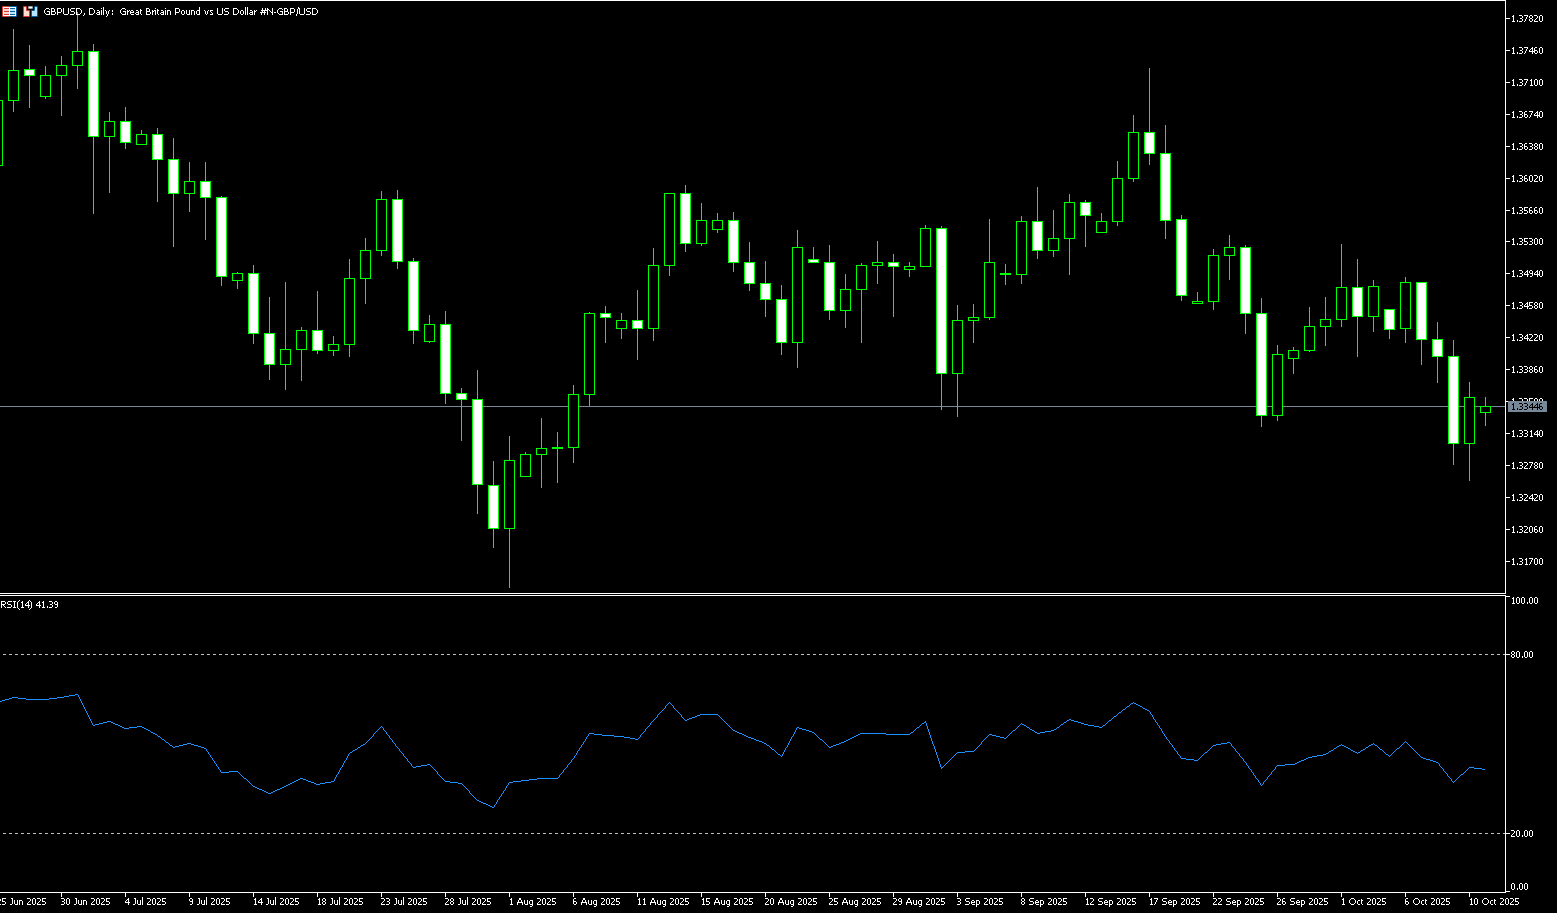
After falling from its high of 1.3490 early last week, GBP/USD fell for three consecutive days to a near two-month low of 1.3280. The pound stabilized above 1.3350 before the weekend, with the Bank of England's cautious policy tone providing a key support. Bank of England Monetary Policy Committee member Catherine Mann stated last Thursday that "monetary policy must remain tight for longer to create a favorable environment for economic growth." She added, "Inflation remains stubborn and the growth outlook remains weak." While the UK's policy stance supported the pound, the ongoing US government shutdown has fueled risk aversion, supporting the dollar. Meanwhile, the US Senate remains mired in a budget impasse and has failed to pass legislation to end the shutdown. The increased demand for safe-haven assets has led some investors to reallocate to US dollar assets, limiting further gains for the pound. In the short term, the pound is likely to remain range-bound between 1.3280 and 1.3450 against the US dollar, with further guidance from Fed officials and UK inflation data crucial.
On the daily chart, after three consecutive days of decline in early last week, the pound found respite and rebounded slightly around 1.3300 to 1.3280. The short-term moving averages are flattening, suggesting a temporary halt in upward momentum, but potential remains. GBP/USD's overall trend has become uncertain, having fallen to a near two-month low near its 180-day simple moving average, which trades around 1.3265. The 14-day Relative Strength Index (RSI) has slipped below 40.00, suggesting the start of renewed bearish momentum and potential for a correction. If support holds above 1.3280 (a near two-month low) and 1.3265 (the 180-day simple moving average), short-term targets could be 1.3420 (last Thursday's high) to 1.3400 (a round number). A break below this level could lead directly to 1.3469 (the 20-day simple moving average). Conversely, a break below the 1.3280-1.3265 support zone could trigger a pullback to the psychological support level of 1.3200, or even to the 200-day simple moving average at 1.3172, seeking support. Overall, the daily technical structure is slightly neutral, suggesting a potential rebound after a short-term correction.
Today, consider buying the British pound at 1.3350, with a stop-loss of 1.3336 and targets of 1.3420 and 1.3440.
USD/JPY
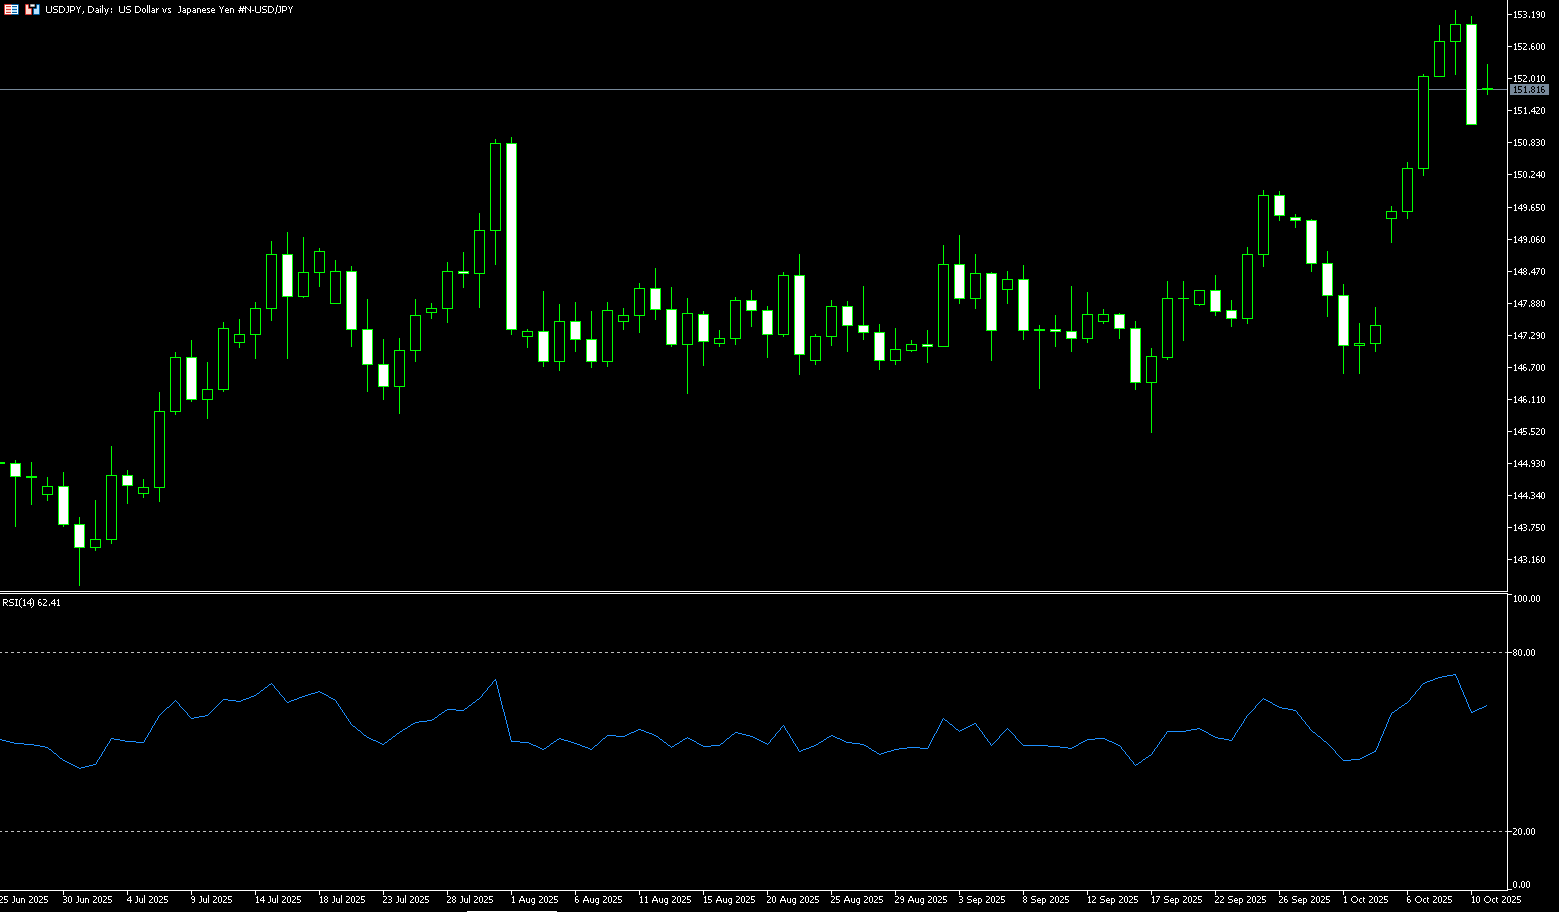
The yen continued to weaken due to a deteriorating fiscal outlook in Japan and expectations of policy easing, hovering near an eight-month low of 153.23 against the US dollar last week. While the market is betting the Bank of Japan may raise interest rates once more this year, new ruling party leader Sanae Takaichi's preference for expansionary fiscal policy has heightened concerns about Japan's fiscal health, potentially delaying monetary tightening. Subsequently, news that the Komeito Party will withdraw from its coalition government with the Liberal Democratic Party, coupled with US President Trump's announcement last Friday (October 10) that he will impose a 100% tariff on Chinese imports starting November 1 (or earlier), may have fueled increased risk aversion. The dollar plunged intraday against the yen, falling to a low of 151.15. Meanwhile, Takaichi's economic advisors, Etsuro Honda and Takuji Aida, also hinted that the Bank of Japan may tolerate one more rate hike by the end of the year or early next year, but will not rush to tighten policy. Meanwhile, the US dollar remained strong. Although the Federal Reserve may still cut interest rates twice this year, the US dollar index broke through a two-month high due to political uncertainty in Japan and France. The US government shutdown entered its second week, and the Senate repeatedly failed to pass a budget bill, but this does not seem to have weakened dollar buying.
Last week, the USD/JPY pair broke through key resistance at 151.00 and subsequently tested above the 152 and 153.00 levels, indicating that the bullish trend remains solid. The 14-day relative strength index (RSI) on the daily chart indicates a slight overbought condition, with some corrections occurring before the weekend, but the overall structure remains in an upward trend. If the pair holds above the support zone of 151.15 (October 10 low) to 151.00 (round-number mark), it could rally towards the 151.83 (5-day simple moving average) and the 152.00 (round-number mark), pushing the pair to the next relevant barrier, last week's high of 153.23. The ultimate target for bulls would be to recapture 154.00 for the first time since February 12. While the yen may find short-term safe-haven support, expectations of fiscal expansion and the Bank of Japan's cautious approach to rate hikes will limit its potential upside. A firm break below the 151.15-151.00 area could trigger a new decline towards 150.24 (October 7 low). A sustained break below this level could trigger some technical selling on the USD/JPY pair, dragging the spot price towards the strong psychological support of 150.00. A break would target the September 26 low of 149.41 and the 14-day simple moving average of 149.52.
Consider shorting the USD at 151.30 today. Stop-loss: 151.50, target: 150.30, 150.00.
EUR/USD
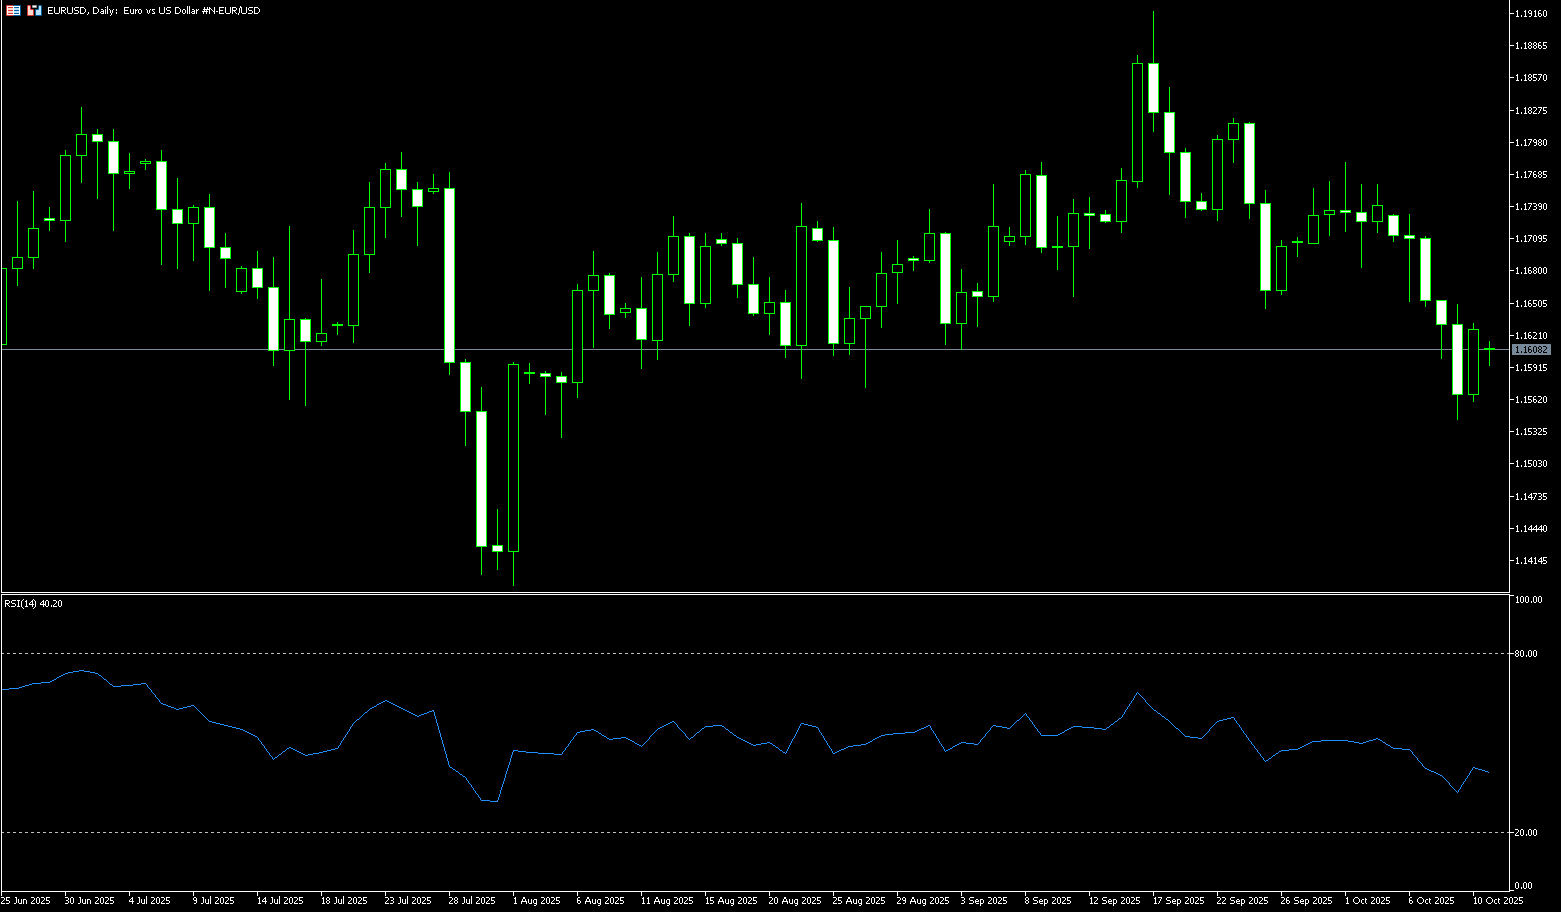
EUR/USD fell over 1.40% last week, reaching a near two-month low of 1.1542. Due to political and fiscal uncertainty in France, the euro has fallen over 1.4% so far this week and is on track for its worst weekly performance of the year. French President Emmanuel Macron's decision to form a new government rather than hold snap elections has temporarily eliminated the immediate risk of further far-right gains through vote-buying, easing market concerns about political chaos in the Eurozone's second-largest economy. This provides short-term breathing space for the euro and fuels short-covering. If former Prime Minister Jean-Marie Le Cornu's proposal to form a technocratic government "without political ambitions" were implemented, it could be seen as a pragmatic signal committed to addressing fiscal issues and help stabilize market sentiment. Even if a new government is formed, its ability to push through legislation in a hung parliament remains questionable. Both of Le Cornu's predecessors were forced to resign due to budget deadlocks, and whether the new government can break this deadlock is key to assessing the euro's medium- and long-term trajectory. National Rally leader Marine Le Pen has clearly stated that she will "vote against all bills," meaning any major legislation under the new government will face significant obstacles. This ongoing internal political conflict will hinder France's ability to implement necessary reforms and put continued pressure on the euro's underlying value.
The daily chart shows that EUR/USD briefly fell below the 100-day simple moving average of 1.1635 and the 1.1600 round-figure mark mid-week, before reaching a near two-month low of 1.1542, indicating a bearish bias in the short term. This indicates strong bearish momentum. The 14-day Relative Strength Index (RSI) is trending towards its neutral 50-line, suggesting weakening selling momentum. However, it remains below the 50-line midpoint. Under these circumstances, any technical rebound is likely to attract sellers. The first immediate support level is 1.1542 (last week's low), with a break below it pointing to the round-number mark at 1.1500. A break below this level would expose the 150-day simple moving average at 1.1467. The next level would be 1.1400. On the upside, the pair could find initial resistance near 1.1678 (9-day simple moving average), followed by last week's high of 1.1731. Further upside, the October 1 high of 1.1778 will be a key focus for bulls. A sustained break above 1.1778 would open the door to 1.1800 and the July 1 high of 1.1830.
Today, you can consider going long on EUR at 1.1605, stop loss: 1.1595, target: 1.1660; 1.1670
Disclaimer: The information contained herein (1) is proprietary to BCR and/or its content providers; (2) may not be copied or distributed; (3) is not warranted to be accurate, complete or timely; and, (4) does not constitute advice or a recommendation by BCR or its content providers in respect of the investment in financial instruments. Neither BCR or its content providers are responsible for any damages or losses arising from any use of this information. Past performance is no guarantee of future results.
Lebih Liputan


Pendedahan Risiko:Instrumen derivatif diniagakan di luar bursa dengan margin, yang bermakna ia membawa tahap risiko yang tinggi dan terdapat kemungkinan anda boleh kehilangan seluruh pelaburan anda. Produk-produk ini tidak sesuai untuk semua pelabur. Pastikan anda memahami sepenuhnya risiko dan pertimbangkan dengan teliti keadaan kewangan dan pengalaman dagangan anda sebelum berdagang. Cari nasihat kewangan bebas jika perlu sebelum membuka akaun dengan BCR.

 English
 简体中文
简体中文
 繁體中文
繁體中文
 Bahasa
Melayu
Bahasa
Melayu
 Tiếng
Việt
Tiếng
Việt
 ไทย
ไทย
 日本語
日本語
 한국어
한국어
 ភាសាខ្មែរ
 español