


0
US Dollar Index
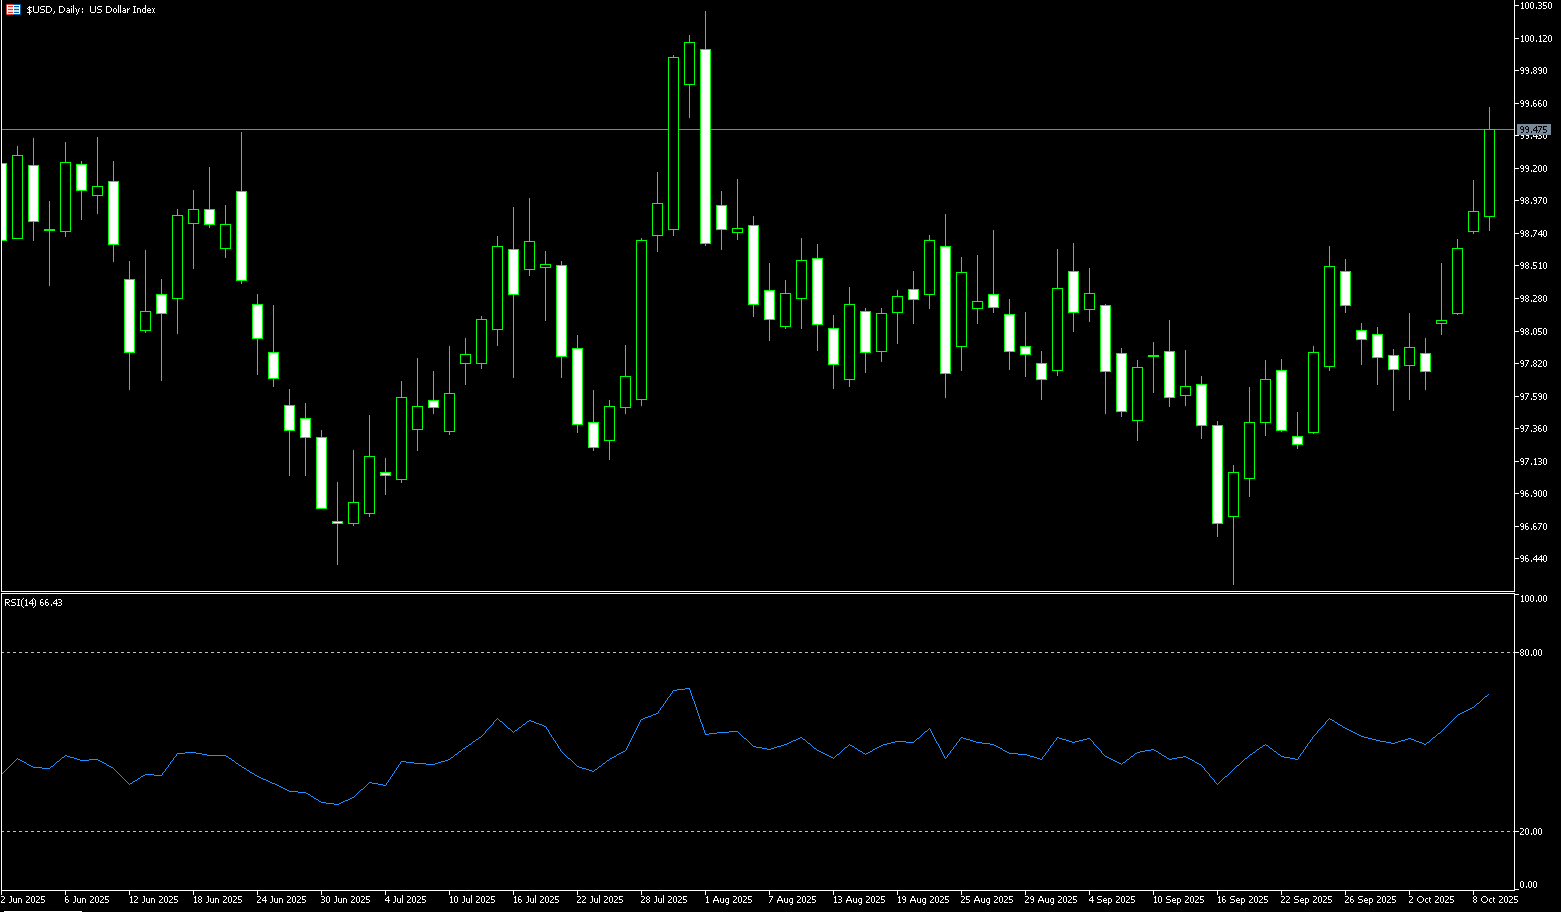
The US dollar index rose to 99.55 on Thursday, a two-month high, primarily supported by weakness in other major currencies. The dollar strengthened significantly against the yen, as conservative Sanae Takaichi won the Japanese leadership election, raising expectations for increased fiscal spending. Meanwhile, the euro remained under pressure from political uncertainty in France, despite President Macron's statement that a new prime minister could be appointed within 48 hours. Meanwhile, the ongoing government shutdown continued to delay the release of key economic data, leaving investors with only a few private sector indicators to assess economic conditions. Despite this, traders remain confident that the Federal Reserve will cut interest rates by 25 basis points twice this year, with the latest meeting minutes showing that policymakers are weighing downside risks to employment and persistent inflationary pressures.
The US dollar index formed a breakout pattern after hitting a low of 97.46 last week, then retraced to the neckline and continued its upward move. This week's rise broke through the upper edge of the previous consolidation range, which also represents the measured increase in the breakout pattern, effectively breaking through two key levels in one day. The current peak resistance level is near 100.00 (a psychological market barrier), which also serves as the bull/bear indicator for the US dollar index and the 50% percentile of the sharp bearish candlestick pattern from the August 1st non-farm payroll report. Strong downward pressure also limits further USD rebounds. Support currently lies at the upper edge of the range near 98.60 and below it at the psychological market barrier of 98.00. Resistance lies near 99.78 (the 165-day simple moving average). Subsequent resistance targets are at 100.00 (a psychological market barrier).
Today, consider shorting the US dollar index at 99.50, with a stop-loss at 99.60 and targets at 99.00 or 98.90.
WTI Spot Crude Oil
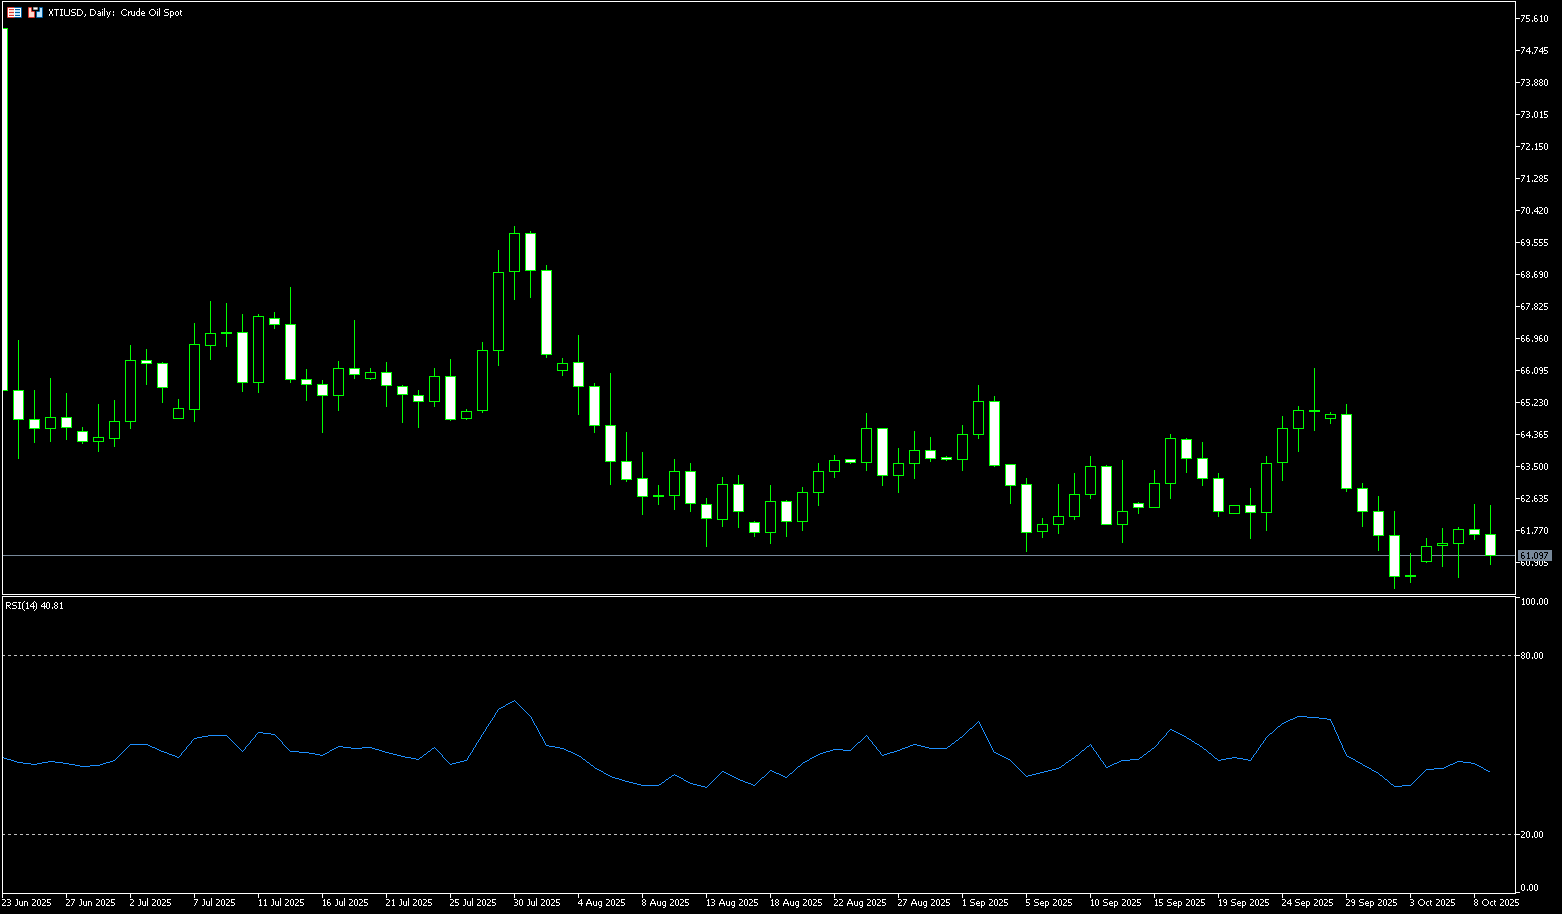
International oil prices closed lower after Israel and the Palestinian militant group Hamas signed a ceasefire agreement, marking a significant easing of tensions in the Middle East. Reports indicate that Israel and Hamas formally signed an agreement on Thursday, agreeing to a ceasefire in Gaza and the release of hostages, the first phase of US President Trump's plan to end the Gaza War. With the Israeli-Kazakh conflict nearing its end, crude oil futures are entering a technical correction. This peace agreement represents a major breakthrough in recent Middle Eastern history, with potentially far-reaching implications for the oil market. It could lead to a reduction in Houthi attacks in the Red Sea and increase the likelihood of a nuclear agreement with Iran. Earlier this week, the Organization of the Petroleum Exporting Countries and its allies (OPEC+) announced a small, smaller-than-expected production increase starting in November, easing concerns about oversupply. Prior to this, investors had anticipated continued sanctions against Russia due to the stalled Ukrainian peace talks, pushing oil prices up about 1% on Wednesday, reaching a new one-week high.
The daily chart shows that WTI crude oil prices have retreated again, trading below the 9-day simple moving average of $61.57. The converging Bollinger Bandwidth suggests volatility is in a "recompression" phase, potentially triggering a directional move. From a market perspective, the 9-day simple moving average at $61.57 is just below this week's low of $60.50. A break below this level could extend the decline to the psychologically important $60 level, forming a "double bottom" around $60.22 (the October 2 low). Upward resistance lies primarily at the 9-day simple moving average at $61.57, followed by the 20-day simple moving average at $62.67, and further still at the round-number high of $63.
Consider going long on crude oil at $60.90 today. Stop loss: $60.70, target: $62.50, $62.80.
Spot Gold
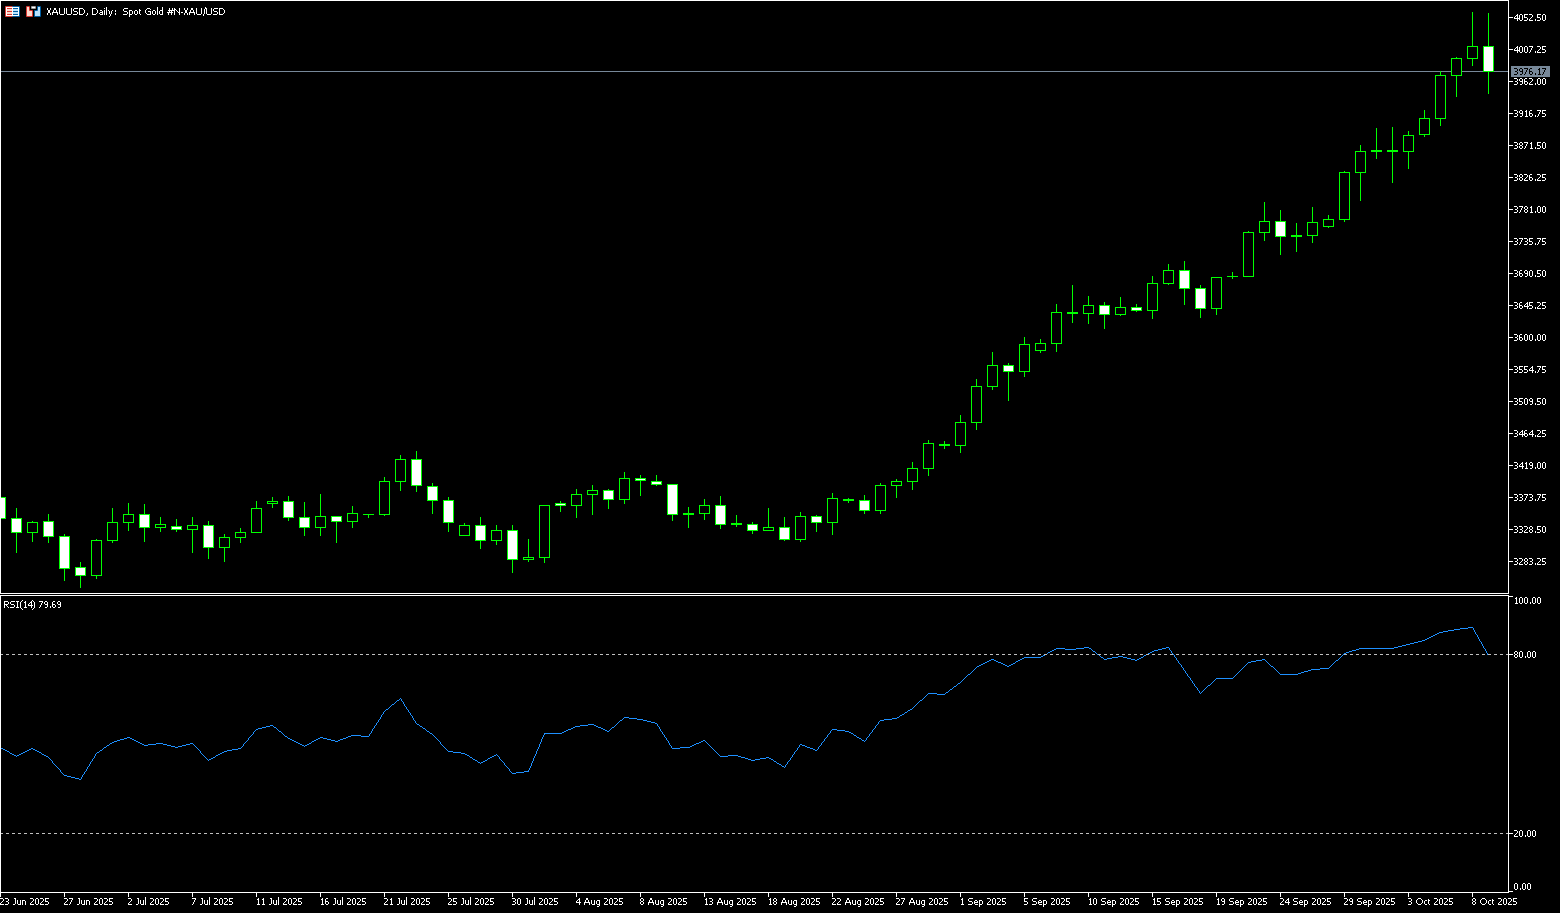
Gold fell 2% on Thursday, falling below $4,000 per ounce to a low of $3,944.50, as the dollar strengthened and investors took profits following the ceasefire agreement between Israel and Hamas. The dollar index rose 0.5% to a two-month high, making gold more expensive for overseas buyers. Some speculators reduced their positions as geopolitical tensions eased, though confidence in a broader rally remained high. The Federal Reserve resumed its rate-cutting cycle in September with a 25 basis point cut, and traders widely expect further cuts in October and December. The latest FOMC minutes showed that officials saw rising risks in the labor market but remained cautious about stubborn inflation. The ongoing U.S. government shutdown, now in its second week, has delayed key data releases and heightened market anxiety. Despite the pullback, gold is still up approximately 52% this year, supported by central bank purchases, strong ETF inflows, and expectations of further Fed rate cuts.
After holding above $4,000 late this week, gold prices retreated and fell below the $4,000 mark to a low of $3,944.50. Wednesday's low of $3,919 and the 9-day simple moving average of $3,918 are likely to provide strong support and attract fresh buying. However, caution is advised: if gold prices definitively break below this support range, it could trigger some long position liquidation, dragging gold prices down to the next key support level of $3,900 (round mark). If the upward trend continues, it could potentially test the psychologically important $4,000 level and potentially reach the all-time high near $4,059.
Consider going long on gold at $3,970 today, with a stop-loss at $3,065 and a target of $4,000 and $4.010.
AUD/USD
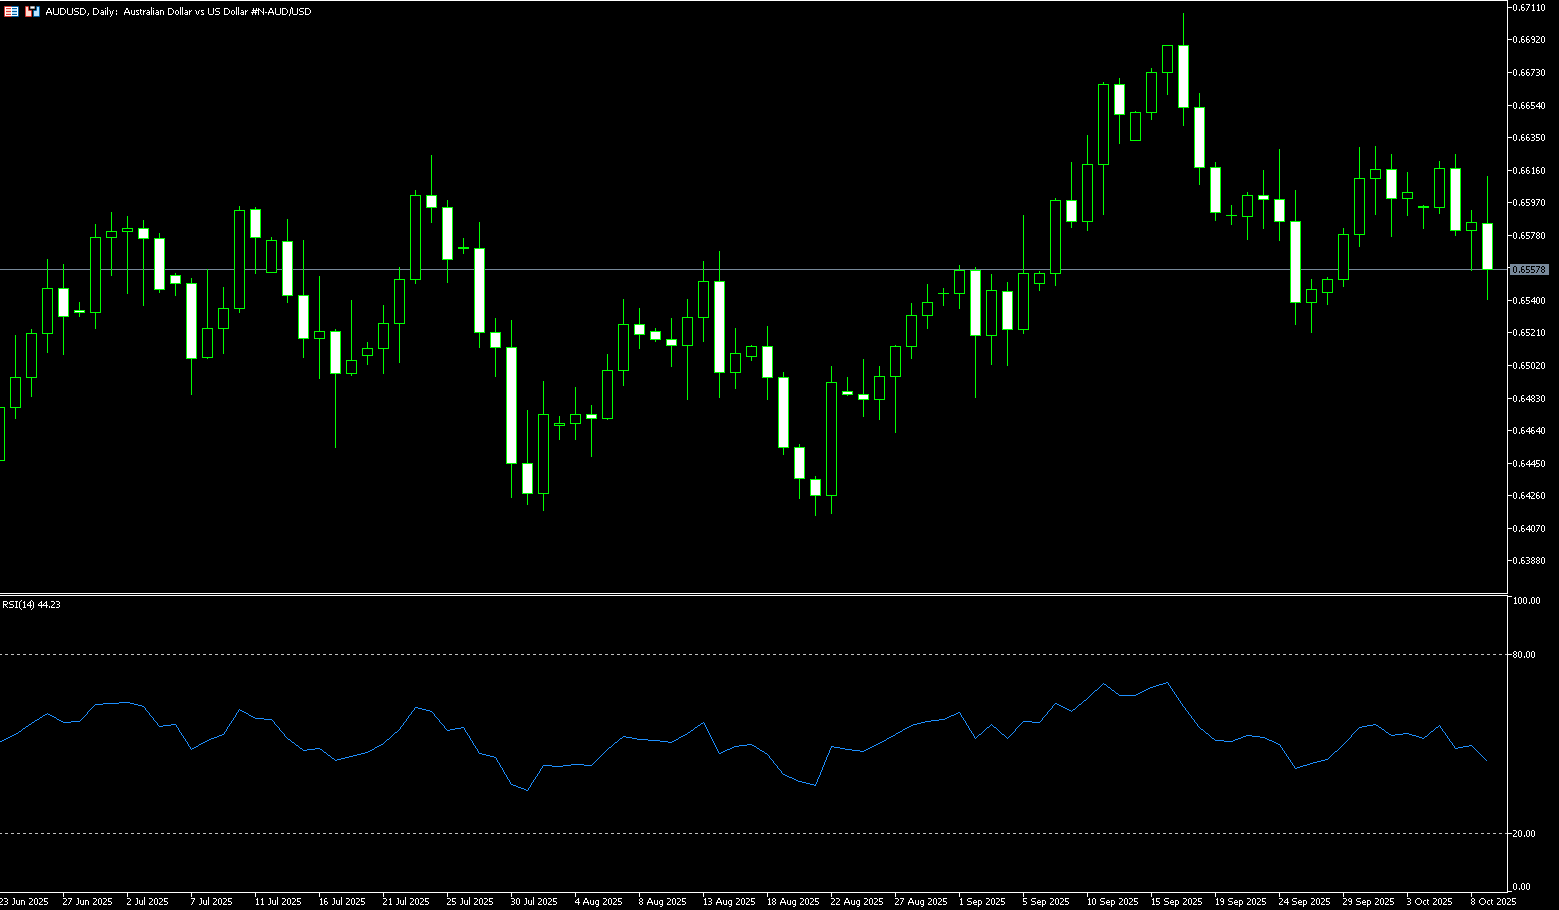
The Australian dollar fell slightly against the US dollar on Thursday. AUD/USD rose following the release of Australia's October consumer inflation expectations, which edged up to 4.8% from 4.7% previously, reaching their highest level since June. Heightened concerns that Australia's third-quarter inflation could exceed expectations are supporting a cautious stance on the Reserve Bank of Australia (RBA). The RBA is expected to maintain its official cash rate unchanged at 3.6% following its September decision. The Reserve Bank warned that inflation has proven more persistent than expected, particularly in the services sector, while the labor market remains tight. China's Ministry of Commerce announced Thursday that it will tighten rare earth export rules, effective December 1st. Foreign companies and individuals will now be required to obtain dual-use export licenses for rare earth exports.
AUD/USD traded below 0.6600 on Thursday. Technical analysis on the daily chart suggests the pair has dipped slightly but maintains a persistent bullish bias. Furthermore, the 14-day relative strength index (RSI) is above 46, further reinforcing the bullish bias. On the upside, AUD/USD could test the psychologically important 0.6600 level, with a break below 0.6660 (the September 18 high), and the 0.6700 round-figure mark. A break above these levels could lead to the 12-month high of 0.6707 reached on September 17th. On the downside, the first target is 0.6539 (the 89-day simple moving average), followed by the 0.6500 round-figure mark. A break below this key support level could trigger a bearish bias.
Consider a long position on the Australian dollar at 0.6545 today, with a stop-loss at 0.6532 and targets at 0.6600 and 0.6610.
GBP/USD
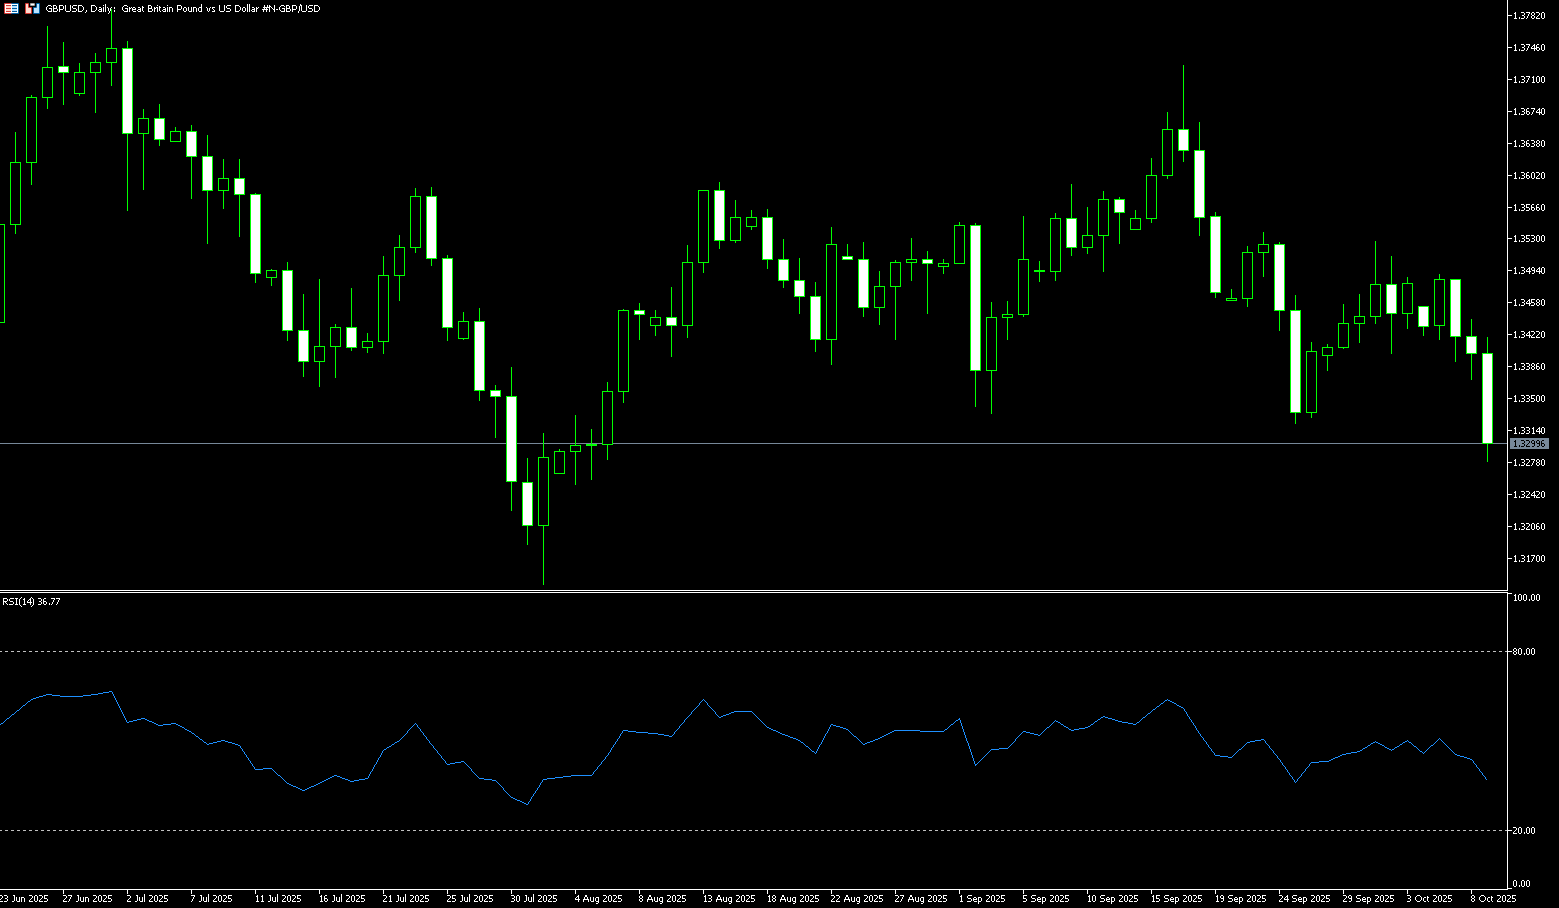
The British pound fell to $1.3300, a two-month low, pressured by a stronger dollar and concerns ahead of the UK's November budget. Traders are concerned that potential tax increases to meet fiscal targets could weigh on an already fragile economy and currency. Chancellor of the Exchequer Rachel Reeves, who is expected to deliver her budget on November 26, is likely to focus on fiscal discipline, possibly through tax hikes—repeating her previous move to increase employer social security contributions by £25 billion. Analysts expect moderate growth in the UK through 2025, with inflation rising to 4%, double the Bank of England's target. The market expects the Bank of England to refrain from further rate cuts until April of next year, with two cumulative rate cuts by the end of 2026.
Overall, the exchange rate is in a phased correction, awaiting new fundamental catalysts. On a daily chart, GBP/USD fell to the 1.3300 level and is currently trading in a wide range between 1.3300 and 1.3310. The pair remains subdued and is expected to remain below the 1.3500 round number for the foreseeable future. Resistance lies at the 50-day moving average (1.3474), the 20-day moving average (1.3484), the 100-day moving average (1.3499), and the 1.3500 round number. On the other hand, a further break below 1.3300 would clear the path to the August 5 low of 1.3259. A break below this level would further target the 1.3200 round number.
Consider going long on the British pound at 1.3290 today, with a stop loss at 1.3280 and targets at 1.3350 and 1.3360.
USD/JPY
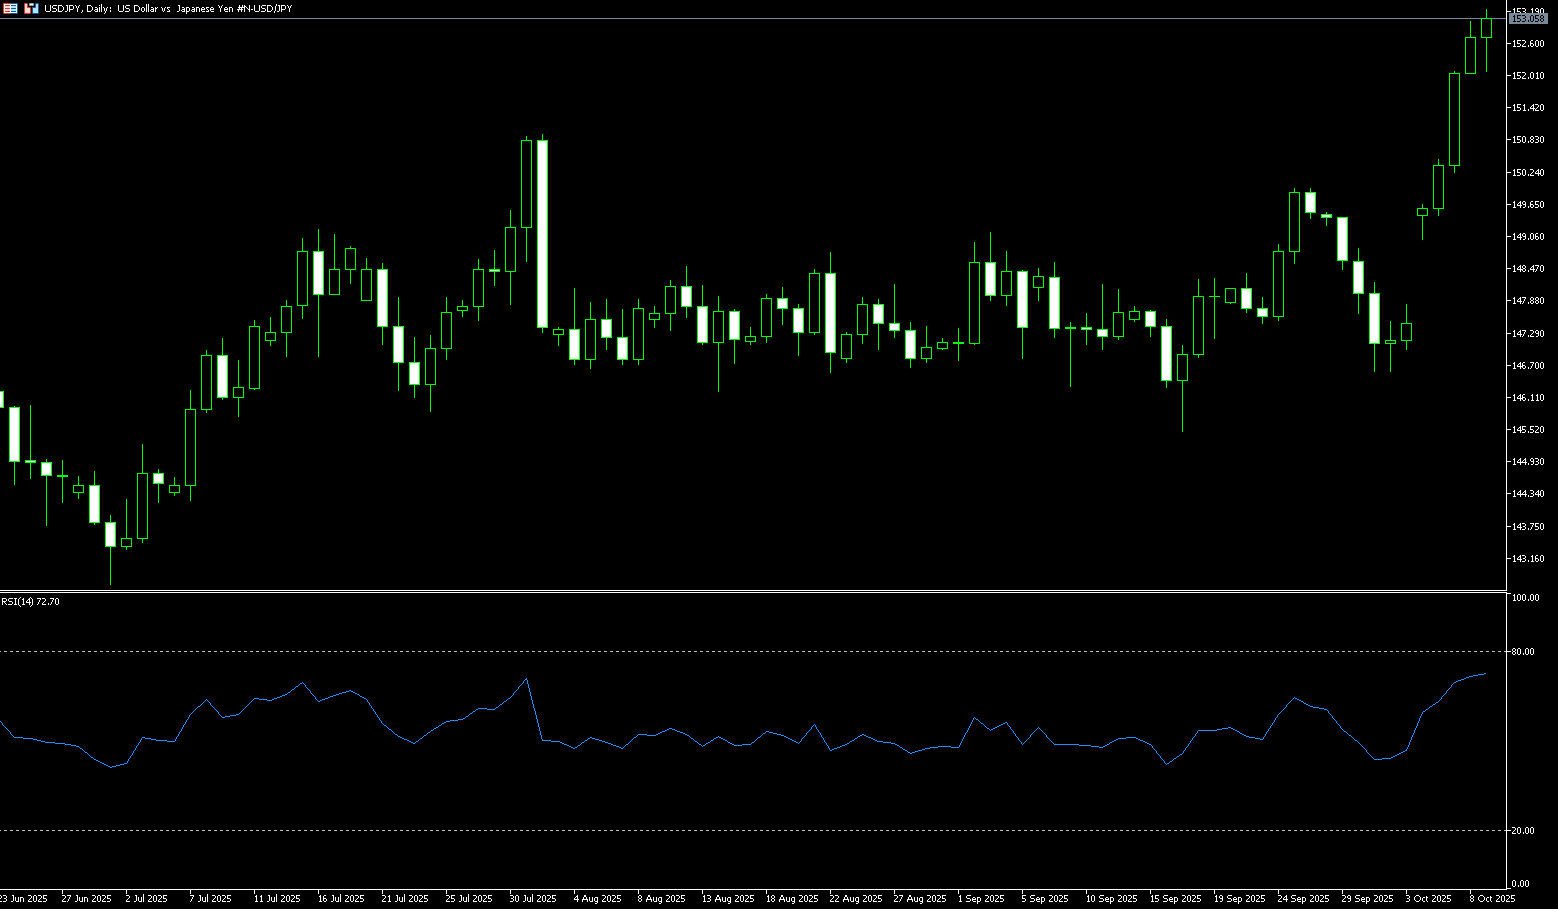
The yen weakened to around 153 yen per dollar on Thursday, its lowest level since February, as political turmoil and weak economic data dampened the prospects for a Bank of Japan rate hike. Conservative Party leader Sanae Takaichi, a staunch supporter of Abenomics' stimulus approach, won a leadership victory, making her a likely candidate to become Japan's next prime minister and fueling expectations for higher fiscal spending and continued accommodative monetary policy. Meanwhile, real wages in Japan fell 1.4% in August from a year earlier, extending an eight-month decline as inflation continued to outpace wage growth. Bank of Japan Governor Kazuo Ueda recently indicated that the central bank could raise interest rates if the economy and prices develop as expected, although he highlighted downside risks to growth. Investors now await Friday's producer inflation data for further policy cues.
The daily chart shows the 14-day Relative Strength Index (RSI) in overbought territory (most recently at 72.30), limiting traders from placing new bullish bets on USD/JPY. However, any subsequent pullback could attract new buyers and maintain support around the 152.00 round number. Wednesday's low, around 151.74, if broken, could trigger some technical selling and drag the spot price down to the strong 151.00 level. On the other hand, the 153.00 round number, or Thursday's more than two-month high of 153.23, now appears to be an immediate obstacle. A sustained strong break above this level would reaffirm the positive outlook and propel the pair to the next relevant hurdle, near the 153.70-153.75 area, with bulls ultimately aiming to recapture the 154.00 level for the first time since February 12.
Consider shorting the US dollar at 153.30 today. Stop-loss: 153.50, target: 152.50
EUR/USD
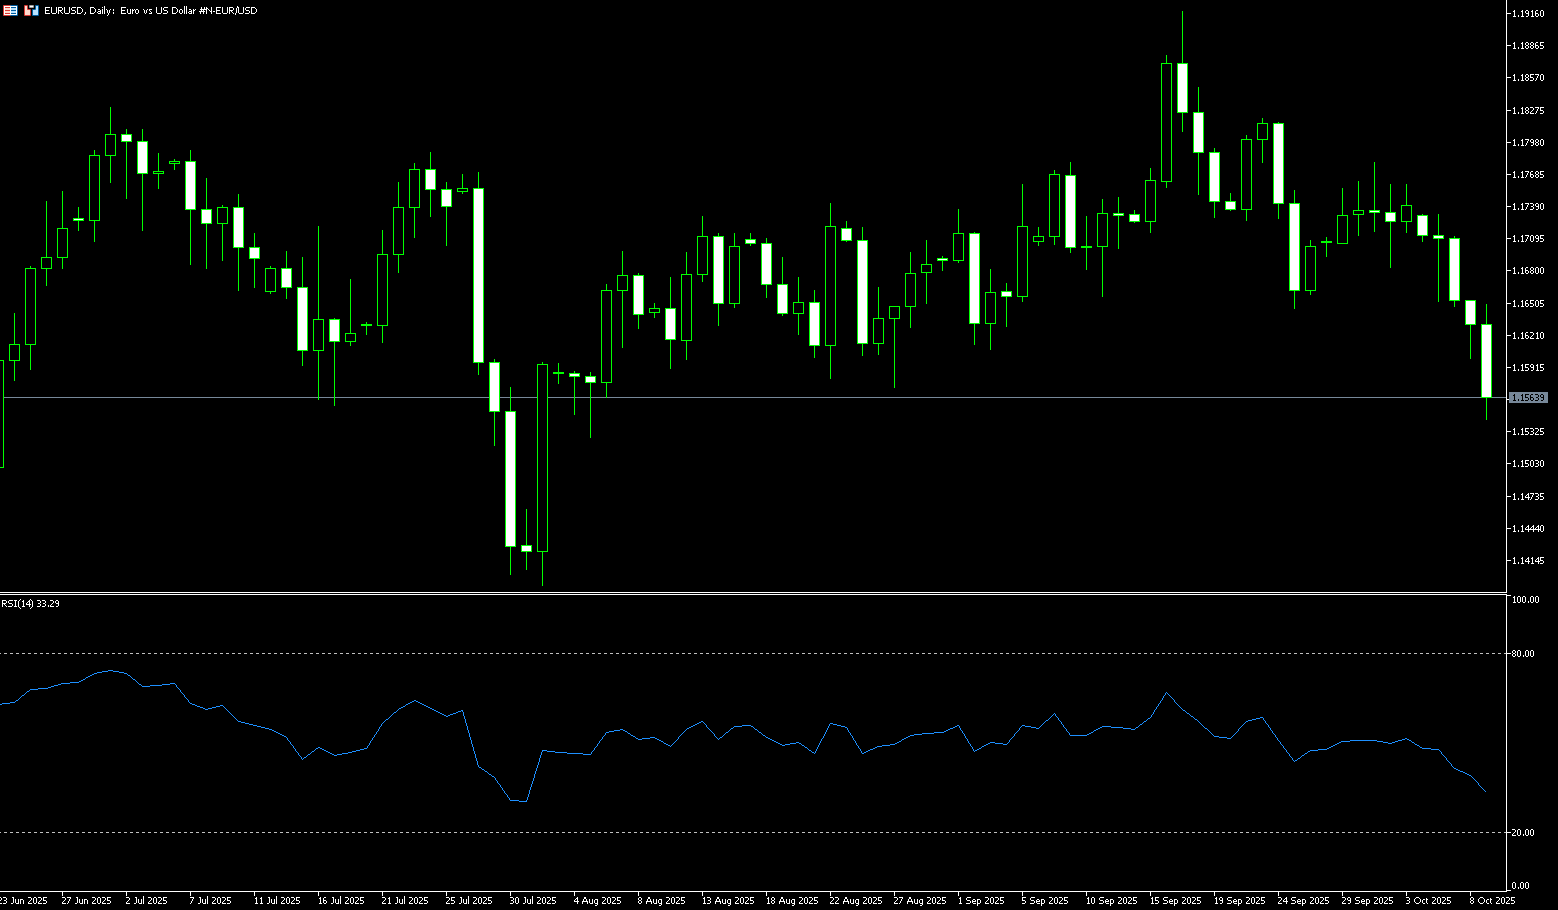
EUR/USD continued its decline for four consecutive days this week, reaching a near two-month low of 1.1542. The US government shutdown persisted, and the minutes of the last Federal Reserve meeting showed officials remained cautious about inflation despite some easing of policy. Thursday's rebound saw the pair fluctuate between 1.1645 and 1.1650. The euro's weakness was primarily driven by political turmoil in France, where outgoing Prime Minister Sebastien Lecornu indicated progress in negotiations with parliamentary groups and that President Emmanuel Macron could appoint a new prime minister within 48 hours. Furthermore, the Fed minutes indicated policymakers are willing to cut interest rates further this year, but many expressed concerns about inflation. On the data front, the US economic calendar remained absent, but in Europe, German industrial production data plummeted 4.3% month-over-month, raising concerns about a recession in the region's largest economy.
The daily chart shows a neutral to downside trend for EUR/USD, trading below the 1.1600 round-number mark, suggesting a potential range-bound trade between 1.1600 and 1.1500. The 14-day Relative Strength Index (RSI) is showing a bearish signal (currently at 36.60), suggesting that sellers are gaining momentum. If EUR/USD holds below the August 27 low of 1.1574 and the 120-day simple moving average of 1.1570, the 1.1500 round-number mark and the 1.1458 150-day simple moving average are next. On the upside, the first resistance level for EUR/USD is 1.1600. The next key resistance level is 1.1664, the 89-day simple moving average. Further resistance is likely to target 1.1700.
Today, consider going long on the Euro at 1.1550, with a stop-loss at 1.1540 and a target of 1.1610 or 1.1620.
Disclaimer: The information contained herein (1) is proprietary to BCR and/or its content providers; (2) may not be copied or distributed; (3) is not warranted to be accurate, complete or timely; and, (4) does not constitute advice or a recommendation by BCR or its content providers in respect of the investment in financial instruments. Neither BCR or its content providers are responsible for any damages or losses arising from any use of this information. Past performance is no guarantee of future results.
Lebih Liputan


Pendedahan Risiko:Instrumen derivatif diniagakan di luar bursa dengan margin, yang bermakna ia membawa tahap risiko yang tinggi dan terdapat kemungkinan anda boleh kehilangan seluruh pelaburan anda. Produk-produk ini tidak sesuai untuk semua pelabur. Pastikan anda memahami sepenuhnya risiko dan pertimbangkan dengan teliti keadaan kewangan dan pengalaman dagangan anda sebelum berdagang. Cari nasihat kewangan bebas jika perlu sebelum membuka akaun dengan BCR.

 English
 简体中文
简体中文
 繁體中文
繁體中文
 Bahasa
Melayu
Bahasa
Melayu
 Tiếng
Việt
Tiếng
Việt
 ไทย
ไทย
 日本語
日本語
 한국어
한국어
 ភាសាខ្មែរ
 español