


0
US Dollar Index
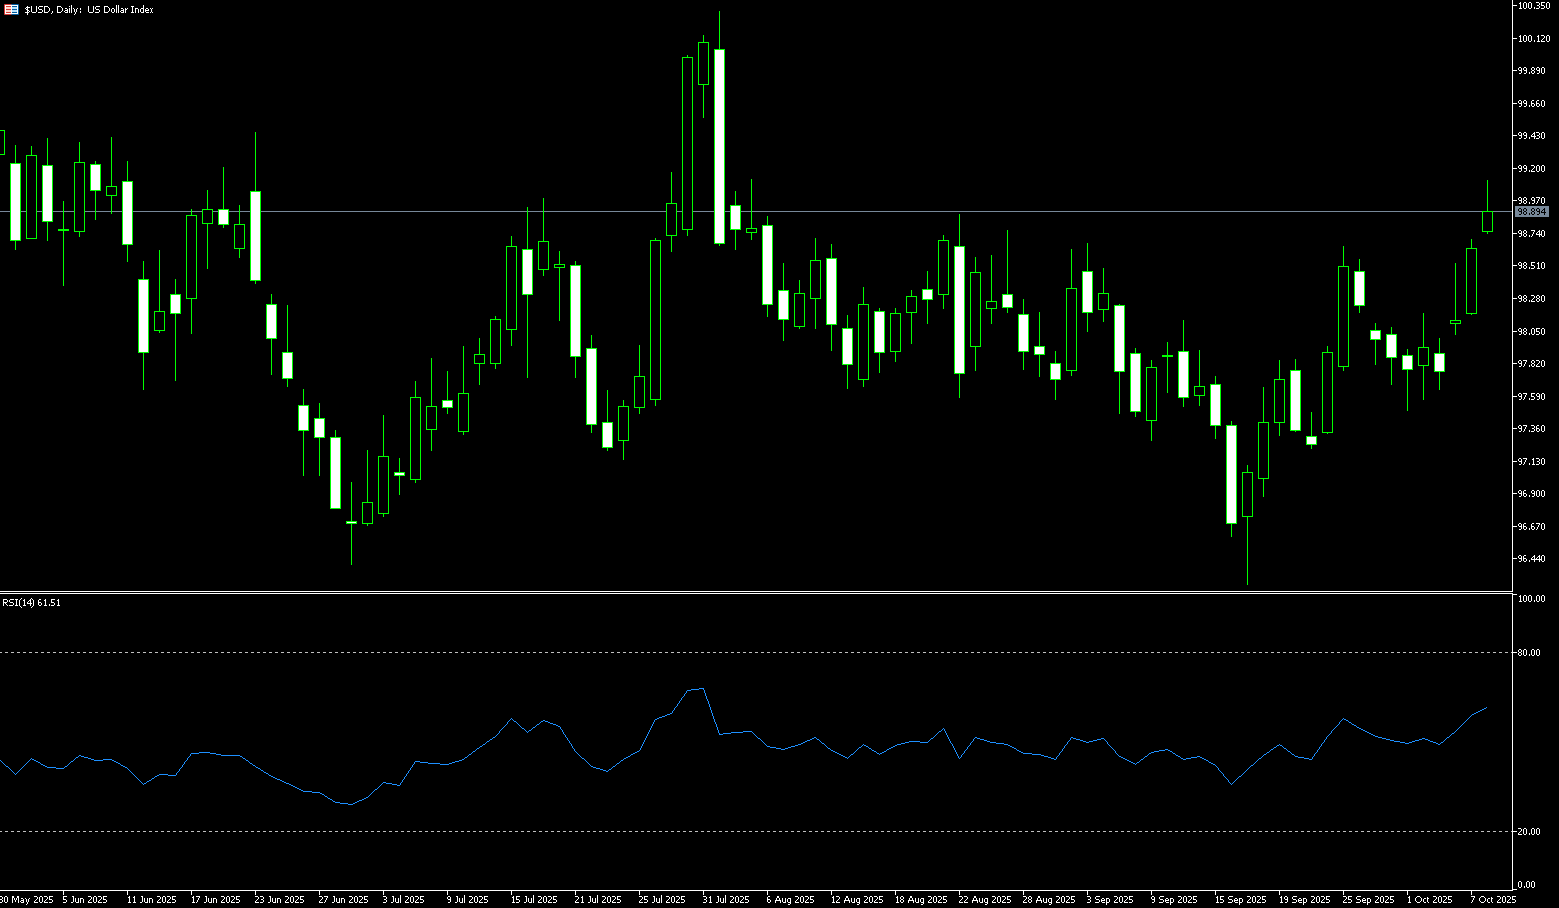
The US dollar index (USD Index) climbed just below 99.00 on Wednesday, reaching its highest level in two months, as investors turned to safe-haven assets amid ongoing concerns about the potential economic impact of the US government shutdown. The shutdown, entering its second week with no clear resolution, has clouded the outlook, delayed key data releases, and increased pressure on policymakers to reach a deal. On the monetary front, the Federal Reserve is widely expected to cut interest rates by 25 basis points this month, with another cut possible in December. Markets now await policy cues from the FOMC meeting minutes and speeches by several Fed officials, including Chairman Jerome Powell. The US dollar gained the most against the New Zealand dollar after the Reserve Bank of New Zealand unexpectedly cut interest rates by 50 basis points, while strengthening against its major peers amid heightened political uncertainty in France and Japan.
Observing the US dollar's price action, the US dollar index is trading within an ascending channel extending from its yearly low, with the opening range for the week forming just below its midline. Key resistance levels lie around 99.11 (the 145-day moving average) and 99.30 (the 76.4% Fibonacci retracement level from 100.26 to 96.22). Only a breakout/close above these resistance areas would confirm the formation of a more significant bottom. Subsequent resistance targets would be the 160-day moving average at 99.61. Ultimately, a breakout above the 2024 low/close at 100.15/35 would be necessary to confirm a broader trend reversal. A break below 98.40 (the 110-day moving average) could trigger a retest of the previous low. Subsequent support is seen at 98.00 (the psychological market level).
Consider shorting the US Dollar Index at 98.98 today, with a stop-loss at 99.10 and targets at 98.40 and 98.50.
WTI Spot Crude Oil
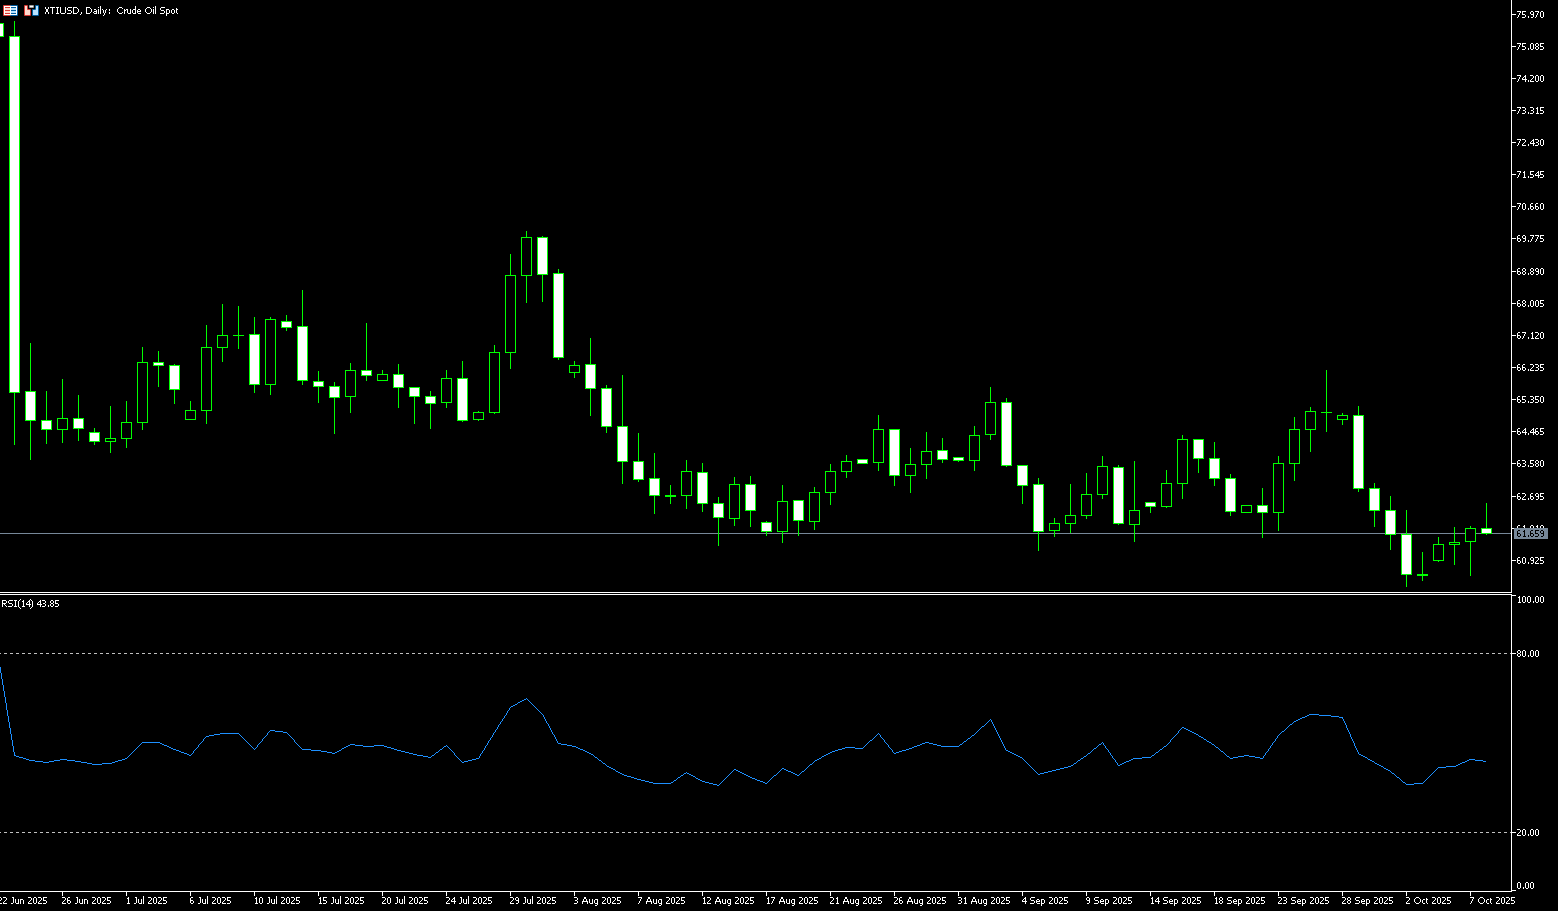
WTI crude oil futures rose to around $62.00 per barrel on Wednesday, extending recent gains as more modest OPEC+ production increases continued to support prices. The group recently opted for a restrained production increase, the lowest of the various options discussed, falling short of market expectations for a more aggressive increase. Meanwhile, Russian crude oil exports have remained at a 16-month high for the past four weeks, but signs of impact from Ukrainian drone attacks on Russian refineries have forced exports to be rerouted to alternative terminals. On the bearish side, the U.S. Energy Information Administration projects U.S. production will reach a higher-than-expected record this year, while industry data showed inventories rose by 2.78 million barrels last week, exceeding expectations for a 2.25 million barrel increase.
In the short term, the oil market will remain range-bound amidst fundamental recovery and policy uncertainty. Oil prices are likely to remain firm in the $60 to $62 range. On a daily chart, WTI crude oil is forming a "double bottom" support pattern near the psychological $60 mark and the $60.22 area (low on October 2nd). The technical structure suggests limited short-term downside. Crude oil is currently trading below its 20-day simple moving average at $62.72. A break above this resistance level could lead to further gains towards $63.97 (the 65-day simple moving average) and the $64 mark. Conversely, a break below the $61.23 (the 65-day simple moving average) and the $61.00 mark (round number) could lead to a retest of the psychological $60 mark and the "double bottom" formed near $60.22 (low on October 2nd).
Consider going long on crude oil at 61.85 today. Stop-loss: 61.70, target: 63.30, 63.50.
Spot Gold
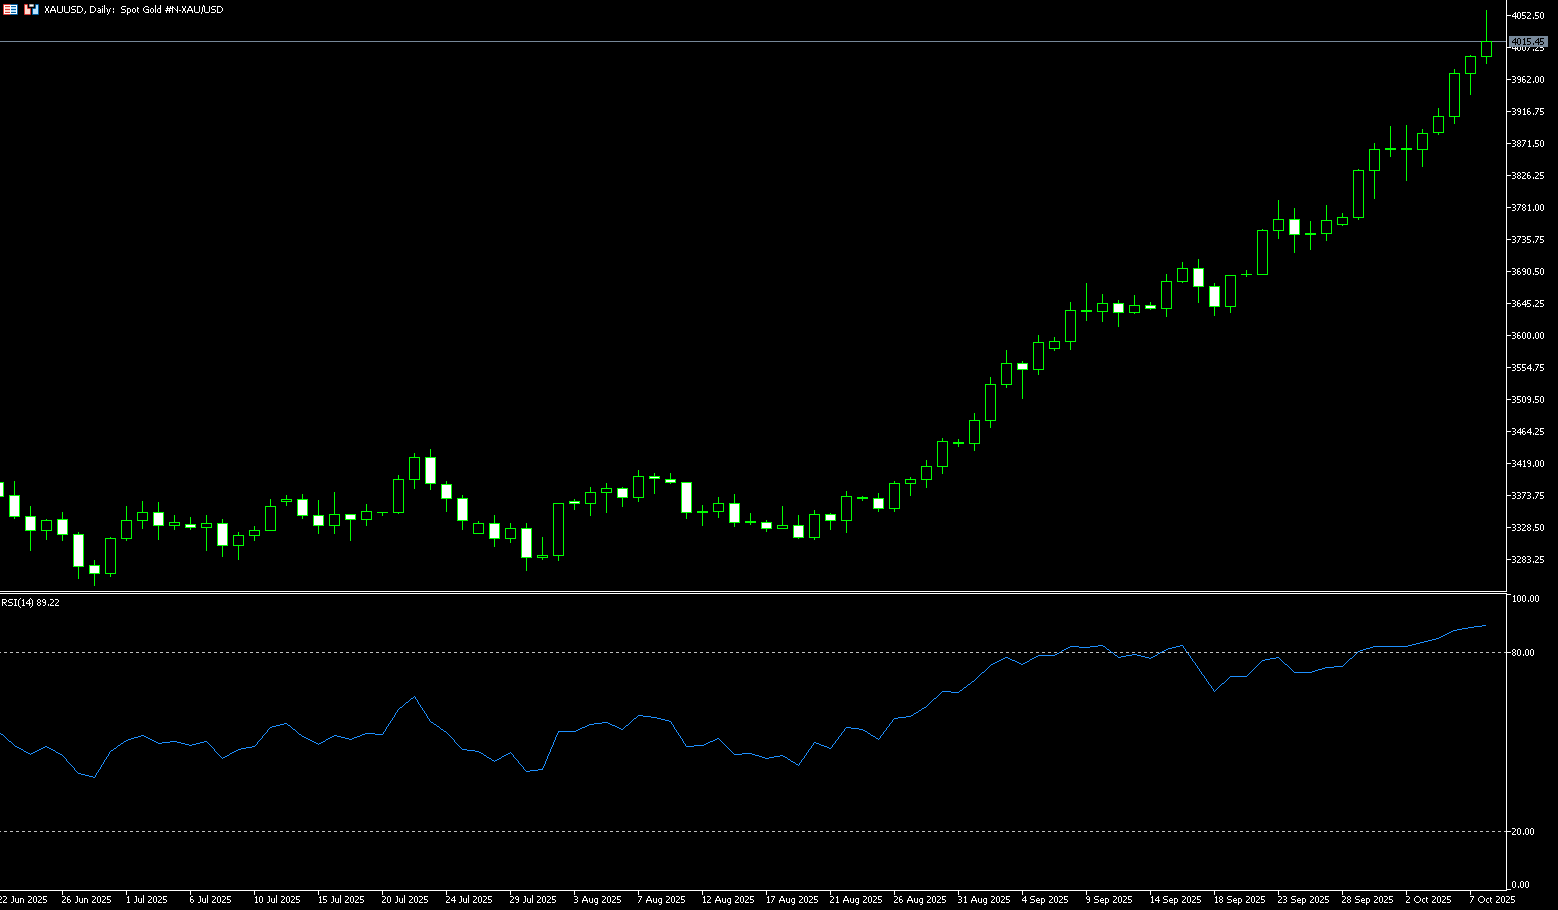
Gold broke through $4,000 per ounce to $4,059.30 on Wednesday, reaching a new milestone as investors fled to safe-haven assets amid global economic uncertainty and the Federal Reserve's dovish outlook. The US government shutdown, now in its second week, has delayed key economic data, complicating assessments of the nation's economic health. Despite the uncertainty, traders are pricing in 25 basis point interest rate cuts in October and December. Meanwhile, ongoing political turmoil in France and a recent leadership change in Japan have added further uncertainty to global markets. Gold has risen over 50% this year, driven by trade tensions, geopolitical volatility, and a weaker dollar. Central banks also continue to actively purchase gold, and last month's Fed rate cut further fueled inflows into gold-backed ETFs, which saw their largest monthly inflow in over three years in September.
Gold broke through $4,000 per ounce on Wednesday, reaching $4,059.30, marking its third all-time high this week. Gold prices continue their upward trend, seemingly poised to test the $4,200 mark in the short term. The current all-time high is $4,059.30. The 14-day relative strength index (RSI) on the daily chart remains in overbought territory at 86.60, but its slope remains upward. The next key resistance levels for gold are $4,075, followed by $4,100. Conversely, initial support lies at $3,983 (Wednesday's low), followed by the 5-day simple moving average at $3,943.
Consider going long on gold at 4,035 today. Stop loss: 4,030, target: 4,060, 4.070.
AUD/USD
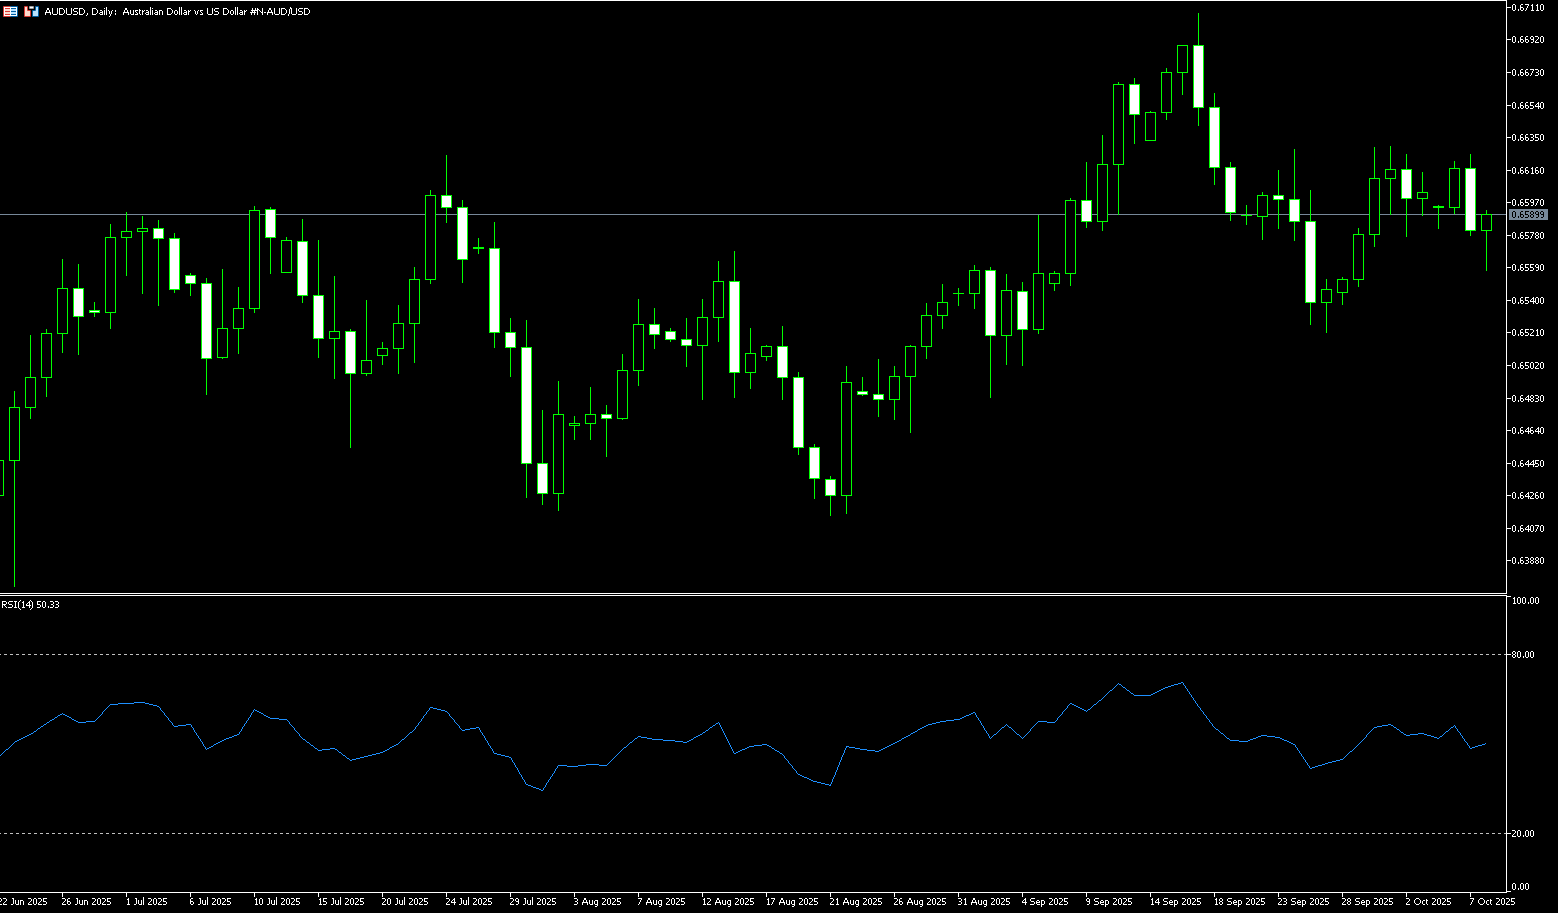
The Australian dollar fell against the US dollar on Wednesday, extending its decline for the second consecutive trading day. The pair weakened to as low as 0.6560 due to investment outflows. The AUD faced challenges following the release of weak housing data on Wednesday. Australia's private dwelling approvals fell 2.6% month-over-month to 9,027 units in August, in line with expectations, reversing a 1.3% increase in the previous month. Meanwhile, seasonally adjusted building permits fell 6% month-over-month to 14,744 units in August, after a 10% drop, marking the second consecutive month of decline. Downside for AUD/USD may be limited due to the cautious tone surrounding the Reserve Bank of Australia (RBA). The RBA is expected to keep interest rates unchanged in September, having previously decided to keep the official cash rate at 3.6%. The RBA warned that inflation has been more persistent than expected, particularly in the services sector, while the labor market remains tight.
AUD/USD traded around 0.6586 on Wednesday. Technical analysis on the daily chart suggests the pair remains within an ascending channel, indicating a sustained bullish bias. Furthermore, the 14-day relative strength index (RSI) has retreated below 50, reinforcing the bearish bias. On the upside, the pair could rally above the psychologically important 0.6600 level. A break above this level would improve short-term price momentum and support the pair's pursuit of 0.6660 (the September 18 high) and the 0.6700 round-figure mark. A break below this level would open the door to the 12-month high of 0.6707 reached on September 17. Immediate support lies at 0.6520 (the September 26 low), a break of which would expose the 0.6500 round-figure mark.
Consider going long on the Australian dollar at 0.6575 today, with a stop-loss of 0.6560 and targets of 0.6620 and 0.6630.
GBP/USD
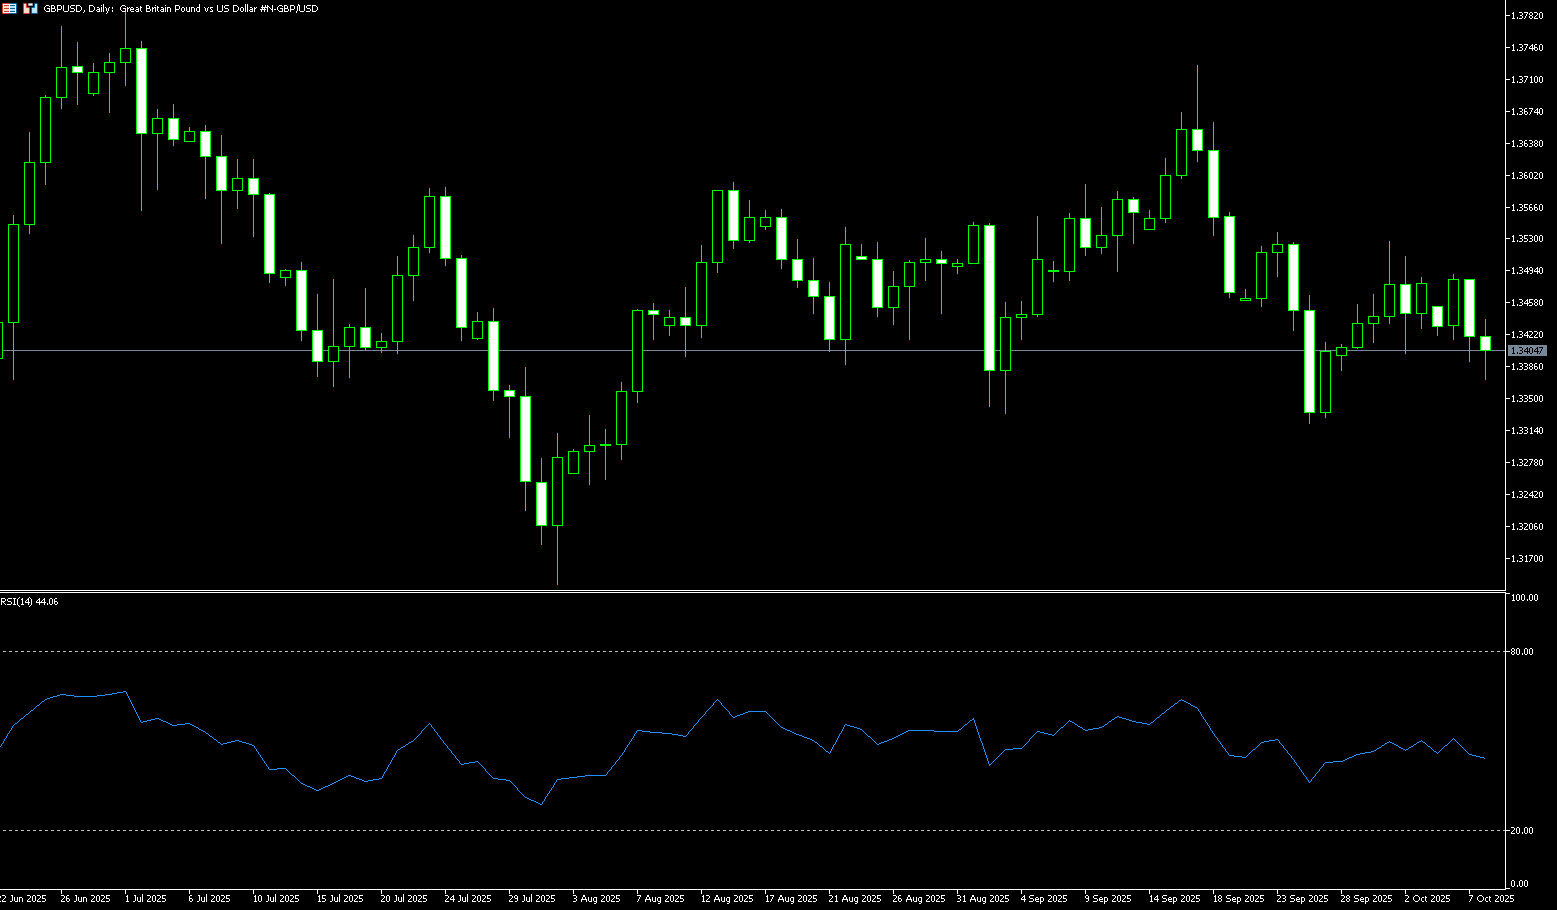
GBP/USD dipped slightly against the US dollar in early trading on Wednesday, as market expectations for another Bank of England rate cut rose for the rest of the year. Growing dovish expectations for the Bank of England due to growing concerns about the UK labor market weighed on GBP/USD. Concerns about persistent inflation, weak economic growth, and a loosening labor market are likely to influence the Bank of England's decision-making. So far, the Bank of England has maintained a "gradual and cautious" approach to monetary easing. Traders are watching for any signs of when the US federal government will reopen. A prolonged US federal government shutdown could weigh on the US dollar and provide support for major currency pairs. The government shutdown, now in its second week, was triggered by the failure of US senators to pass a spending bill to reopen the federal government.
This week's weakening of the British pound was expected. The GBP/USD exchange rate accelerated its decline after the opening of the week, giving up some of the gains accumulated during Monday's trading. It's particularly noteworthy that political factors have recently significantly increased their weight in driving the foreign exchange market. Despite the UK's own budgetary challenges, this has already created a certain degree of risk aversion among capital market investors. GBP/USD's technical chart shows a neutral to downside bias, although it remains above its 160-day simple moving average of 1.3345. The next key level to watch is 1.3300. However, a daily close above 1.3400 could push it towards the 5-day simple moving average of 1.3445. A break above the latter would expose the 1.3500 level.
Consider a long position on the British pound at 1.3390 today, with a stop-loss at 1.3380 and targets at 1.3450 and 1.3460.
USD/JPY
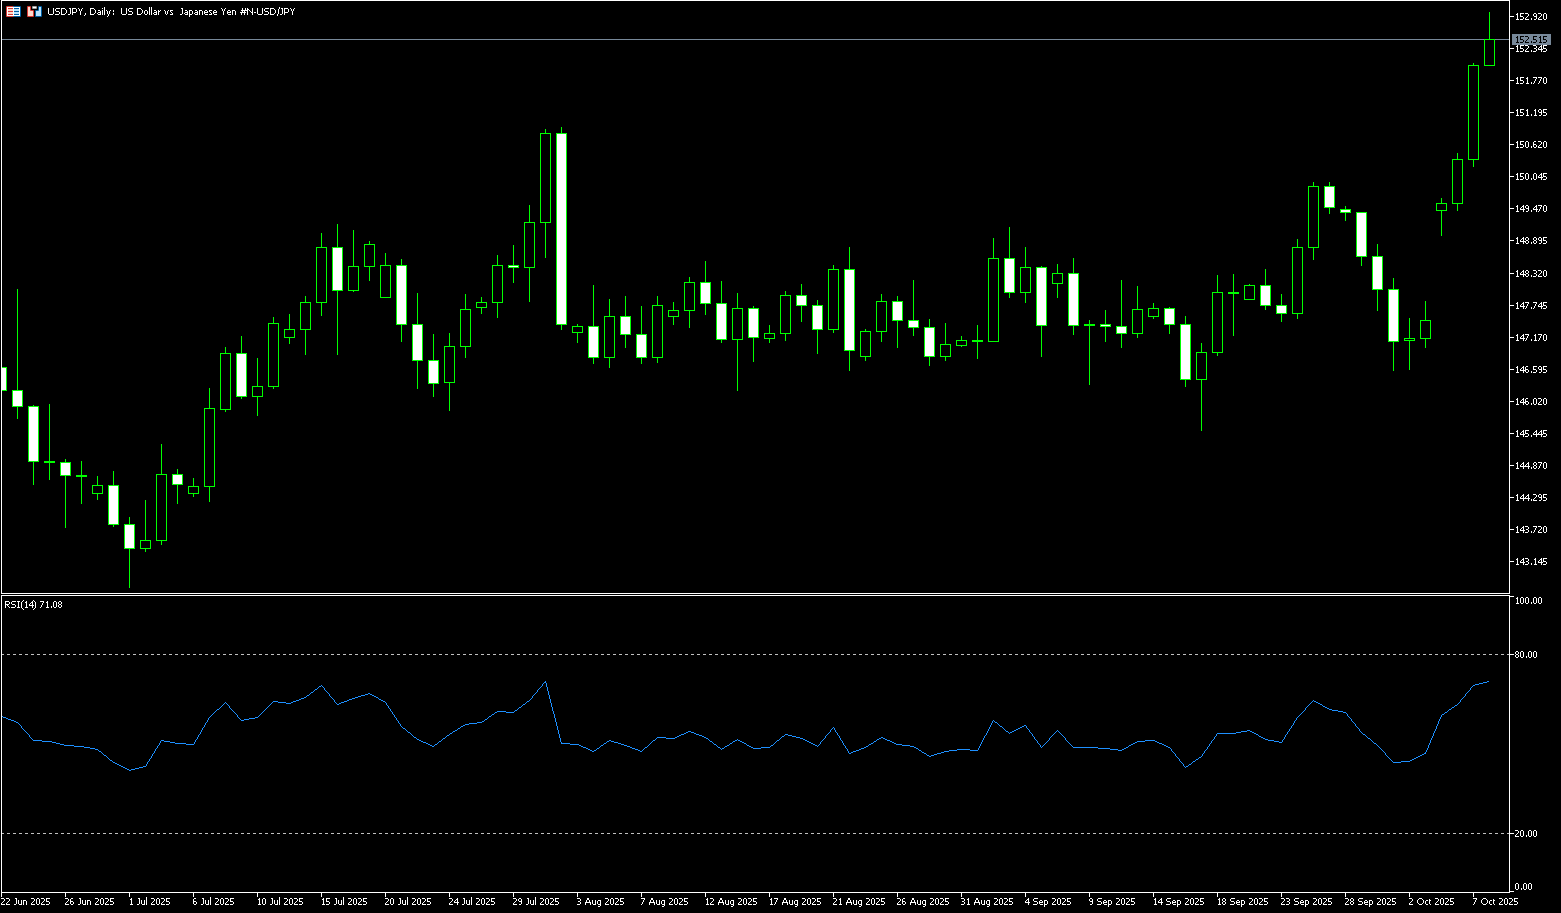
The yen faced heavy selling for the third consecutive day on Wednesday, falling below 152.00 against the dollar. This brings its weekly decline to over 3%, reaching its lowest level since February at 153.00. This was due to weaker-than-expected wage data, which dampened the prospects for a Bank of Japan rate hike. Real wages in Japan fell 1.4% year-on-year in August, marking the eighth consecutive month of decline in inflation that continued to outpace wage growth. Bank of Japan Governor Kazuo Ueda recently indicated that the central bank would resume rate hikes if economic and price trends meet expectations, but he warned of the risks posed by US tariffs. Investors are also weighing the political outlook in Japan, as Sanae Takaichi, a staunch supporter of the expansionary "Abenomics" policy, won the race to become the next prime minister. Her victory boosted expectations for massive fiscal spending and continued monetary easing.
After USD/JPY broke through horizontal resistance at the 151.00 level, a subsequent strong move above 152.00 could be seen as a new trigger point for USD/JPY bulls. However, the daily Relative Strength Index (RSI) is approaching overbought territory, so it would be prudent to await some short-term consolidation or a modest pullback before taking further profits. However, any corrective decline is likely to find some support around Wednesday's Asian session low of 151.75, followed by the 151.00 level. The latter should act as strong support for the spot price, and a break could pave the way for deeper losses. Nevertheless, USD/JPY appears poised to extend its uptrend, targeting the 153.00 level and the next relevant resistance area of 153.25-153.30. Momentum could extend further, breaking through the intermediate resistance level of 153.70, with bulls aiming to conquer the 154.00 level for the first time since February.
Consider shorting the US dollar at 152.86 today. Stop loss: 153.00, target: 151.80, 151.70.
EUR/USD
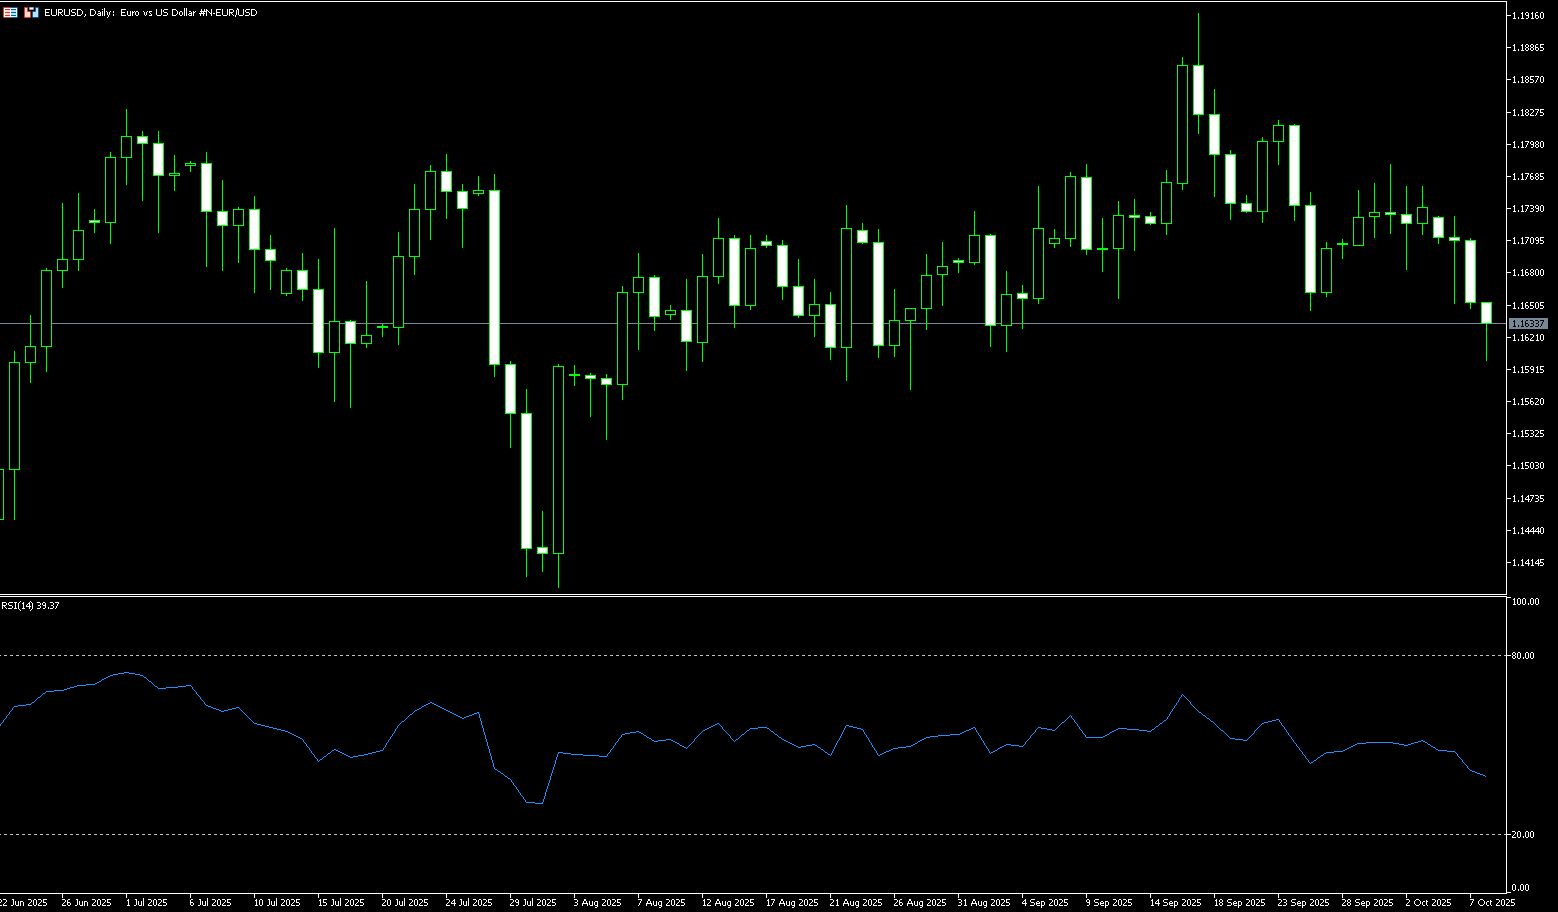
EUR/USD attracted some selling during Wednesday's Asian trading session, approaching the psychological level of 1.1600. The euro weakened against the dollar due to concerns about the political crisis in France. The euro remained under pressure after French Prime Minister Sébastien Le Cornu resigned on Monday. France is now likely to miss the deadline for submitting its 2026 budget bill, meaning lawmakers will need to pass emergency temporary legislation to authorize spending from January 1st until the full budget is approved. Across the pond, the US government shutdown entered its eighth day after US senators failed to pass a spending proposal to reopen the federal government. The ongoing US federal government shutdown could weaken the US dollar and help limit losses in major currency pairs. Investors also now expect the Federal Reserve to cut interest rates by 25 basis points at its October meeting, with another cut expected in December.
EUR/USD fell below the 1.1700 round-figure mark to 1.1598 at the close of early week trading, opening the door to further downside. The 14-day Relative Strength Index (RSI) on the daily chart shows seller dominance, turning bearish. Therefore, EUR/USD's first support level will be 1.1600, a psychological market level. This is followed by the 120-day simple moving average at 1.1565. If broken, the next target will be the 1.1500 round-figure mark. Conversely, EUR/USD's first resistance level will be 1.1700. The next key resistance area will be last week's high at 1.1778, as well as the highs of September 23rd and 24th (near 1.1820).
Consider a long EUR at 1.1615 today, with a stop-loss at 1.1604 and targets at 1.1670 and 1.1680.
Disclaimer: The information contained herein (1) is proprietary to BCR and/or its content providers; (2) may not be copied or distributed; (3) is not warranted to be accurate, complete or timely; and, (4) does not constitute advice or a recommendation by BCR or its content providers in respect of the investment in financial instruments. Neither BCR or its content providers are responsible for any damages or losses arising from any use of this information. Past performance is no guarantee of future results.
Lebih Liputan


Pendedahan Risiko:Instrumen derivatif diniagakan di luar bursa dengan margin, yang bermakna ia membawa tahap risiko yang tinggi dan terdapat kemungkinan anda boleh kehilangan seluruh pelaburan anda. Produk-produk ini tidak sesuai untuk semua pelabur. Pastikan anda memahami sepenuhnya risiko dan pertimbangkan dengan teliti keadaan kewangan dan pengalaman dagangan anda sebelum berdagang. Cari nasihat kewangan bebas jika perlu sebelum membuka akaun dengan BCR.

 English
 简体中文
简体中文
 繁體中文
繁體中文
 Bahasa
Melayu
Bahasa
Melayu
 Tiếng
Việt
Tiếng
Việt
 ไทย
ไทย
 日本語
日本語
 한국어
한국어
 ភាសាខ្មែរ
 español