


0
Currency & Commodity Analysis:
US Dollar Index
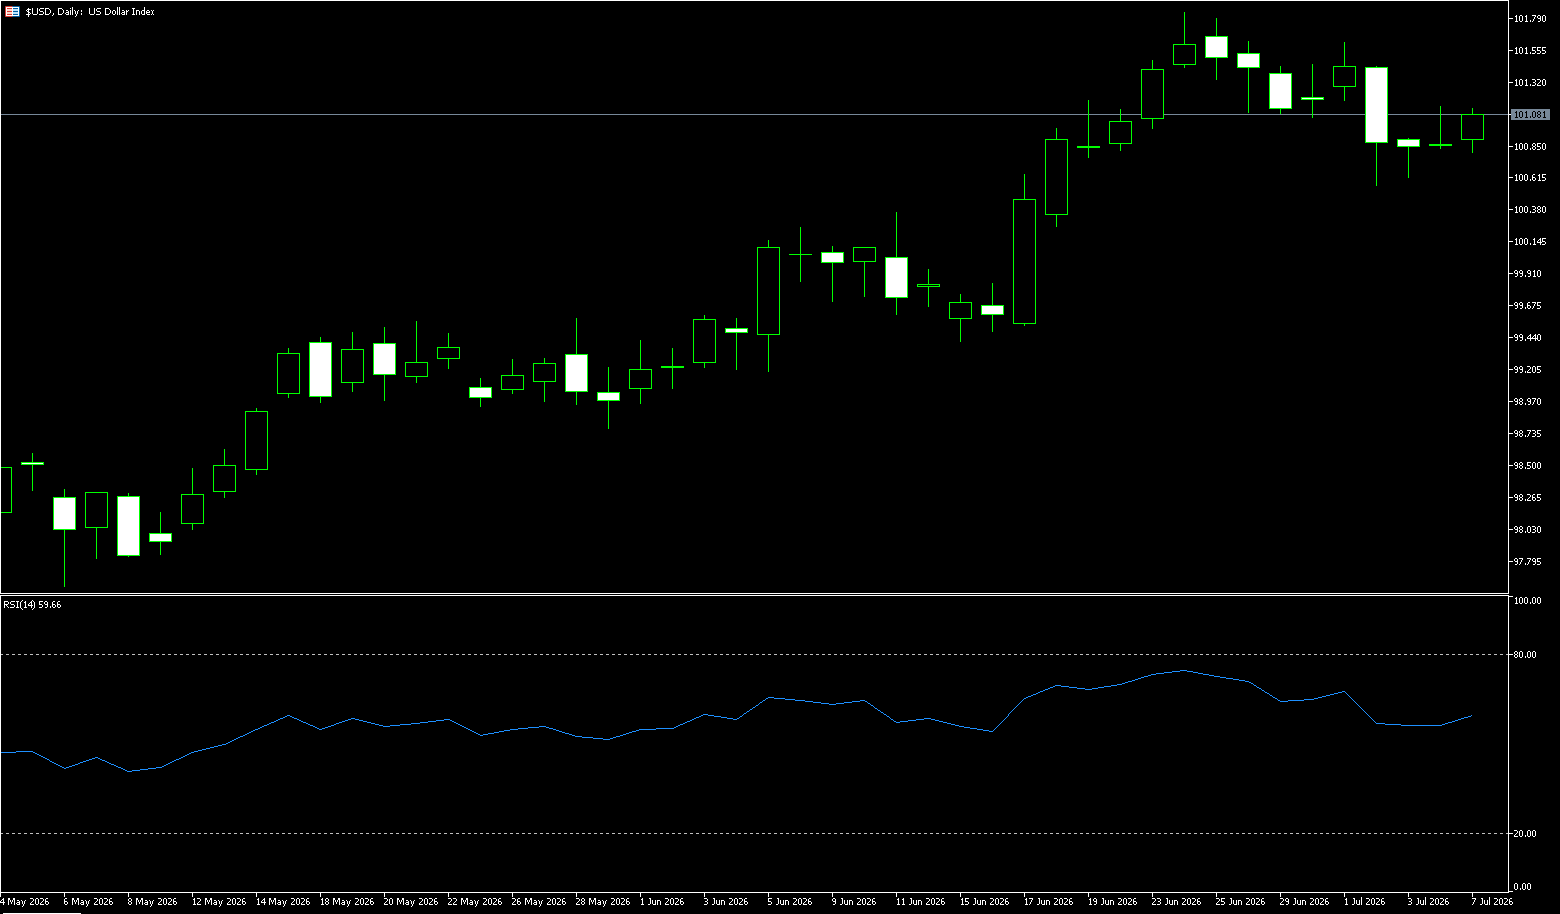
The US dollar index rose slightly on Tuesday, approaching 101.10, after falling slightly in the previous two trading days, reacting only mildly to the renewed rise in oil prices. Oil prices rose due to reports of attacks on ships near the Strait of Hormuz, highlighting the fragile security situation in the Middle East and potential risks to global energy supplies. The rise in oil prices has reignited inflation concerns and prompted traders to moderately increase their bets on further rate hikes by the Federal Reserve this year. The market-implied probability of a rate hike as early as September has risen to about 58%, up from 56% the previous day. Investors are now awaiting the release of the FOMC meeting minutes on Wednesday for further clues about the Fed's policy outlook, after the Fed adopted a more hawkish stance at its June meeting. The US dollar rose slightly against most major currencies, but remained slightly weaker against the Japanese yen.
The US dollar index continued its volatile trading session in Asian trading on Tuesday, lacking a clear direction for the third consecutive trading day, currently hovering around the 101.00 level. The market is digesting multiple factors, including geopolitical risks, energy price changes, and adjustments to the Federal Reserve's future policy path, resulting in a short-term tug-of-war between bulls and bears for the dollar. From a daily chart perspective, the US dollar index has recently maintained a consolidation trend, rebounding after finding support in the 97.45-97.40 area, but the current price has not yet broken through the key resistance zone. In the short term, the 101.00 level is a key resistance. A decisive break above this level could see the US dollar index test 101.59 (last week's high); a break below that level would target 101.80 (June 24 high) and resistance around 102.00. If the rebound fails and the index weakens again, attention should be paid to 100.56 (recent low) and 100.55 (25-day simple moving average), which would open up downside potential to the 100.00 psychological level.
Today, consider shorting the US dollar index at 101.25, with a stop-loss at 101.35 and targets at 100.70 and 100.75.
WTI Crude Oil
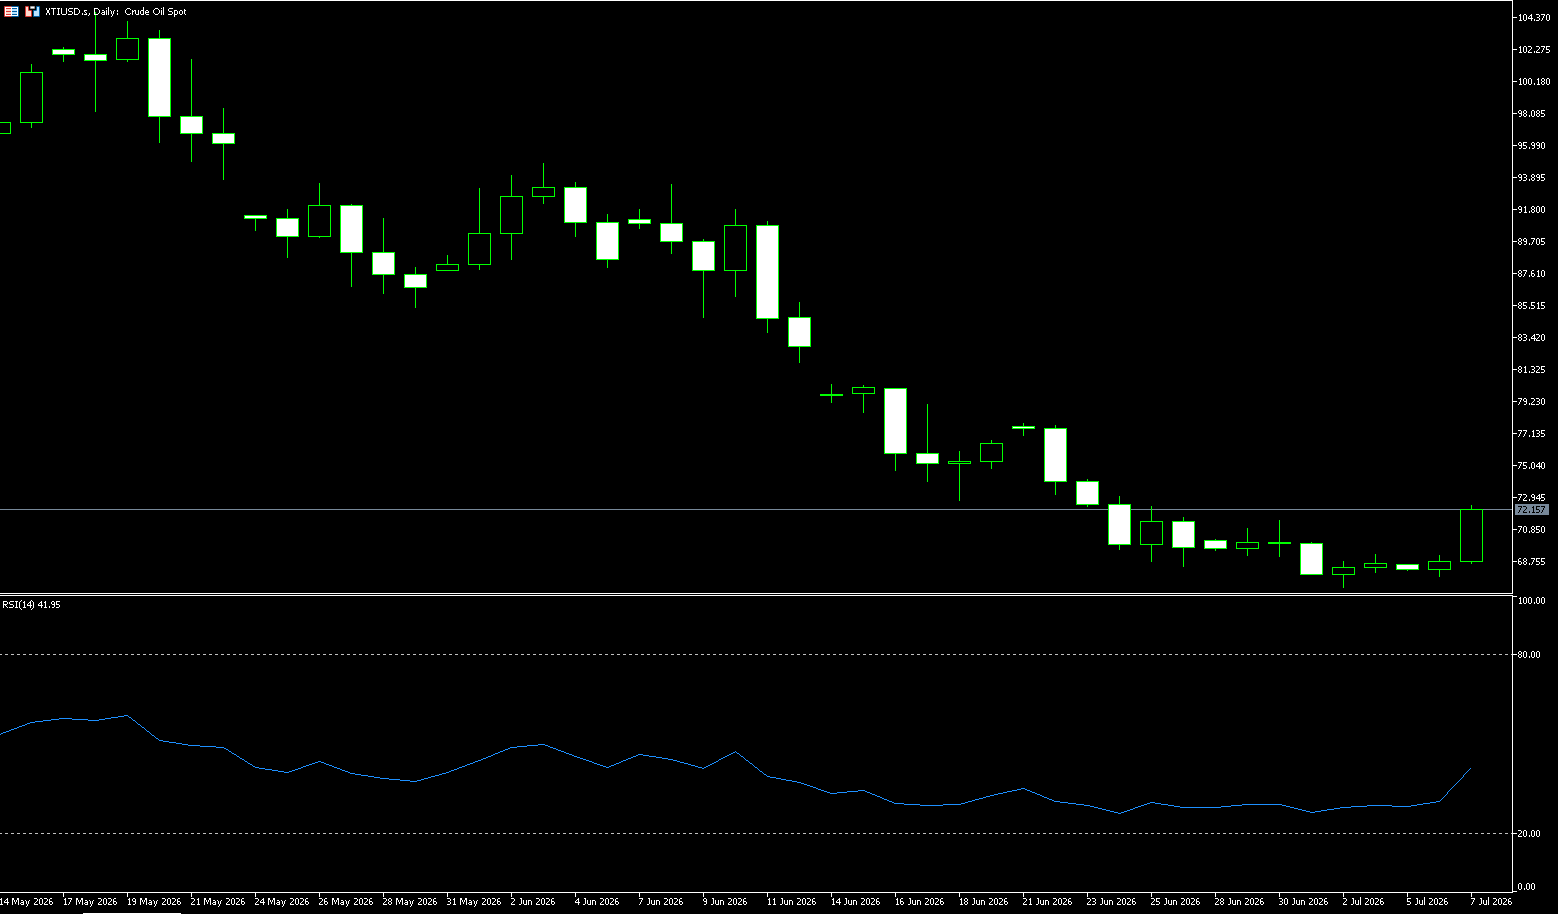
Crude oil extended its gains on Tuesday, rising about 5% to around $72 a barrel, as geopolitical tensions in the Middle East escalated. A U.S. official told CNBC that the Treasury Department is revoking waivers allowing Iran to sell its oil due to the recent tanker attacks in the Strait of Hormuz. According to the Qatari Foreign Ministry, Iran attacked the Qatari liquefied natural gas tanker Al-Rekayyat, and another tanker passing through the strait was reportedly hit by an unidentified flying object. The Iranian Foreign Minister stated that as long as security threats exist, final peace talks will not proceed. President Trump warned that either the two countries would reach an agreement or the US would "finish its job," reigniting the possibility of military action. Meanwhile, Saudi Aramco lowered its official selling price for Arab Light crude oil to Asian buyers by $1.10 per barrel next month, widening the discount to $1.50 below the regional benchmark, as market conditions tended to.
From the daily chart, WTI crude oil has fallen from its May high of around $103.50 to around $70, with a low of $67.08. Oil prices are trading close to the 9-day simple moving average of $69.43, indicating that the previous downtrend has not been fully corrected, but the short-term downward momentum has shown signs of weakening. Regarding the MACD, the DIFF is around -5.88, the DEA is around -6.15, and the histogram has turned to +0.55, indicating a weak correction rather than a trend reversal. Two phenomena should be noted when interpreting the market: First, the price is consolidating sideways above $70, indicating some turnover in this area; second, the Bollinger Middle Band is still clearly exerting downward pressure, indicating that the medium-term moving average pressure has not yet been relieved. Therefore, the current technical chart looks more like a "low-level digestion after a sharp drop" rather than a completed directional shift. Upward resistance is at $73.04 (June 24 high), a break above which would target $75 (psychological level). On the downside, watch $70.96 (14-day moving average) and $70.00 (psychological level).
Today, consider going long on crude oil at $71.85, with a stop loss at $71.65 and targets of $73.80 and $74.50.
Spot Gold
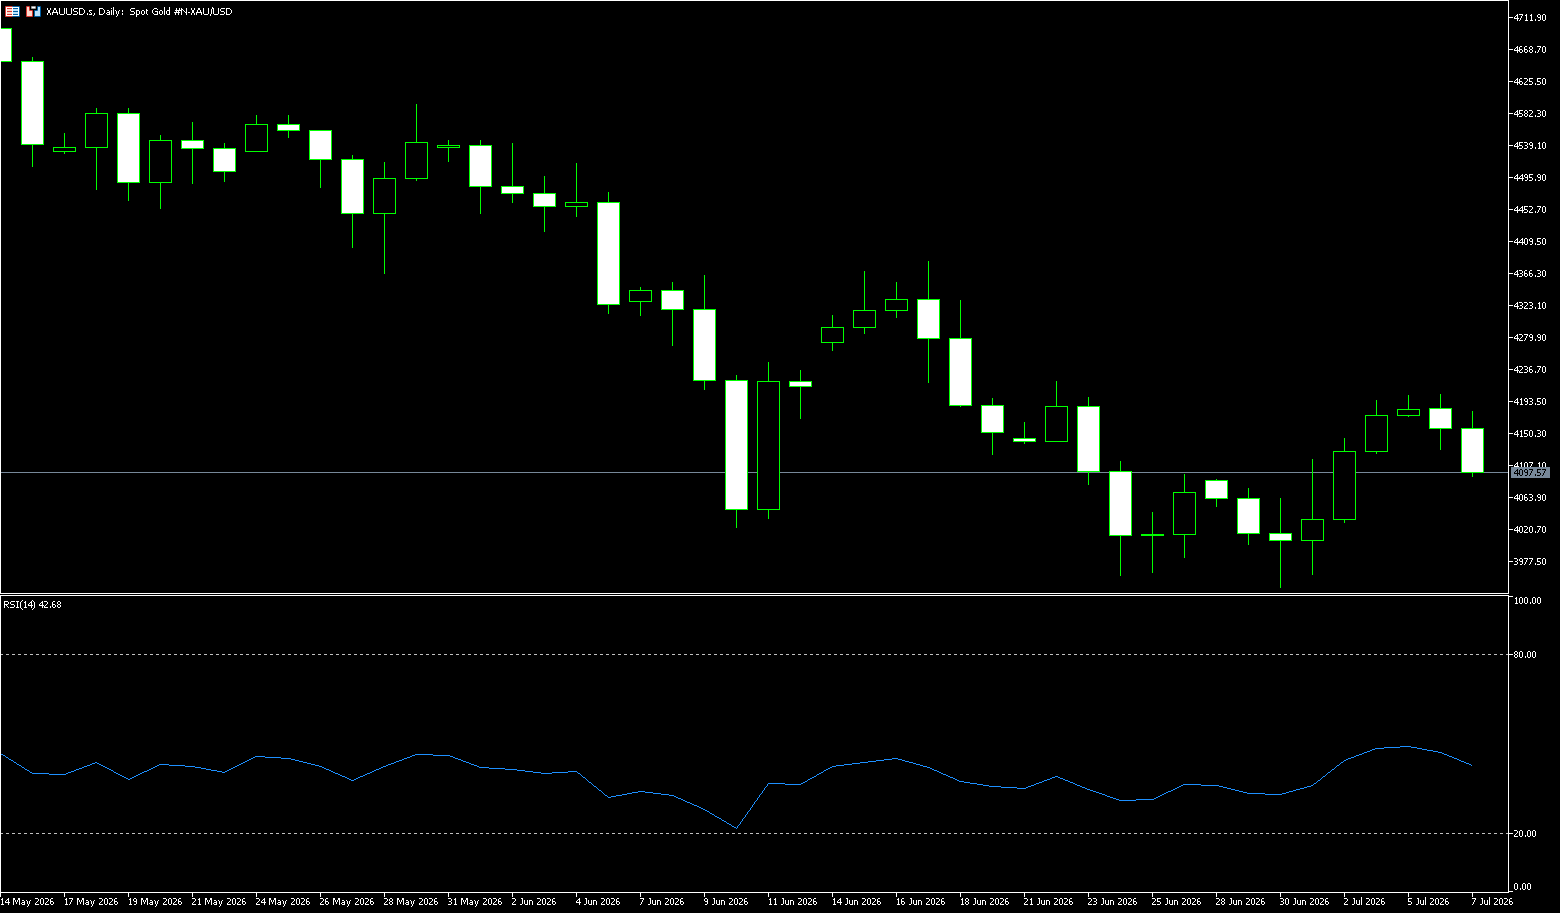
Gold fell below $4,120 an ounce on Tuesday but still maintained most of last week's gains as investors awaited the minutes of the Federal Reserve's June meeting for new clues about the interest rate outlook. Last week's data showed a sharp slowdown in U.S. job growth in June, while payrolls for the previous two months were revised downwards, leading the market to lower its expectations for a near-term interest rate hike. Traders now estimate a roughly 50% chance of a Fed rate hike in September, down from about two-thirds before the latest jobs report. The precious metal was also supported by lower oil prices as traffic in the Strait of Hormuz continued to recover following the implementation of the interim peace agreement between the U.S. and Iran. Meanwhile, Middle Eastern producers increased output and lowered prices in response to changing market conditions, and OPEC+ agreed to increase production quotas next month.
Gold prices continue to show a short-term bearish bias below the 34-day simple moving average of $4,272 and within a descending channel. However, the Moving Average Convergence Divergence (MACD) indicator has turned positive, with the MACD line above the signal line and the positive histogram expanding. This indicates that bullish momentum is recovering, but not yet strong enough to challenge the major upper structure. Furthermore, the 14-day Relative Strength Index (RSI) is 43.78, still below the 50 line, suggesting that despite the recent rebound, the overall tone remains neutral to slightly bearish. Meanwhile, $4,100 may act as a temporary support level, with more significant support at $4.032 near the July 2nd low, where stronger buying demand is expected if prices decline further. Immediate resistance is at Tuesday's high of $4,168.50, where any initial rebound is likely to be capped. Next is the $4,200 psychological level.
Consider going long on gold today at $4,094, with a stop-loss at $4,090 and targets at $4,150 and $4,160.
AUD/USD
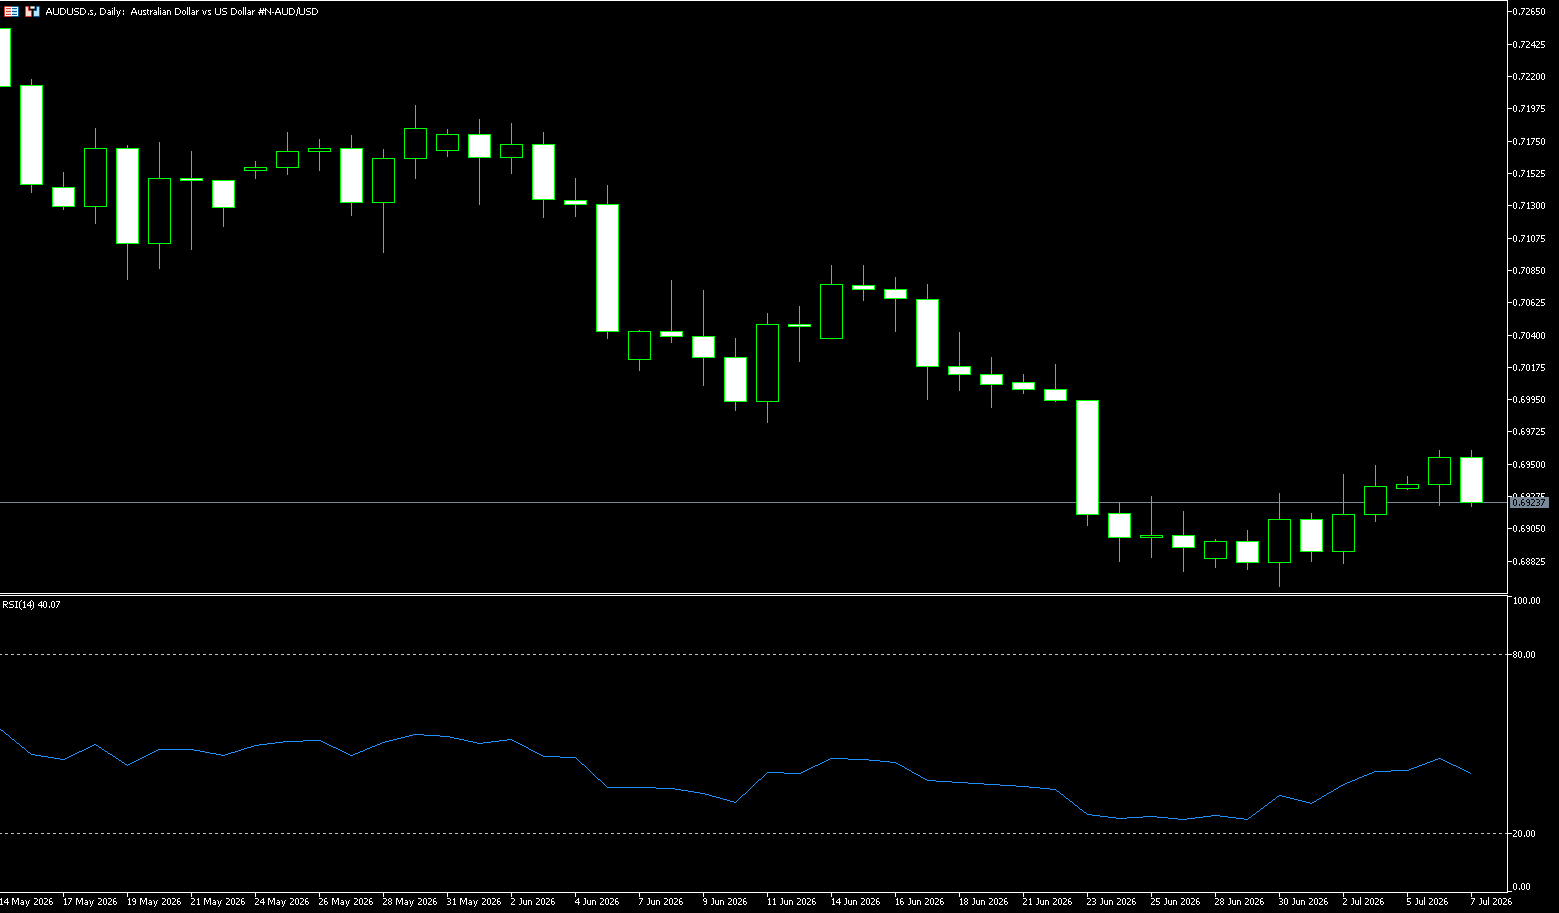
The Australian dollar maintained its recent gains near US$0.6930, close to a two-week high, as a weaker dollar combined with market expectations of further interest rate hikes by the Reserve Bank of Australia. Markets continued to assess the Reserve Bank of Australia's June meeting minutes, which highlighted policymakers' strong concerns about persistent inflation, excess demand, and capacity constraints. Major banks, including the Commonwealth Bank of Australia, stated that the minutes underscored persistent inflationary pressures, while ANZ warned that this increased the risk of further rate hikes in the coming months. Meanwhile, the US dollar was pressured by falling energy prices and a weaker-than-expected US jobs report, prompting markets to lower their expectations for a near-term Federal Reserve rate hike. Futures market pricing showed a 78% probability of rates remaining unchanged at the July 29 meeting. Furthermore, while there was no progress in US-Iran peace talks, shipping in the Strait of Hormuz continued to resume.
On the daily chart, the Australian dollar is trading at 0.6930 against the US dollar, continuing to lie below its 55-day and 100-day simple moving averages at 0.7092 and 0.7070 respectively. While the pair remains above its 200-day simple moving average at 0.6871, this keeps the short-term bias bearish. The 14-day Relative Strength Index (RSI) is around 42, indicating relatively weak downward momentum, while the robust Average Directional Index (ADX) is near 39, suggesting that the existing downtrend remains intact rather than just a range-bound correction. On the upside, initial resistance is located near the psychological level of 0.7000, followed by horizontal resistance at the 100-day simple moving average of 0.7070 and the 55-day and 100-day simple moving averages at 0.7092. Immediate support is seen around the psychological level of 0.6900, followed by horizontal support at the 200-day simple moving average of 0.6871.
Consider going long on the Australian dollar at 0.6910 today, with a stop loss at 0.6900 and targets at 0.6960 and 0.6970.
GBP/USD
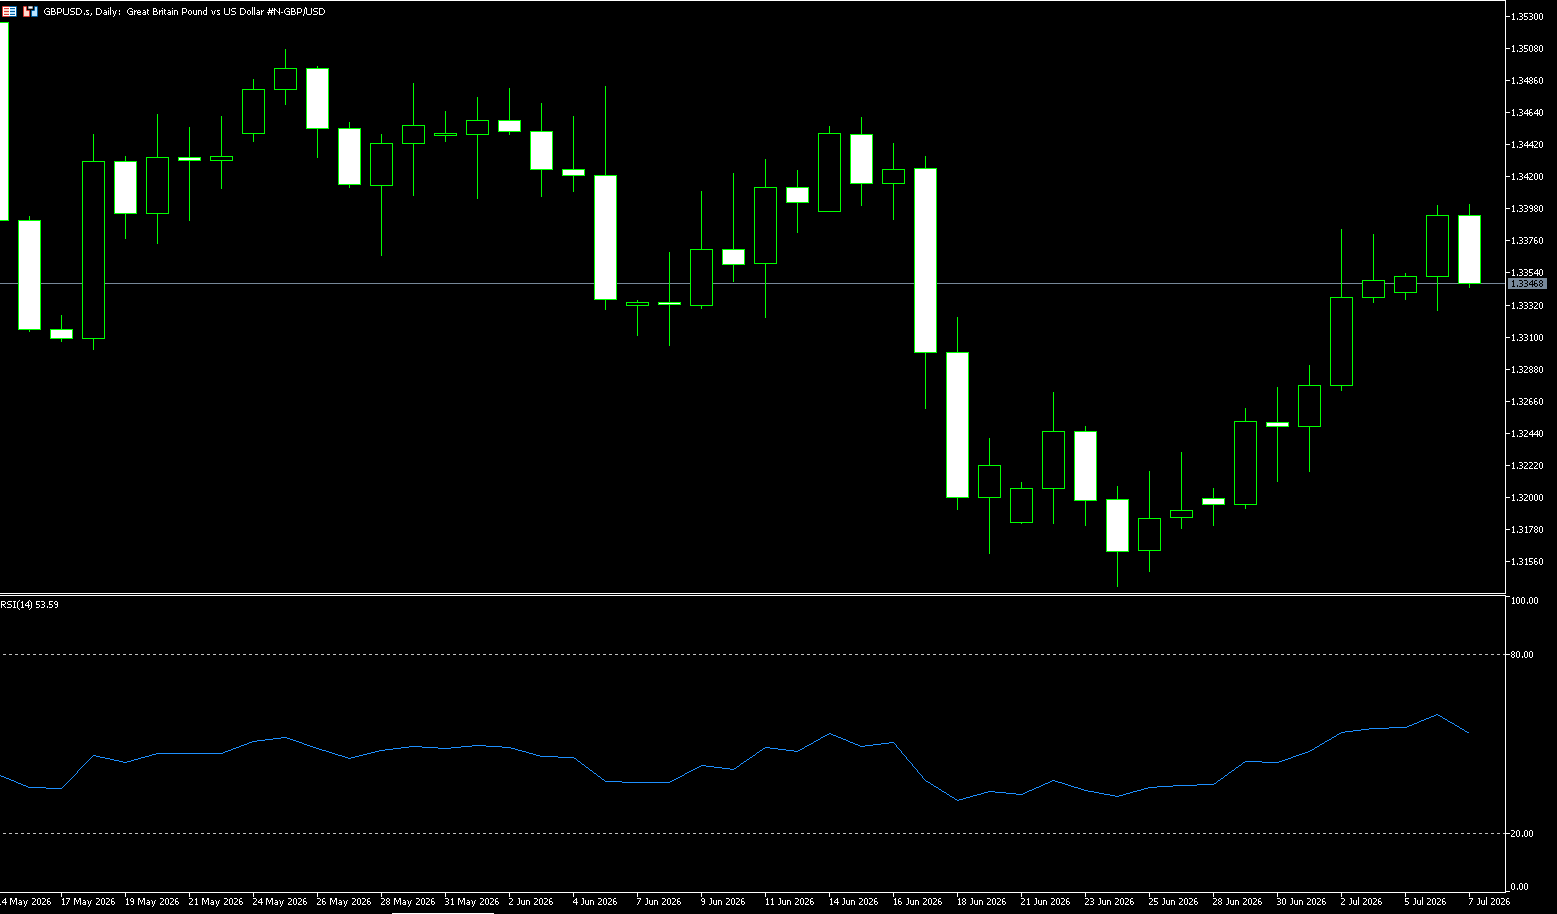
The pound fell slightly against the dollar to near 1.3348 during Tuesday's European trading session. The pound/dollar pair declined slightly as the dollar strengthened slightly; however, overall, the pound performed positively. The dollar index, which tracks the dollar's value against six major currencies, rose 0.1% to near 100.90. The dollar is expected to trade cautiously as investors await the release of the minutes from the June Federal Open Market Committee (FOMC) meeting on Wednesday. Investors will closely watch the FOMC minutes for new clues about the outlook for the Fed's monetary policy. In the UK, despite leadership changes, the market's belief in the continuation of fiscal principles supported the pound. Newly elected MP and Mayor of Greater Manchester, Andy Burnham, emerged as the leading candidate for UK leadership after Prime Minister Keir Starmer's resignation.
On the daily chart, GBP/USD is trading around 1.3350. Two weeks ago, the pair showed a strong rebound after attracting significant buying interest near 1.3140. The pair maintains a constructive short-term trend as it remains above the 25-day simple moving average at 1.3317. Momentum is slightly positive, with the Relative Strength Index (RSI) (14) at 55.7, suggesting that buyers remain in control and the market is not overstretched. The next key resistance level up is the 300-day simple moving average 1, around 1.3430, limiting a broader rally to the psychological level of 1.3500. Initial support downside is seen at the 20-day simple moving average at 1.3301 and 1.3300 {a psychological level}, followed by 1.3140 near the June lows.
Today, consider going long on GBP at 1.3335, with a stop-loss at 1.3325 and targets at 1.3380 and 1.3390.
USD/JPY
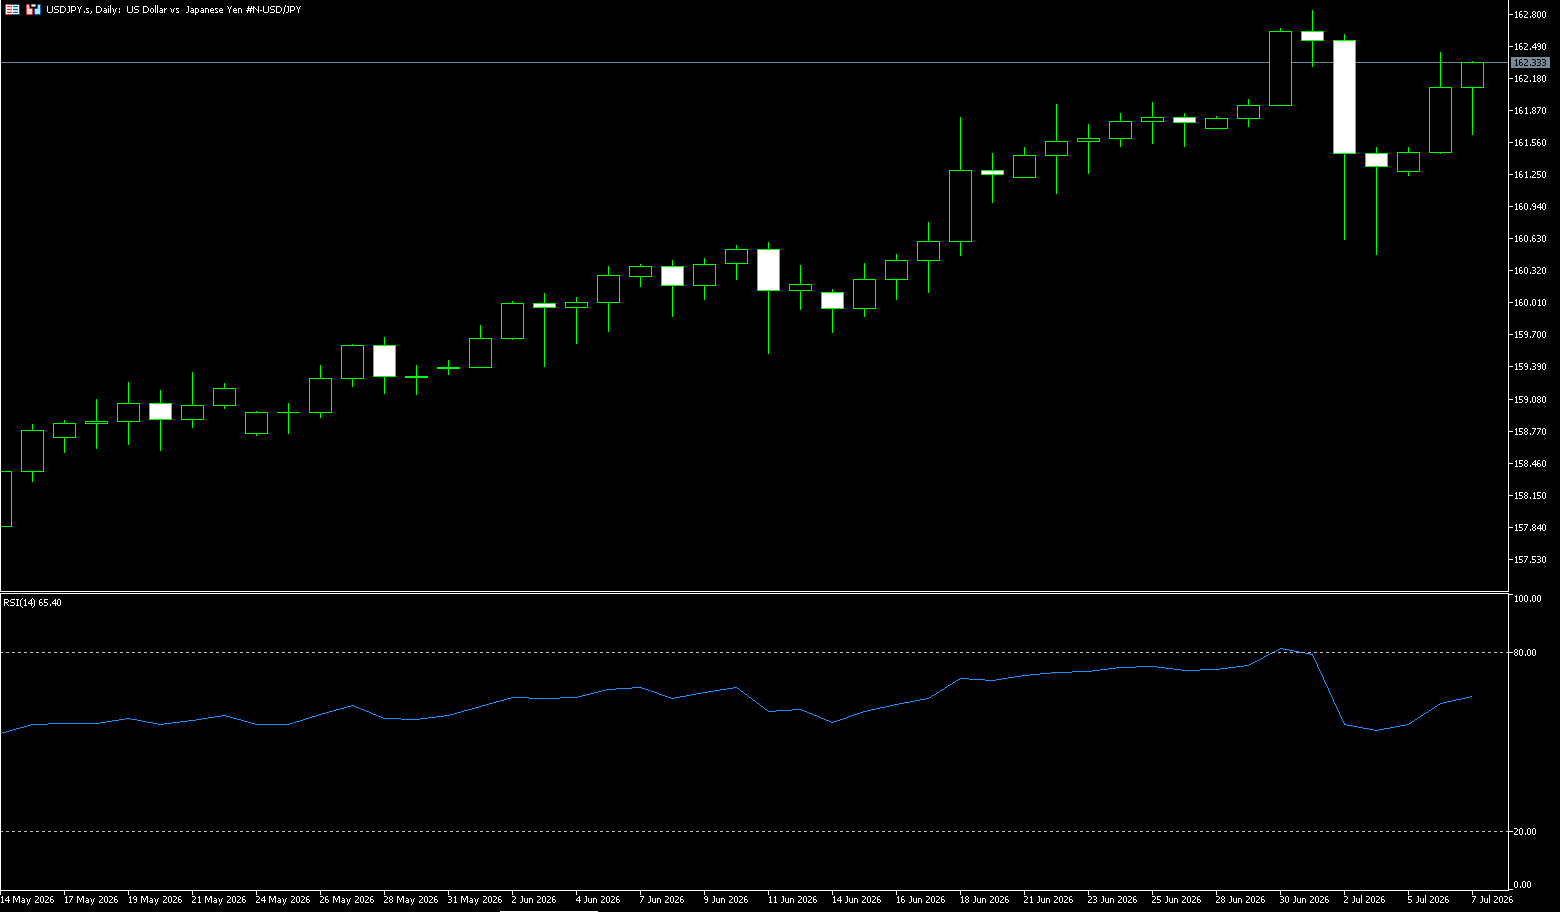
USD/JPY traded near 162.10 per dollar on Tuesday, hovering close to its highest level in four decades, as investors continued to short the currency in the absence of intervention from Japanese authorities. Nevertheless, the market remains wary of any possible measures by Tokyo to support the yen, although many traders doubt that intervention alone can provide lasting relief. Finance Minister Satsushige Katayama reiterated that officials are ready to intervene in the foreign exchange market if necessary, adding that Japan maintains close communication with the US on monetary policy. The yen remains under pressure due to concerns about Japan's fiscal expansion and expectations that the Bank of Japan is still lagging behind in normalizing monetary policy. Meanwhile, investor assessment data showed that nominal wages rose 3.2% in May, while household spending fell 0.4%.
The long-term interest rate differential between the US and Japan supports carry trades that continue to short the yen. The shipping crisis in the Strait of Hormuz exacerbates Japan's energy import pressures, while instability in the US-Iran situation increases the safe-haven value of the US dollar. Weak domestic wage and consumption data in Japan limit the Bank of Japan's room for tightening policy, with only rising expectations of a Fed rate cut slightly suppressing the dollar's bullish momentum. The market is currently awaiting the Fed's meeting minutes on Wednesday. Short-term pullbacks are seen merely as opportunities for long positions, and the medium- to long-term depreciation trend of the yen is unlikely to reverse quickly. From a daily chart perspective, the USD/JPY pair had previously risen continuously and traded in a high-level area; the current pullback is a technical adjustment within the uptrend. The exchange rate is currently still above the 160 level, and the overall trend has not been significantly broken. In the short term, the area around 161.00 is a key support zone. If the price can hold this level, the bulls may launch a renewed counterattack. Resistance levels to watch are 161.84 (the high of July 1st) and the psychological support level around 162.00. A further break above this level could lead to a retest of the 163.00 area. If it breaks below 161.50, the market may further retrace to around 160.50 to find support. Current daily momentum has weakened, but the overall structure still leans towards a slightly bullish consolidation.
Consider shorting the US dollar today at 162.30, with a stop-loss at 162.46 and targets at 161.50 and 161.40.
EUR/USD
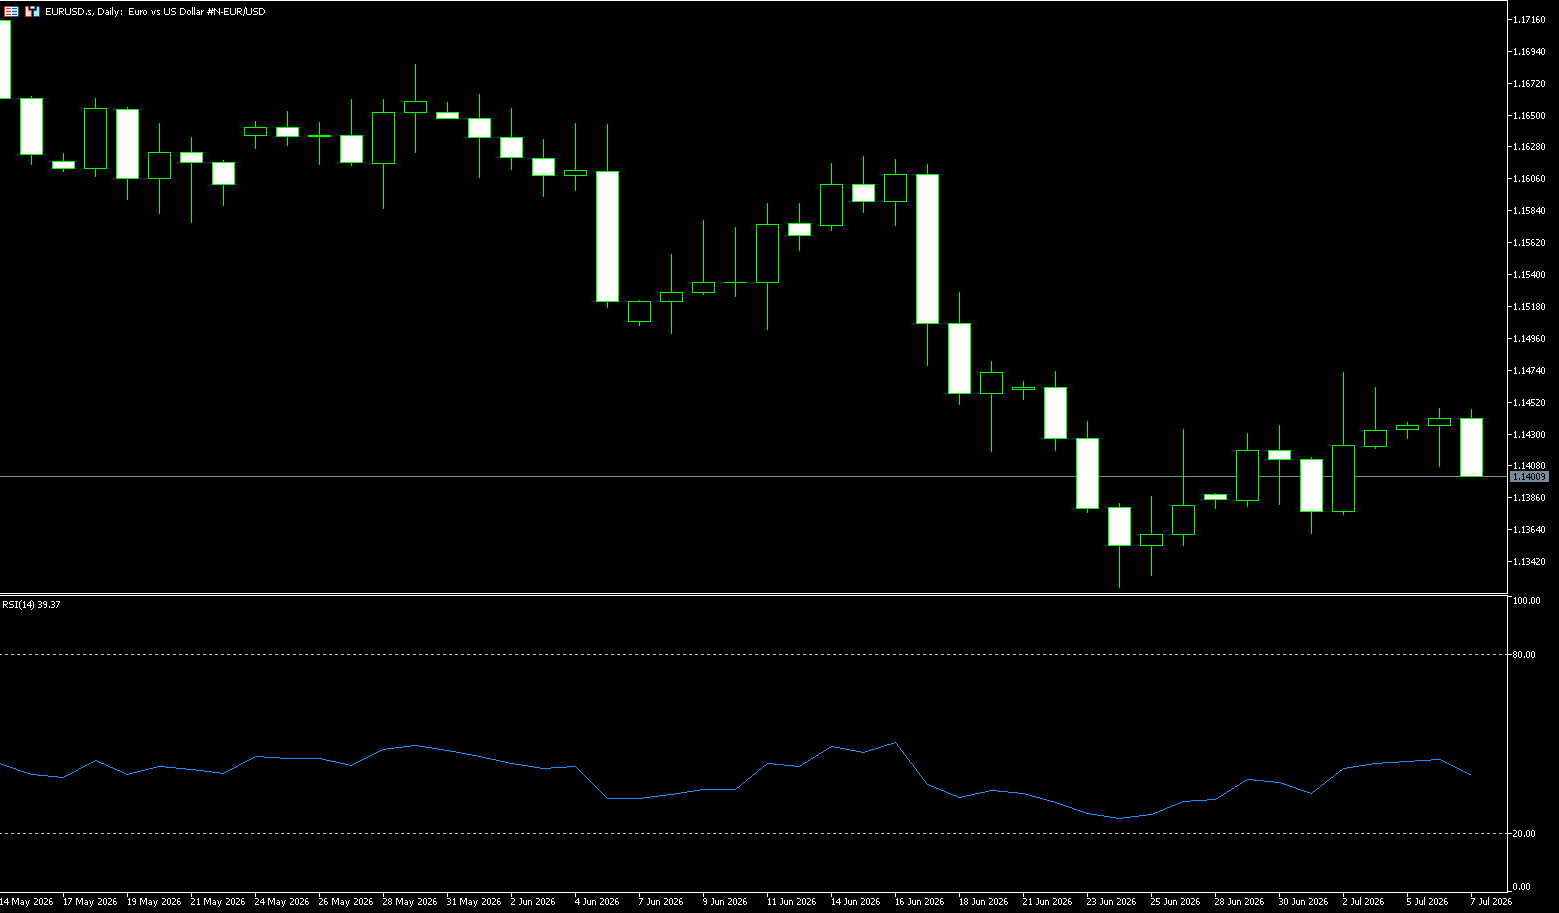
The euro remained stable around $1.1400 as investors processed the latest economic data while awaiting new catalysts. Eurozone retail sales rose 0.2% in May, slightly below the expected 0.3% increase, while producer price inflation rose to 5.9% year-on-year, exceeding expectations. German factory orders rebounded 1.9%, exceeding the 1.2% forecast, but the S&P Global Construction Purchasing Managers Index showed a wider contraction in construction activity in the region in June. Last week, the euro rose 0.5% against the dollar due to weaker-than-expected US non-farm payroll data. However, gains were limited by slowing inflation and dovish comments from ECB President Christine Lagarde, who noted a more balanced outlook for inflation and growth in the Eurozone. Markets now anticipate another 25 basis point rate hike by the ECB this year, though uncertainty remains, given the previous rate increase in June. In Germany, the cabinet approved the draft 2027 budget, with spending at €555.4 billion and borrowing at €203.6 billion, up from earlier estimates.
From a technical perspective, the EUR/USD exchange rate has struggled to find support above 1.3161 (the July 1 low) and was rejected near resistance at 1.1472 last Thursday. Against the backdrop of recent declines, this upward-sloping channel forms a bearish flag pattern. This keeps the 25-day simple moving average on the 4-hour chart below 1.1480 as resistance, further reinforcing the supply zone above. Meanwhile, momentum indicators show a slightly constructive backdrop. In fact, the 14-day Relative Strength Index (RSI) is hovering below 45, while the MACD histogram is slightly positive. However, the next relevant resistance level is locked at the psychological level of 1.1500. On the downside, the first significant support appears at the July 2nd low of 1.1372, and if bearish pressure persists, the psychological level of 1.1300 will become the secondary support level.
Consider going long on the Euro today at 1.1392, with a stop loss at 1.1380 and targets at 1.1440 and 1.1450.
Stock Analysis:
Australian ASX 200 Stock Index
Basic Market Overview:
The Australian Securities Exchange (ASX) 200 index fell 13 points, or 0.2%, to close at 8,831 on Monday, retreating from a one-week high and pulling back from the previous session's rebound. Market sentiment weakened as Australian job advertisements slowed for the third consecutive month in June, highlighting the drag from higher borrowing costs. Caution also prevailed ahead of China's June consumer price index and producer price index data to be released later this week. Nevertheless, strong US stock index futures helped limit losses ahead of the release of the Fed's June meeting minutes.
Meanwhile, a modest inflation gauge released by the Melbourne Institute further indicated easing cost pressures. Industrial services, consumer goods, and non-energy mining led the decline. Shares of the four major banks fell between 0.1% and 1.1%. Supermarket giants Woolworths (-1.1%) and Coles (-0.4%) underperformed, with the sector down 1.6% so far in July, after rising 13% in June. In contrast, Vault Minerals rose 11.6% after Genesis Minerals made a A$5.6 billion takeover offer, surpassing Regis Resources' proposal in May.
Sector Performance:
Top Performing Sectors Today (Only Slight Gains, Overall Weakness)
1. Information Technology (IT): The only sector to show significant strength, closing slightly higher for the day. Driven by overnight gains in overseas US software stocks, international SaaS stocks performed even better: WiseTech Global and Xero rose slightly; hardware distribution stocks weakened, offsetting the gains.
2. Health Care: Slightly flat/slightly higher, with a small inflow of defensive funds seeking safe haven. Large-cap blue-chip CSL saw limited volatility, while medical device stocks showed divergence.
3. Utilities: Slightly higher, with high-dividend defensive attributes attracting a small amount of safe-haven funds, resulting in minimal volatility.
Today's Leading Declining Sectors (Top Losers)
1. Consumer Discretionary (Consumer Discretionary) [Weakest in the Market] Closing down nearly 2%. Interest rate hike expectations dampened consumer spending, leading to weakness across gaming, retail, and food service sectors: Aristocrat Leisure and Wesfarmers fell over 2%, while Domino's Pizza plummeted over 3%.
2. Energy Overnight weakness in crude oil dragged down oil and gas stocks, with Woodside, Santos, and Origin Energy all declining. The oil and gas exploration and refining sectors saw a collective pullback.
3. Financials (Financials / Big Four Banks) Down 0.8%–1.2%. The market priced in an August interest rate hike, raising expectations of bank loan defaults. Concerns about loan loss provisions weighed on bank valuations, causing all four major banks to decline.
Technical Analysis:
The ASX200 index surged 120 points on Friday (July 3rd), closing at 8,844, a gain of 1.4%. Gold mining, resources, and banking sectors led the gains. Stronger stock index futures before the US stock market closed boosted risk appetite, and the index rose above short-term moving averages. Monday saw the index consolidating within a rebound range, with the battle between bulls and bears concentrated in the core 8800-8900 range. Since May, the index has been trapped in a wide range of 8680-8950, failing to establish a clear trend. Monday continued this range-bound trading pattern, with the strategy before a breakout primarily focused on buying low and selling high. Currently, the index has stabilized above the 20-day EMA (8820), but is facing resistance at the 50-day moving average of 8910. Short-term moving averages are turning upwards, while medium-term moving averages remain flat, indicating a bottoming-out rebound within a consolidation range, not yet a strong bullish trend. The RSI (14) is in the 57 range, not yet overbought, and still has slight upside potential, but is approaching the 60 resistance level. The MACD: the daily golden cross continues, the red bars are expanding moderately, the rebound momentum is moderate, and there are no explosive bullish signals. The index has been trapped in a wide range of 8680-8950 since May, without forming a clear trend. Monday will continue the range-bound trading pattern; before a breakout, the strategy should be to buy low and sell high.
Trading Strategy:
The following is for technical trading purposes only and does not constitute investment advice. Leveraged trading may result in losses exceeding the principal.
Buy on Dips (Main Strategy: Prioritize long positions if support levels hold)
Applicable Scenarios: Opening price retraces to the 8800-8820 support zone and stabilizes; 1-hour candlestick closes positive; price does not decisively break below 8800.
1. Entry Range: 8805-8825
2. First Intraday Profit Take: 8890-8900 (Reduce position size by 60% if encountering resistance)
3. Swing Trading Profit Take (3-day Holding): 8950-8980
4. Hard Stop-Loss: Decrease below 8790 (Exit if closing price/1-hour closing price breaks below, loss control ≤40 points)
5. Risk Control Rules: Single position size should not exceed 5% of total capital; do not add to long positions if the price does not break above 8900.
Shorting on Resistance (Secondary Strategy: Sell at Resistance Levels)
Applicable Scenarios: Encountering resistance at 8890-8910, long upper shadow candlestick, and shrinking volume.
1. Entry Range: 8890-8910
2. First Intraday Profit Take: 8830-8840
3. Swing Profit Take: 8760-8780
4. Hard Stop-Loss: Exit if the price closes above 8930; loss ≤ 30 points.
5. Risk Management Rules: Shorting on resistance is a counter-trend trade; position size is only 1/2 of a long position; no overnight holdings.
Key Risk Warnings:
Macroeconomic Policy Risks
The Reserve Bank of Australia (RBA) maintained a high interest rate of 4.35%, and the market still expects a 25bp rate hike this year. If inflation data this week is strong, it will directly suppress the banking, real estate, and consumer sectors, causing the index to quickly fall below 8700, ending the rebound.
Technical Structural Risks
The index has been trading within a long-term range without a clear trend, making it highly susceptible to false breakouts/false breakdowns: If it briefly pierces 8910 on Monday but lacks sufficient volume, it will likely plunge quickly; if it briefly breaks below 8800 without significant volume following short positions, it will likely recover quickly, and chasing orders can easily lead to losses.
Funding and Liquidity Risks
The Australian market has lower average daily trading volume than the US stock market, making key price levels prone to slippage; frequent short-term trading will amplify transaction costs, and frequent switching between long and short positions in a volatile market can easily result in consecutive small losses.
Hong Kong Hang Seng Index
Basic Market Overview:
The Hang Seng Index fell 0.4%, or 99 points, to 23,518 on Tuesday, reversing earlier gains, as property stocks led the decline, and investors became cautious ahead of key economic events in the US and China. The World Bank predicts that China's economic growth will slow to 4.4% in 2026 and 4.3% in 2027, due to a prolonged property slump and weak consumer demand, weakening market sentiment. Investors are awaiting the latest policy meeting from the Federal Reserve this week, as well as China's June CPI and PPI data, for clues about the policy outlook. Real estate developers led the decline, with the sector index falling more than 3%, and technology stocks also declined.
Meanwhile, Beijing and Hong Kong announced new measures to expand currency, bond, and gold trading, aiming to strengthen the city's role as a leading offshore renminbi center. Notable decliners included Kuaishou (-9.5%), Kingboard Laminates (-8.9%), Pop Mart (-4.8%), SMIC (-3.2%), and AIA (-2.2%).
Sector Performance:
Leading Gains:
Today's leading sectors (only slightly higher, overall weak):
Information Technology (IT)
The only sector to show significant strength, closing slightly higher for the day. Driven by overnight gains in overseas US software stocks, international SaaS stocks performed even better: WiseTech Global and Xero rose slightly; hardware distribution stocks weakened, offsetting the gains.
Healthcare
Closed slightly flat/up a little. Defensive funds flowed in slightly for safety. Large-cap blue-chip CSL saw limited volatility, while medical equipment stocks showed divergence.
Utilities
Closed slightly higher. High-dividend defensive characteristics attracted a small amount of safe-haven funds, resulting in minimal volatility.
Lagging Sectors:
Top Declining Sectors Today (by Loss):
Consumer Discretionary [Weakest in the Market]
Closed down nearly 2%. Interest rate hike expectations suppressed consumer spending, leading to weakness across gaming, retail, and food service sectors: Aristocrat Leisure and Wesfarmers fell over 2%, and Domino's Pizza plummeted over 3%.
Energy
Overnight weakness in crude oil dragged down oil and gas stocks. Woodside, Santos, and Origin Energy all declined, with the oil and gas exploration and refining sectors experiencing a collective pullback.
Financials (Big Four Banks)
Decline: 0.8%–1.2%. The market priced in an August rate hike, raising expectations of bank loan defaults. Concerns about loan loss provisions weighed on bank valuations, leading to a synchronized decline in all four major banks.
Technical Analysis:
Hang Seng Index closing at 23,496.89, down 0.51% for the day. Intraday range: 23,398.27-23,820.92. The index rose initially before falling back to close with a long upper shadow, forming a bearish candlestick. Turnover: HK$319.711 billion. The rebound encountered resistance and entered a consolidation phase. After a three-day winning streak, today's long upper shadow indicates concentrated selling pressure above 23,800, suggesting a significant weakening of bullish momentum. The short-term rebound is a correction after the decline and has not reversed the medium-term weak and volatile trend. Technical indicators: MACD: The daily chart maintains a golden cross, but the red bars are continuously shortening, indicating weakening bullish momentum and a risk of a death cross and pullback; RSI: It rose to around 60 and then turned downwards. It has not entered overbought territory, but its upward momentum is weak, indicating a neutral to bearish bias; The Hang Seng Index has risen above the 10/20-day moving average in the short term, but the 5-day moving average has turned downwards, indicating significant short-term pressure. Currently, the index is in a high-level consolidation phase, with strong resistance at 23,780-23,820. Without increased capital inflows and positive external factors, it is highly likely to retrace to the 23,300-23,230 range to correct indicators. Only a strong break above 23,850 with significant volume can open up further upside potential to around 24,000.
Trading Strategy:
Buy on dips (only participate on pullbacks and stabilization; avoid chasing highs)
• Entry Range: 23380-23430. Enter long positions if the price stabilizes and closes positive, or if the intraday chart shows signs of stopping the decline.
• Stop-Loss: 23340 (Exit if the price breaks below intraday support).
• Staggered Profit Taking: First target 23650: Reduce position by 50%; Second target 23770: Exit all positions; If there is a strong breakout above 23850 with significant volume, hold a small position targeting 23980.
• Applicable Scenarios: Strong support levels after pullbacks, declining US Treasury yields, significant inflows of southbound funds
Short-selling under pressure (short-term speculative trading, primarily light positions)
• Entry Range: Short positions can be initiated on rallies of 23750-23820 followed by stagnation and intraday pullbacks with high volume.
• Stop-loss: 23860 (a break above strong resistance invalidates the bearish logic)
• Profit-taking tiers: First target 23500 for partial profit-taking; second target 23390 for full profit-taking; extreme target 23250
• Applicable Scenarios: Weakness in US tech stocks, rising US Treasury yields, and a collective sell-off in semiconductor/tech heavyweights
Risk Warnings:
US Treasuries and the US Dollar: The 10-year US Treasury yield remains above 4.4%, the expectation of a Fed rate cut continues to be delayed, the strengthening US dollar continues to divert global funds, offshore Hong Kong stock valuations are under pressure, and long-duration growth stocks in the Hang Seng Tech sector are more likely to experience significant declines;
External US Stock Market Volatility: US stocks The pullback in AI and technology sectors will directly drag down the weighting of Chinese concept stocks and Hong Kong-listed tech stocks. The Nasdaq's overnight weakness led to a generally lower opening for Hong Kong stocks the following day.
Carry trade repatriation: The yen's interest rate hike has led to the withdrawal of international carry trade funds from emerging markets, resulting in a continued slight outflow of foreign capital from Hong Kong stocks.
Disclaimer: The information contained herein (1) is proprietary to BCR and/or its content providers; (2) may not be copied or distributed; (3) is not warranted to be accurate, complete or timely; and, (4) does not constitute advice or a recommendation by BCR or its content providers in respect of the investment in financial instruments. Neither BCR or its content providers are responsible for any damages or losses arising from any use of this information. Past performance is no guarantee of future results.
More Coverage





Risk Disclosure:Derivatives are traded over-the-counter on margin, which means they carry a high level of risk and there is a possibility you could lose all of your investment. These products are not suitable for all investors. Please ensure you fully understand the risks and carefully consider your financial situation and trading experience before trading. Seek independent financial advice if necessary before opening an account with BCR.
BCR Co Pty Ltd (Company No. 1975046) is a company incorporated under the laws of the British Virgin Islands, with its registered office at Trident Chambers, Wickham’s Cay 1, Road Town, Tortola, British Virgin Islands, and is licensed and regulated by the British Virgin Islands Financial Services Commission under License No. SIBA/L/19/1122.
Open Bridge Limited (Company No. 16701394) is a company incorporated under the Companies Act 2006 and registered in England and Wales, with its registered address at Kemp House, 160 City Road, London, England, EC1V 2NX. Open Bridge Limited acts solely as a payment processor for BCR Co Pty Ltd and does not provide any financial, trading, or investment services on its behalf. Open Bridge Limited's role is limited to payment processing.


 English
 简体中文
简体中文
 繁體中文
繁體中文
 Bahasa
Melayu
Bahasa
Melayu
 Tiếng
Việt
Tiếng
Việt
 ไทย
ไทย
 日本語
日本語
 한국어
한국어
 ភាសាខ្មែរ
 español