


0
Currency & Commodity Analysis:
US Dollar Index
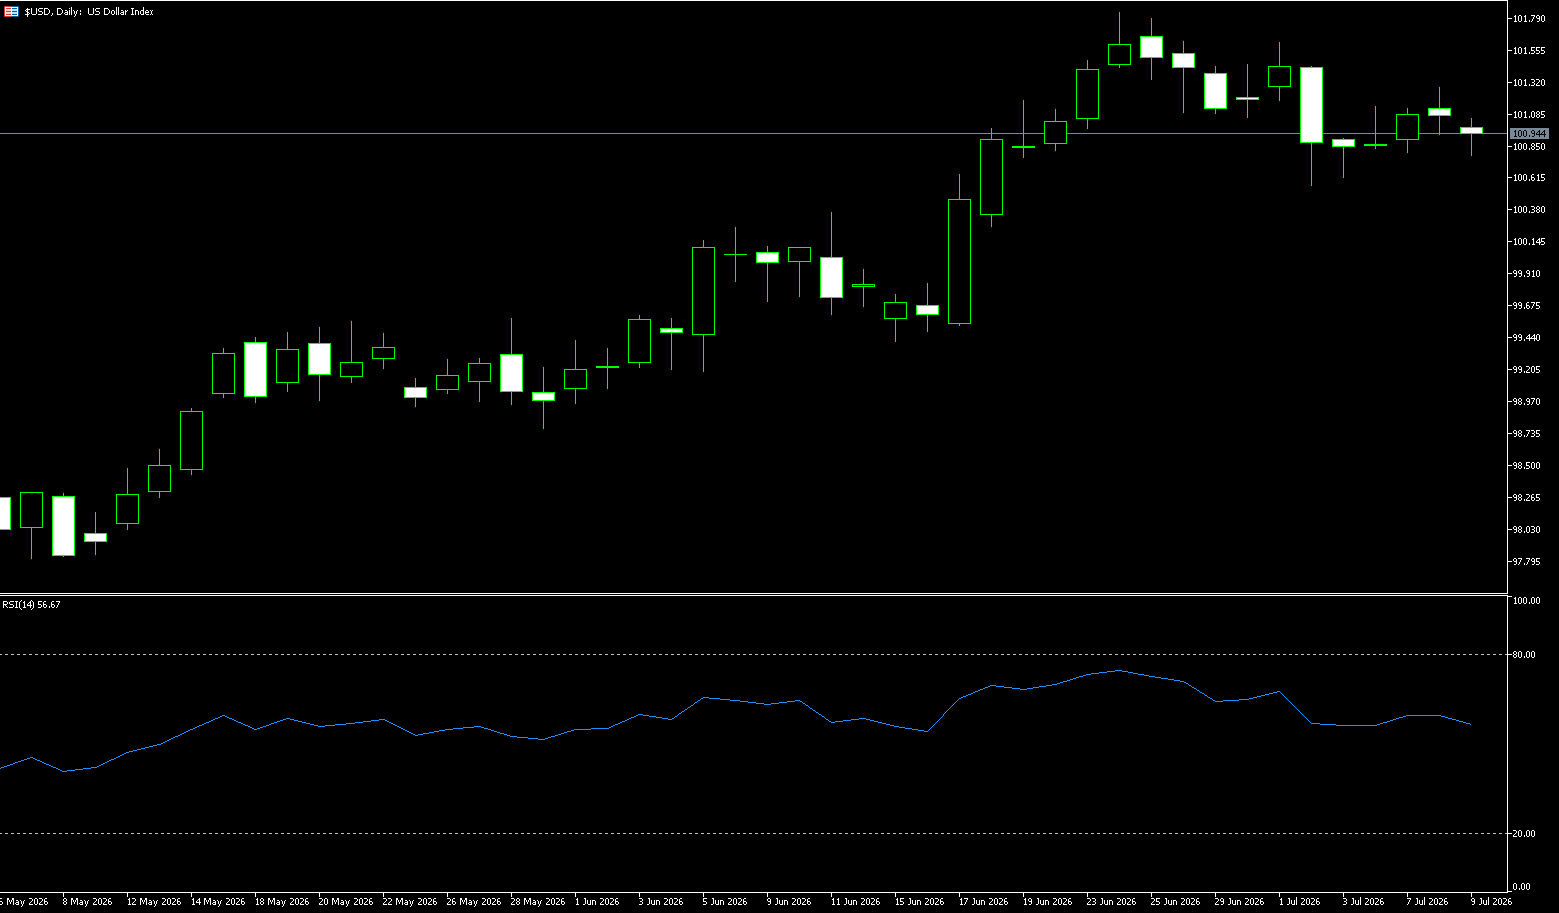
On Thursday, the US dollar index became the most crucial risk pricing vehicle in the forex market. Currently, the US dollar index is trading around 101, approaching its near one-year high. News reports indicate that the Iranian ceasefire agreement is under renewed pressure, escalating shipping security risks in the Strait of Hormuz and causing significant oil price volatility, with Brent crude briefly rising to around $79 per barrel. For the US dollar index, the energy shock is not simply a safe-haven story, but rather a simultaneous reassessment of three factors: inflation expectations, real interest rates, and pressure from non-US energy bills. The rise in the US dollar index does not equate to the market unilaterally pricing in a stronger US macroeconomy. More accurately, the current pricing focus is on whether the Federal Reserve can maintain restrictive interest rates. This means that the short-term elasticity of the US dollar index stems more from the "compression of interest rate cut expectations" or the "re-introduction of the tail risks of interest rate hikes," rather than from growth optimism.
Regarding existing home sales, May sales increased by 3.2% month-on-month, but the broader context is that housing activity remains low, and new home sales and starts also lack strong expansion. For the US dollar index, this creates a medium-term contradiction: geopolitical risks and oil prices are pushing up inflation expectations, supporting the dollar; weak housing inventories and sales are suppressing domestic demand expectations, weakening the dollar's fundamental elasticity. From a technical chart perspective, the US Dollar Index is trading above 100.62 (25-day moving average) and 100.61 (March 7 low), followed by 100.28 (June 18 low). The MACD histogram is at 0.0087, indicating positive momentum, but the expansion is not yet sufficient. The previous high of 101.59 (January 7 high) forms a short-term resistance zone. A break below this level would target the 102 psychological level.
Today, consider shorting the US Dollar Index at 101.06, with a stop-loss at 101.16 and targets at 100.70 and 100.60.
WTI Crude Oil
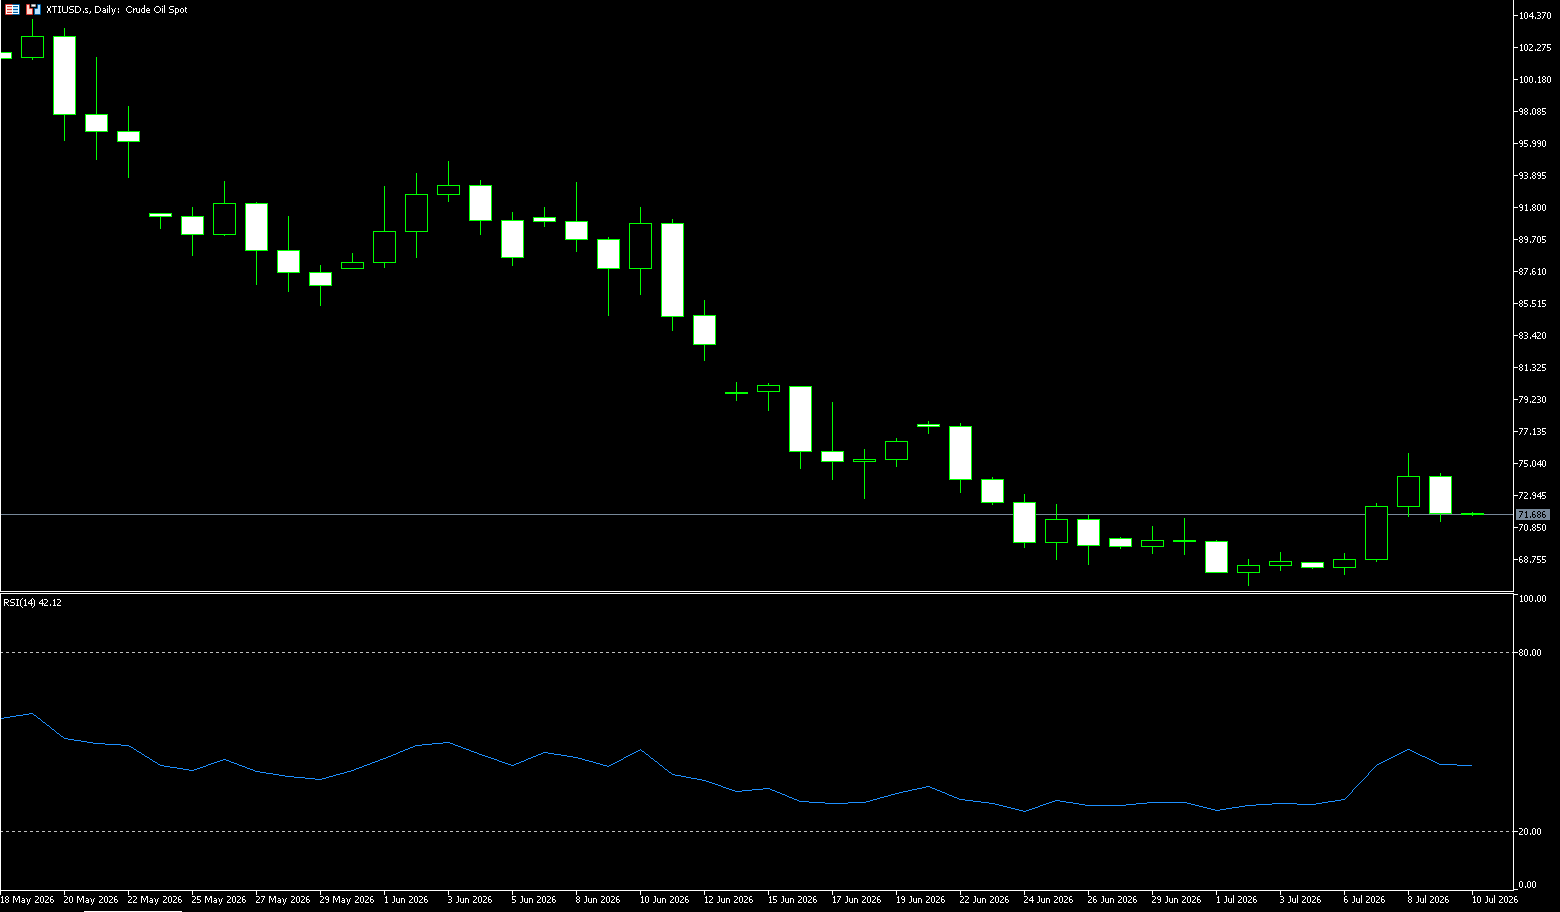
On Thursday, crude oil prices fell below $72 a barrel after rising 4.4% in the previous session, the largest single-day gain since May, as investors reassessed the impact of US-Iran tensions on Middle Eastern supplies. The latest escalations, including additional US strikes against Iran and retaliatory attacks on US bases in the region, have once again brought the Strait of Hormuz into focus for the energy market. However, the extent of disruption to oil flows remains unclear. Ship tracking data shows reduced traffic through the strait, with most visible traffic moving along Iranian-approved routes, while activity in the US-backed Oman corridor is limited. However, traders noted that significant amounts of crude oil were still flowing through the Strait of Hormuz prior to the ceasefire, with some cargoes appearing in tracking data delayed by several days due to weak or malfunctioning signals.
From a technical perspective, WTI crude oil is still in a rebound phase after entering a medium-term downtrend. Regarding the MACD indicator, the DIF is -4.86, the DEA is -5.63, and the histogram has turned positive to 1.55, indicating a marginal convergence of downward momentum, but this is not yet sufficient to confirm a resumption of the medium-term bullish trend. In the short term, the area around $75 per barrel has shifted from resistance to a key level separating bulls and bears. $75.73 (Wednesday) was the first high after the event shock, while $77.95 (the 22/6 high) is a more important trend confirmation zone. If prices fail to rise effectively, it suggests that the rebound is more driven by risk premiums than by a fundamental reassessment. On the downside, watch the $70.00 (psychological level) and the $70.74 (14-day moving average).
Today, consider going long on crude oil at 71.30, with a stop loss at 71.12 and targets of 73.00 and 74.00.
Spot Gold
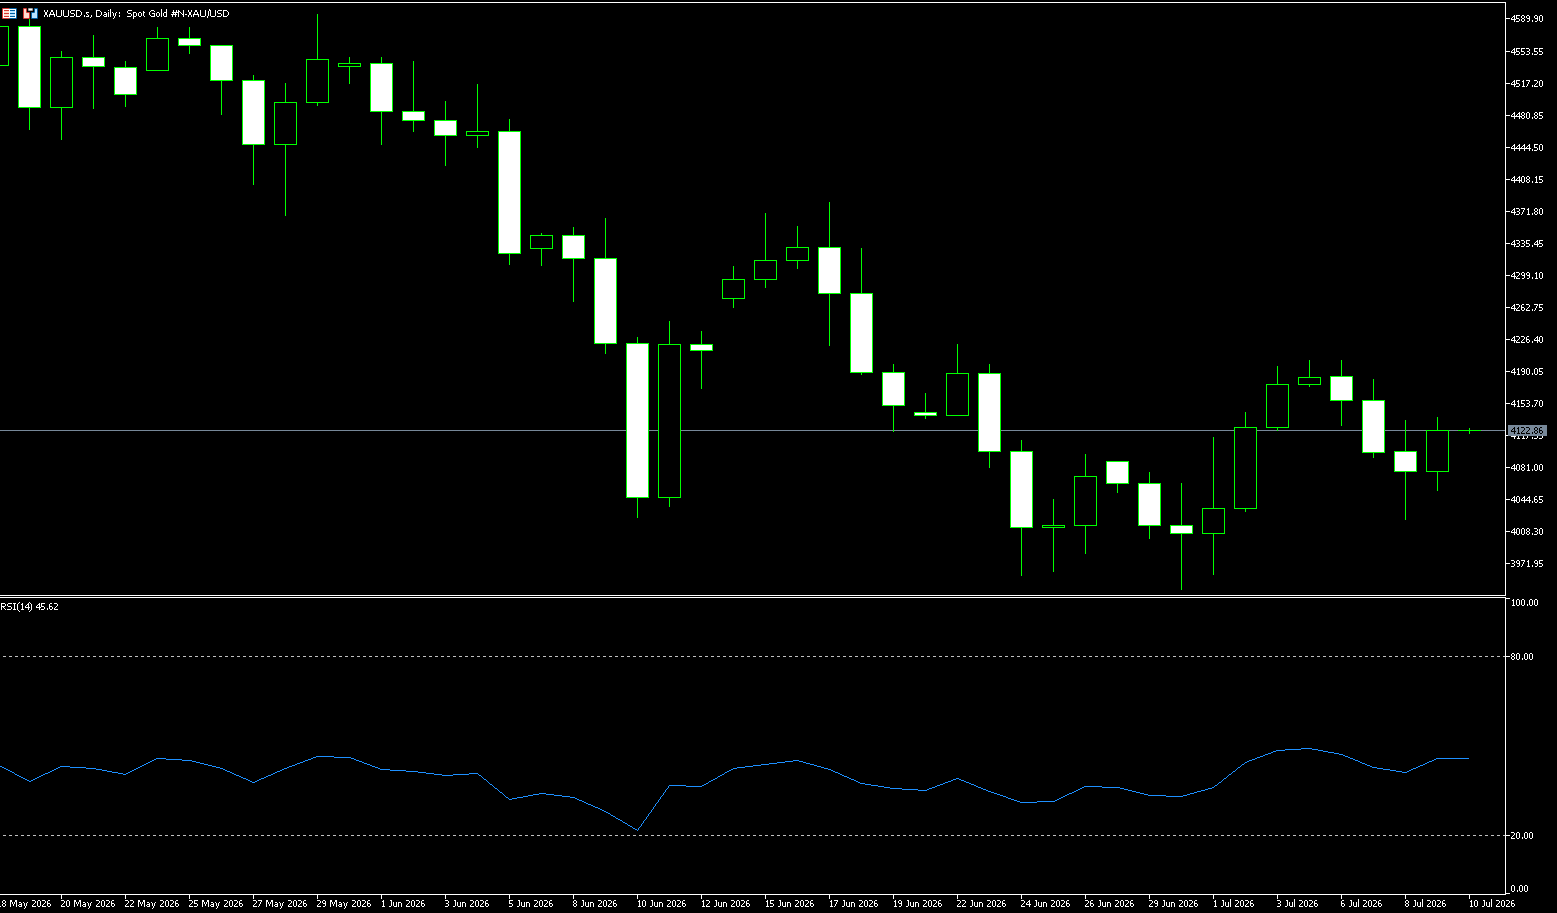
On Thursday morning, spot gold traded around $4,100 per ounce. Spot gold touched its lowest level since July 1st on Wednesday at $4,021.70 per ounce, after US President Trump declared the interim agreement aimed at ending the conflict with Iran "null and void," and warned of possible further strikes. This prompted Iran to retaliate against US military facilities in Bahrain and Kuwait, exacerbating market concerns about inflation. Gold and oil prices fluctuated, and gold subsequently corrected as expected. Secondly, recent dovish comments from Fed Chair Williams, combined with US domestic employment data and market desensitization to the US-Iran war, generally favored a rebound in gold prices. However, Trump's statement that the memorandum of understanding had ended directly triggered market volatility. Meanwhile, gold is generally in a downtrend, and with the US-Iran situation deteriorating more than expected, gold prices are still likely to bottom out or continue to fall.
The daily chart shows gold prices maintaining a short-term bearish bias as they remain below key moving averages. The 20-day simple moving average is at $4,133, and the 34-day is at $4,245, both above the price. The 14-day Relative Strength Index (RSI) has rebounded from its lows but remains around 42, below the midline, while momentum indicators show a similar pattern, reinforcing the weakening buying pressure after the recent pullback. On the upside, near-term resistance is at the 20-day simple moving average at $4,133, followed by Tuesday's high of $4,180, with stronger resistance at the 34-day simple moving average at $4,245. Support is at $4,022 (Wednesday's low), followed by the psychological level of $4,000.
Consider going long on gold today at $4,117, with a stop-loss at $4,110 and targets of $4,170 and $4,160.
AUD/USD
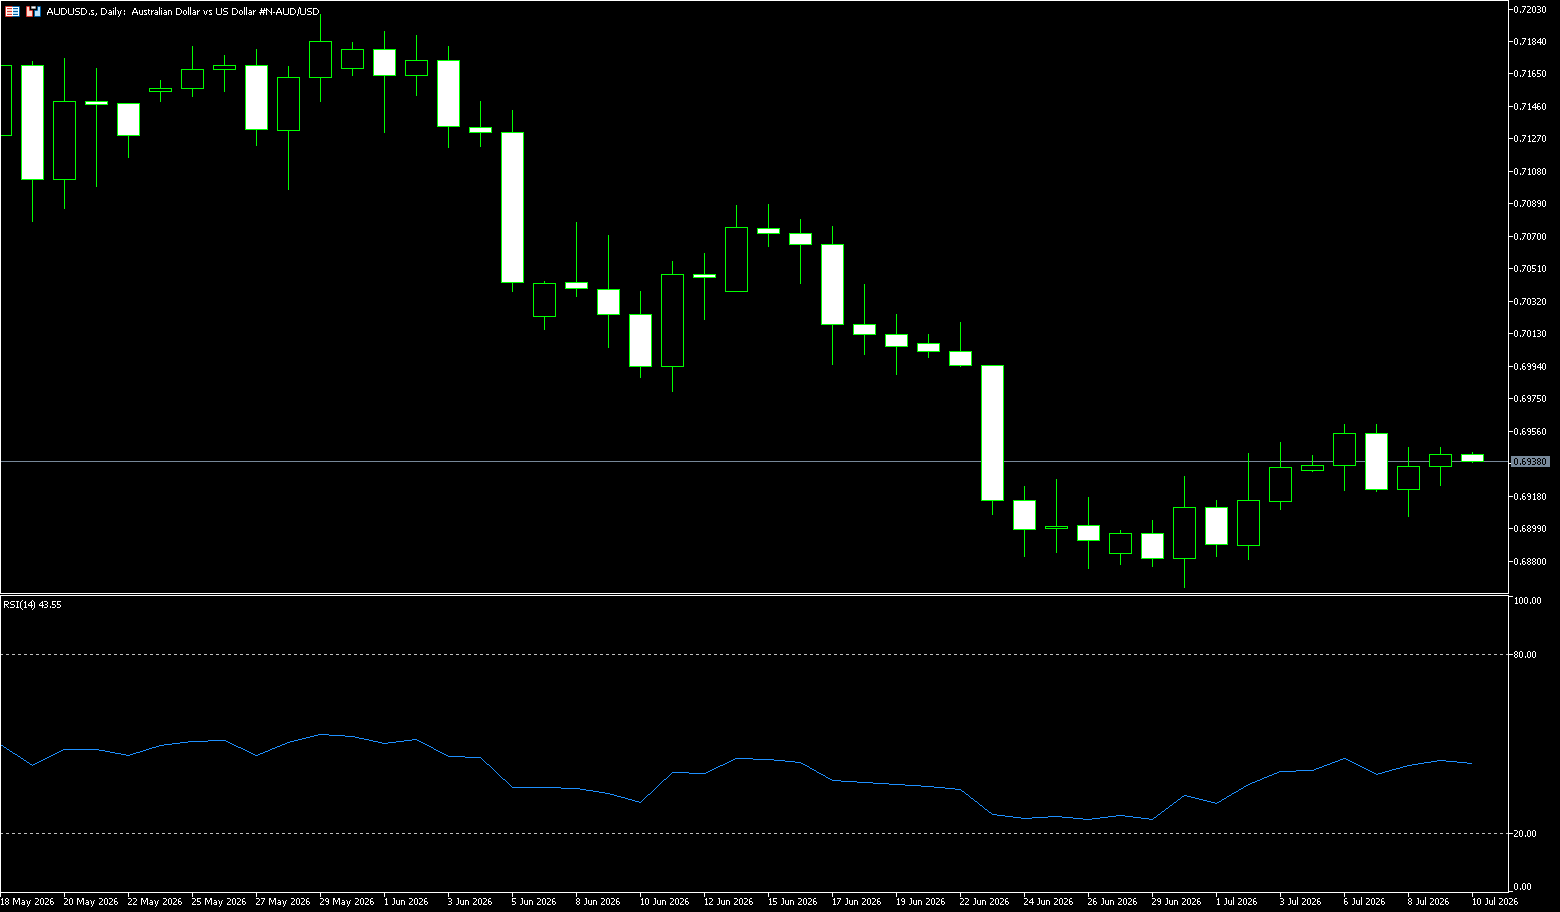
The Australian dollar rose after being flat the previous day, trading around 0.6940 in the Asian session on Thursday. The Australian dollar was little affected as China, New Zealand's close trading partner, released its Consumer Price Index (CPI) inflation data, and the pair maintained its position. Market focus will shift to the US weekly initial jobless claims report for further guidance. Meanwhile, the dollar faced resistance after the release of the Federal Reserve meeting minutes Wednesday night. The committee was deeply divided on the trajectory of inflation, particularly whether it would remain stubborn or begin to cool as geopolitical conflicts in the Middle East ease. However, the downside for the dollar may be limited. Renewed tensions between the US and Iran have fueled concerns about energy-driven inflation, increasing demand for the dollar as a safe haven. Adding fuel to the fire, US President Trump stated on Wednesday that the interim agreement to end the conflict with Iran had officially "ended." The president also threatened a second day of airstrikes and vowed to reimpose the US naval blockade in retaliation for recent attacks on oil tankers passing through the Strait of Hormuz.
According to the daily chart, the Australian dollar against the US dollar has entered a medium-term downtrend from the previous high of 0.7270. The price has been falling steadily from its high, bottoming out at 0.6864 before rebounding, and is currently trading around 0.6940. The moving average system clearly shows a bearish pattern. The short-term 20-day moving average (MA20) (0.6957) and the medium-term 50-day moving average (MA50) continue to exert downward pressure, with the price below the 20-day moving average. Only the 200-day moving average (MA200) forms a key support zone below, indicating a continued bearish trend in the medium to long term. In terms of indicators, the MACD is below the zero line, and the bearish momentum has clearly weakened, suggesting a short-term need for correction. Initial resistance is located near 0.6973 (the 25-day simple moving average) and 0.7000 (a psychological level), followed by horizontal resistance at the 50-day simple moving average (0.7076). Immediate support is seen around 0.6900 (a psychological level), followed by horizontal support at the 200-day simple moving average (0.6874).
Consider going long on the Australian dollar today at 0.6930, with a stop loss at 0.6920 and targets at 0.6980 and 0.6970.
GBP/USD
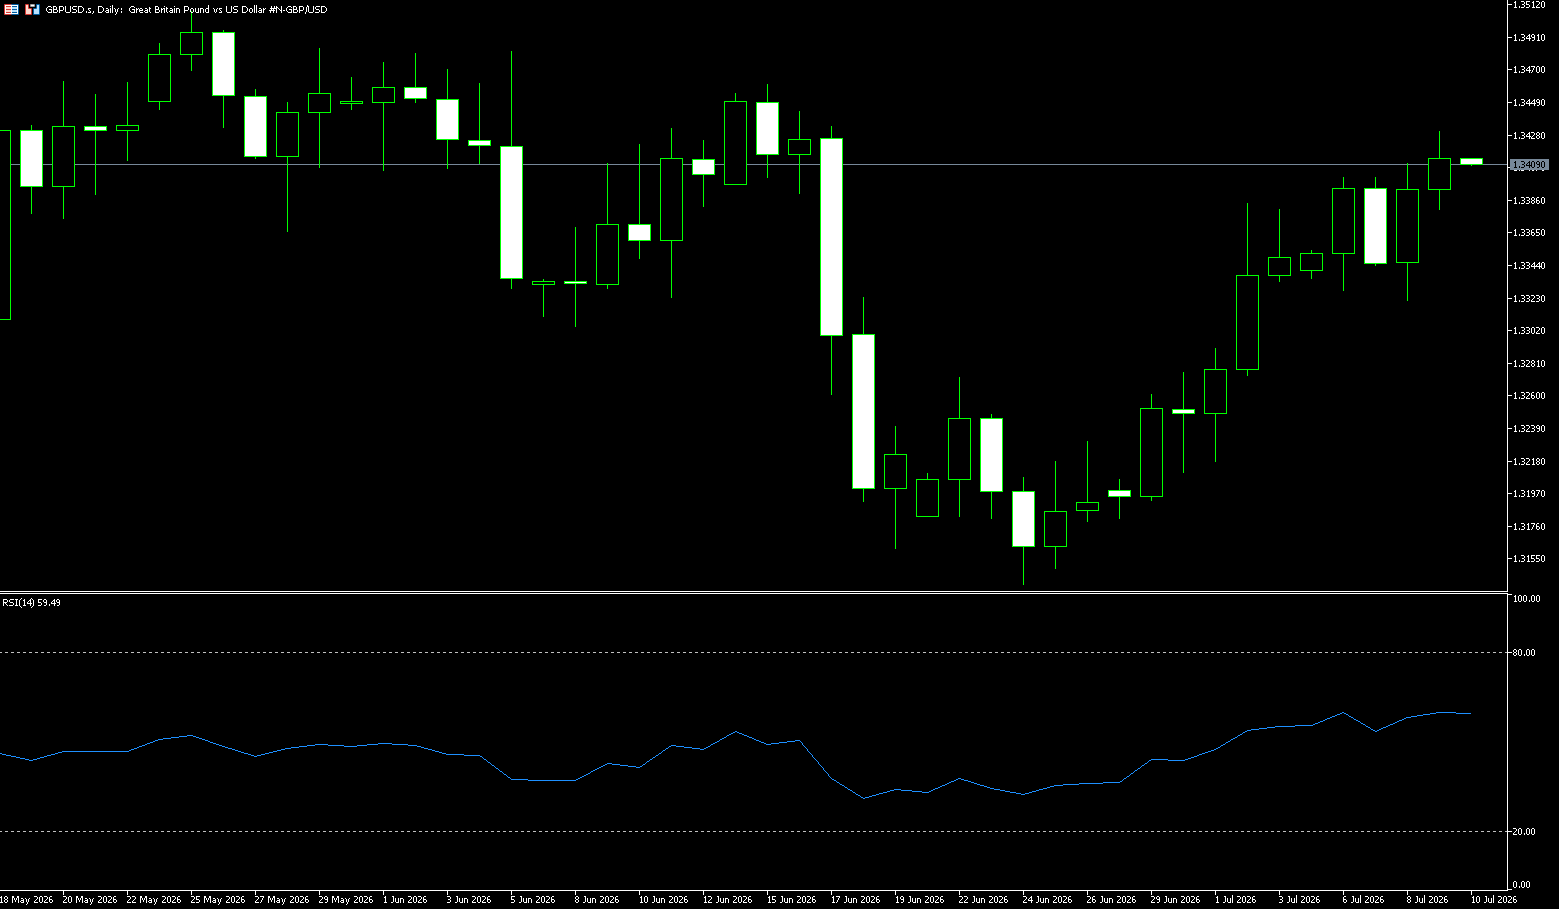
The pound/dollar pair rallied around 1.3400 in Asian trading on Thursday, boosted by easing domestic political uncertainty. However, hawkish minutes from the Federal Reserve and escalating tensions between the US and Iran could support the dollar and limit upside for the major currency pair. Following Kiel Starmer's resignation at the end of June, political risk in the UK eased significantly, boosting the pound. The formal election to succeed Starmer as prime minister will begin on July 9. Leading candidate Andy Burnham is widely expected to become prime minister by July 20. The minutes of the Fed's June meeting, Chairman Kevin Warsh's first meeting, reflected internal disagreements within the central bank on how to adjust interest rates in the absence of further inflation information. On Wednesday, the US military attacked several military bases and port facilities after Iran retaliated by attacking several merchant ships off the coast of Oman. Escalating tensions in the Middle East could boost safe-haven currencies such as the dollar and put downward pressure on the major currency pair.
GBP/USD is trading sideways around 1.3380, maintaining a slightly bullish bias as it remains above the 30-day exponential moving average at 1.3336. The recent rebound from the 1.32 area and the pair's ability to find support at the short-term EMA suggest a tentative upward phase, while the 14-day Relative Strength Index (RSI) at 57.14 shows moderate positive momentum and has not yet entered overbought territory. On the upside, the next key resistance level is 1.3430 (300-day exponential moving average), followed by 1.3500 (psychological level). On the downside, immediate support is reinforced by the 30-day exponential moving average at 1.3336; a daily close below this level would weaken the current constructive tone and force the pair to retest the psychological level of 1.3300.
Today, consider going long on GBP at 1.3400, with a stop-loss at 1.3390 and targets at 1.3450 and 1.3440.
USD/JPY
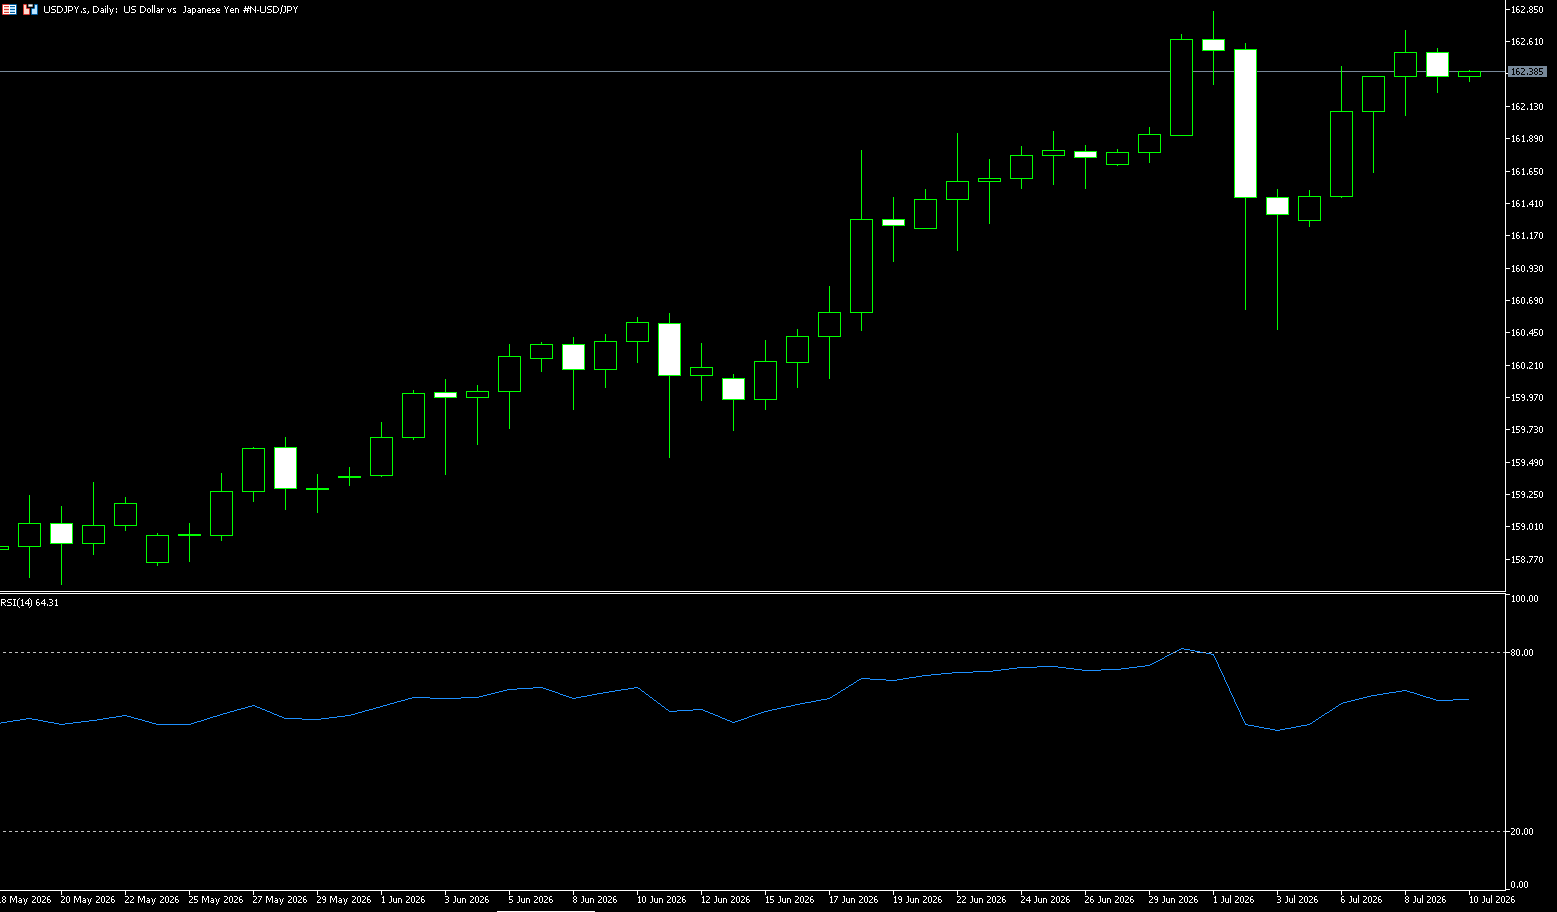
USD/JPY fell slightly to around 162.40 in early Asian trading on Thursday. The yen strengthened against the dollar due to concerns about potential intervention by US authorities. The US weekly initial jobless claims report will be released later on Thursday. Japanese Finance Minister Satsuki Katayama stated that Tokyo maintains regular contact with the US on foreign exchange issues and is prepared to respond appropriately. Michael Nizad, head of multi-asset and coverage strategy at Edmond de Rothschild Asset Management, said, "The current weakness of the yen is excessive and fails to reflect the strong fundamentals of the Japanese economy. This misalignment could prompt coordinated intervention from major central banks." According to the Fed meeting minutes released on Wednesday, the committee was divided on whether inflation could remain high and cool down after the end of the Iran war. At Kevin Warsh's first meeting as Chairman of the Federal Open Market Committee (FOMC) on June 16-17, many participants indicated that the key interest rate would remain at or slightly below the current level of 3.6% by the end of the year. However, "many" participants also suggested that interest rates could be higher by the end of the year.
From a daily chart perspective, the USD/JPY pair has recently maintained a high-level consolidation pattern. Although the price has retreated from its recent highs, it remains within an overall upward trend zone. Currently, the exchange rate is adjusting due to short-term dollar weakness and expectations of Japanese intervention, but no clear trend reversal signal has yet formed. The technical structure shows that the bullish trend still exists, but the upward momentum has slowed. Key resistance levels to watch are around 162.84 (July 1st high). A break above this level could lead to a retest of the psychological resistance around 163.00 and the resistance around 163.50. A break above 163.50 could lead to a retest of the psychological level around 165.00. Support is seen around the psychological level of 162.00. A break below this level could lead to a further pullback to around 161.70, near Tuesday's low, followed by the key support zone around 160.50 that held off the bears last week. The MACD indicator shows signs of weakening bullish momentum, indicating the market is entering a consolidation phase at higher levels.
Consider shorting the US dollar at 162.55 today, with a stop loss at 162.70 and targets at 161.70 and 161.80.
EUR/USD
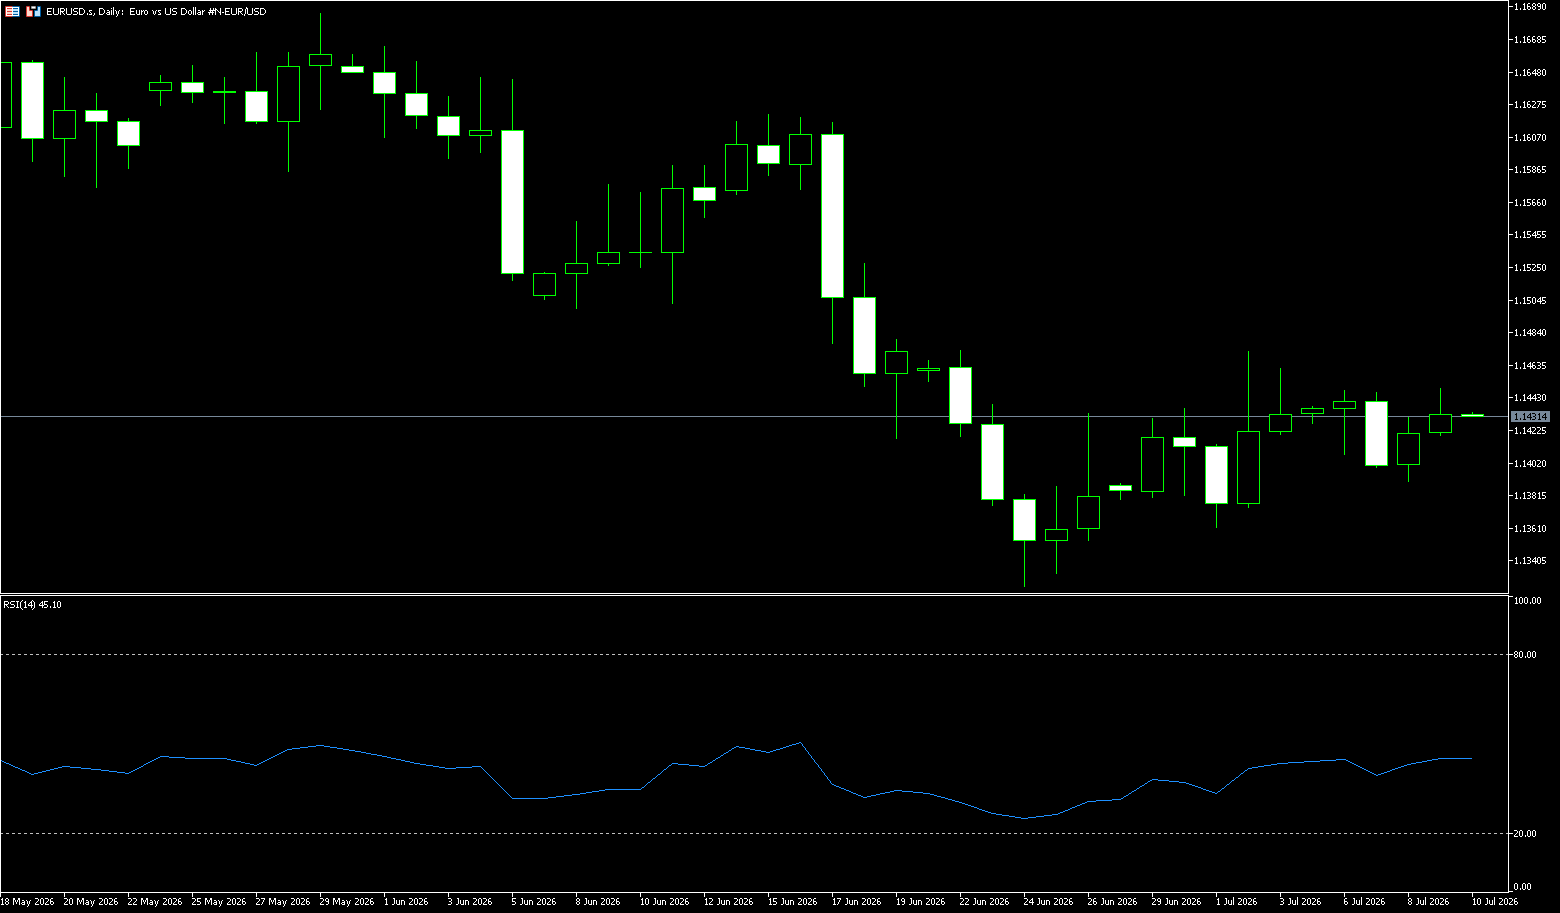
EUR/USD attracted buying interest for the second consecutive day, although lacking sustained momentum and remaining within the previous day's range during Thursday's Asian session. Spot prices are currently trading around 1.1430 and continue to be influenced by the dynamics of the US dollar. The US Dollar Index tracks the dollar's performance against a basket of currencies and remains under pressure below the weekly high reached on Wednesday, as market expectations for a Fed rate hike have weakened. Following last week's weak US non-farm payrolls report, the minutes of the June 16-17 FOMC meeting showed policymakers have a high degree of uncertainty about the interest rate outlook. On the other hand, bets on a European Central Bank rate hike have been pressured by an unexpected drop in eurozone inflation. This may make traders reluctant to take aggressive bullish bets on the euro, further limiting the euro/dollar's gains. Traders are now focused on the release of the ECB monetary policy meeting minutes and the US weekly initial jobless claims data for new impetus.
From a technical perspective, the euro/dollar exchange rate has struggled to find support above 1.1362 (the 1/7 low) and was rejected near the resistance of the ascending channel on Thursday. Against the backdrop of recent declines, this upward-sloping channel forms a bearish flag pattern. This keeps the 200-period exponential moving average on the 4-hour chart acting as resistance, further reinforcing the supply zone above. Meanwhile, momentum indicators suggest a slightly constructive backdrop. In fact, the Relative Strength Index (RSI) is hovering below 50, while the MACD histogram is slightly positive. On the downside, the first significant support appears at 1.1362 (the 1/7 low), and if bearish pressure persists, the previous channel starting area around 1.1324 (the 24/6 low) will become secondary support. The next relevant resistance level is locked at 1.1491 (the 30-day moving average). Above that, the psychological resistance level of 1.1500 forms a broader resistance barrier.
Consider going long on the Euro at 1.1420 today, with a stop loss at 1.1410 and targets at 1.1460 and 1.1470.
Stock Analysis:
Australian ASX 200 Stock Index
Basic Market Overview:
The Australian Securities Exchange (ASX) 200 index fell 23 points, or 0.3%, to close at 8,762 on Thursday, marking its fourth consecutive day of decline. This followed US President Trump's refusal to engage in further negotiations with Iran and his warning of potential additional strikes, which dampened hopes for stability in the Middle East. Meanwhile, the International Monetary Fund lowered its 2026 growth forecast for Australia to 1.9% from 2%, adding that consumer price inflation will remain stubbornly high, projected to reach around 4% in 2026.
The processing sector, non-energy minerals, healthcare, and consumer non-durable goods were under pressure, partially offset by strong performance in consumer durable goods, energy minerals, retail trade, and industrial services. Heavyweight BHP Group fell 1.1%, while Rio Tinto plunged 3.3% due to lower copper prices. Gold stocks also declined, with Evolution Mining and Northern Star Resources falling 1.7% and 0.9% respectively. Three of the four major banks saw their share prices decline, with drops ranging from 0.1% to 0.8%.
Sector Performance:
Leading Sectors (from highest to lowest gain):
Energy +1.67% (strongest performer)
Core Drivers: Escalating US-Iran geopolitical conflict, Brent crude oil breaking through $79, market concerns about Middle Eastern oil supply disruptions, and upward revisions to oil and gas companies' profit forecasts.
Leading Stocks: Woodside Energy (+1.9%) and Santos (+1.4%) have strengthened for two consecutive days.
Utilities +1.28% A safe-haven defensive sector, with inflows into high-dividend stocks and a preference for stable cash flow assets amid fluctuating US Treasury yields.
Healthcare +0.13%, Industrials +0.12% Slight gains, with divergence among individual stocks; heavyweight healthcare and mining companies offset some of the declines.
Leading Sectors (from largest to smallest decline):
Materials -1.48% (Weakest performer)
Multiple negative factors: Weakening copper prices and a stronger dollar weighed on industrial metals; gold mining stocks collectively retreated.
Key players: Rio Tinto (-3.3%), BHP (-1.1%), and Evolution Mining (-1.7%) experienced significant declines, becoming the core force dragging down the market.
REITs -1.11%
Oil prices pushed up inflation expectations, and renewed concerns about interest rate hikes led to high interest rates suppressing real estate valuations, resulting in weakness across commercial real estate and warehouse REITs.
Financials -0.15%
The four major banks showed mixed performance, with most closing slightly lower; asset management and insurance stocks were under pressure, offsetting some of the sector's gains.
Technical Analysis:
The ASX200 index closed at 18762.5 points today, down 22.6 points, or 0.26%. Intraday range: high 8785.1 / low 8700.5, trending downwards throughout the day, marking the fourth consecutive trading day of decline. Today's close broke below the 200-day moving average for the first time, clearly signaling a short-term weakening trend. The daily chart shows a four-day downward staircase pattern, breaking through the lower edge of the high-level consolidation range, indicating a short-term correction. The long-term bullish structure remains intact, but the next 3-5 trading days are expected to be characterized by weak, volatile trading. The daily RSI has fallen to the 42 range, not yet oversold, but continues to decline, indicating that bearish momentum has not yet weakened. The ADX trend strength is 24, showing a gradually strengthening short-term downtrend with no clear divergence or bottoming signal. Trading volume: four consecutive days of increasing volume during declines and decreasing volume during rebounds, a typical weak volume-price structure. Regarding moving averages, the 200-day moving average is around 8770, which was effectively broken today at 8762.5, turning medium-term support into resistance and serving as a key watershed for this round of correction. The 50-day moving average is at 8821, representing strong short-term resistance; the index has traded below the 50-day moving average for four consecutive days, confirming a downtrend. Furthermore, the short-term moving averages are in a bearish alignment: the 5/10/20-day moving averages have all turned downwards, and the price continues to be pressured below these short-term moving averages.
Trading Strategies:
The following are technical trading ideas only and do not constitute investment advice. Leveraged trading may result in losses exceeding the principal.
**Low-Buy Strategy (Only for betting on a support rebound, small position size)**
Short-Term Long Positions
Entry Conditions: Retracement to 8700 support and stabilization; hourly chart shows a bullish close indicating a halt to the decline. Enter with a small long position.
Target: 8760-8770 (reduce position at 200-day moving average)
Stop Loss: Exit immediately if the price breaks below 8690; do not hold onto losing positions.
**Short-Term Trend-Following Strategy (Current Main Trend, Prioritized)**
Intraday Short-Term Trading (Same Day/Next Day)
Entry Conditions: Rebound to 8765-8770 (200-day moving average resistance) and encountering resistance; hourly chart shows a bearish close. Enter with a small short position.
Target 1: 8700 (Intraday Low); Target 2: 8675
Stop Loss: Exit if the price rebounds and stabilizes above 8790; single-trade stop loss should be controlled at 30. Key Risk Warnings:
Geopolitical Black Swan Events: Easing tensions between the US and Iran, a rapid decline in crude oil prices, and a rebound in resource stocks will drive the index recovery;
Commodity Volatility: A significant rebound in iron ore and copper prices will help recover heavyweight mining stocks and rapidly boost the ASX200;
Overnight Performance of US Stocks: A rebound in the Dow Jones will likely lead to a gap-up opening for the Australian index, directly breaking through short-term resistance;
Australian Inflation/RBC Statement: If inflation data declines, market expectations for interest rate cuts will rise, benefiting the financial and real estate sectors.
New Zealand 50 Index (NZX50)
Basic Market Overview:
The NZX50 index rose 120 points, or 0.9%, to close at a record high of 13,786 points on Thursday, reversing the previous day's decline, mainly boosted by gains in the financial, industrial, and healthcare sectors. The latest data improved market sentiment, with New Zealand's manufacturing sector recording its strongest growth since July 2021 despite high oil prices. However, traders are still assessing the impact of the Reserve Bank of New Zealand's decision on Wednesday to raise interest rates by 25 basis points and signal further tightening to keep inflation within the target range. Rising oil prices also limited gains, as inflation concerns increased expectations of further rate hikes.
Fletcher Building shares surged 5.6% after the company raised its full-year earnings forecast and reported better-than-expected sales; Infratil rose 3.1%, Ebos Group gained 1.8%, and Fisher & Paykel climbed 1.2%. The index rose 1.2% this week, marking its second consecutive weekly gain. Markets will be closed on Friday for a local holiday.
Sector Performance:
Leading Gains:
Leading Sectors (Core Drivers)
1. Industrials: Strongest performing sector, with Fletcher Building surging 5.6% (hitting a four-month high and raising its full-year earnings forecast), Infratil up 3.1%, Port of Tauranga up 2.7%, and Freightways up 2.1%.
2. Financials: Providing significant support, Westpac Banking Corporation up 1.4%.
3. Healthcare: Ebos Group up 1.8%, Fisher & Paykel Healthcare up 1.2%.
4. Communication Services: Chorus up 1.8%, Gentrack Group up 1.1%.
Lowly Performing Sectors (Limited Drag)
Amid the overall market rally, the impact of declining sectors was limited, mainly concentrated in:
1. Healthcare-related stocks: AFT Pharmaceuticals down 2.1%.
2. Infrastructure-related stocks: Channel Infrastructure down 2.2%.
3. Some consumer and utility stocks: Summerset Group fell slightly by 0.7%, Vector Limited fell by 1.0%
Technical Analysis:
The New Zealand 50 Index closed at 13786.67 points today, up 120.49 points in a single day, a gain of 0.9%, setting a new historical closing high; after the central bank raised interest rates on Wednesday, it pulled back, rebounded strongly on Thursday, and was closed all day on Friday due to the Matariki public holiday. There were only 4 trading days this week, with a cumulative weekly gain of 1.2%. The lowest point in the morning was around 13662, and it rose to the high of the day at the end of the day, closing with a bullish candlestick. The bulls completely controlled the market during the day, repairing the gap caused by Wednesday's interest rate hike. Medium and long-term trend: It continues to run along the upward channel, constantly setting new historical highs, with no obvious top structure, which is a strong bullish trend. Technical indicator RSI (14): 61.8, which is in the bullish range. It has not entered the severely overbought range above 70, and there is still room for upward movement, but it is close to the overbought threshold, and the risk of chasing the high is increasing. MACD: The red bars continue above the zero line, and the fast and slow lines maintain a golden cross, indicating ample bullish momentum; however, the amplitude of the red bars has narrowed slightly, suggesting a weakening of the upward momentum. Regarding trading volume, Thursday saw increased volume, with funds flowing back into financial, industrial, and healthcare stocks, confirming the validity of the rebound.
Trading Strategy:
**Trend Following (Prioritized strategy, aligning with the main trend)**
Entry Range: Buy in batches on pullbacks to 13680-13720; avoid chasing long positions above 13780; Stop Loss: Exit if the price breaks below 13650 (intraday support breached, rebound logic invalidated). Targets: First Take Profit: 13840-13850 (reduce position by 50%); Second Take Profit: 13910-13920 (exit all positions).
**Short-Term Shorting (Only attempt shorting with a small position after a failed breakout)**
Entry Conditions: Shorting with a small position after a rally to 13840-13850 followed by resistance and a pullback, RSI reaching 70 and showing a long upper shadow. Stop Loss: Exit if the price breaks above 13880. Targets: 13750, 13680. Position Limits: Short positions must not exceed half the size of long positions; strictly control risk for counter-trend trades.
Risk Warnings:
Core Negative Factors in Monetary Policy (Largest Medium- to Long-Term Risk)
The Reserve Bank of New Zealand raised interest rates by 25 basis points to 2.5% on Wednesday, clearly signaling continued rate hikes to suppress inflation. High interest rates continue to suppress the real estate, retail, and consumer sectors. If inflation data rebounds, further rate hikes by the central bank will directly depress index valuations, making a rapid correction likely at high levels.
Technical Risks
The index continues to reach new historical highs with no historical resistance references. The RSI is approaching overbought territory. Once long positions are liquidated, without strong trading support, the correction will accelerate significantly. The market is closed on Friday; if negative news emerges over the weekend, a gap-down opening on Monday is highly probable.
Disclaimer: The information contained herein (1) is proprietary to BCR and/or its content providers; (2) may not be copied or distributed; (3) is not warranted to be accurate, complete or timely; and, (4) does not constitute advice or a recommendation by BCR or its content providers in respect of the investment in financial instruments. Neither BCR or its content providers are responsible for any damages or losses arising from any use of this information. Past performance is no guarantee of future results.
More Coverage





Risk Disclosure:Derivatives are traded over-the-counter on margin, which means they carry a high level of risk and there is a possibility you could lose all of your investment. These products are not suitable for all investors. Please ensure you fully understand the risks and carefully consider your financial situation and trading experience before trading. Seek independent financial advice if necessary before opening an account with BCR.
BCR Co Pty Ltd (Company No. 1975046) is a company incorporated under the laws of the British Virgin Islands, with its registered office at Trident Chambers, Wickham’s Cay 1, Road Town, Tortola, British Virgin Islands, and is licensed and regulated by the British Virgin Islands Financial Services Commission under License No. SIBA/L/19/1122.
Open Bridge Limited (Company No. 16701394) is a company incorporated under the Companies Act 2006 and registered in England and Wales, with its registered address at Kemp House, 160 City Road, London, England, EC1V 2NX. Open Bridge Limited acts solely as a payment processor for BCR Co Pty Ltd and does not provide any financial, trading, or investment services on its behalf. Open Bridge Limited's role is limited to payment processing.


 English
 简体中文
简体中文
 繁體中文
繁體中文
 Bahasa
Melayu
Bahasa
Melayu
 Tiếng
Việt
Tiếng
Việt
 ไทย
ไทย
 日本語
日本語
 한국어
한국어
 ភាសាខ្មែរ
 español