


0
US Dollar Index
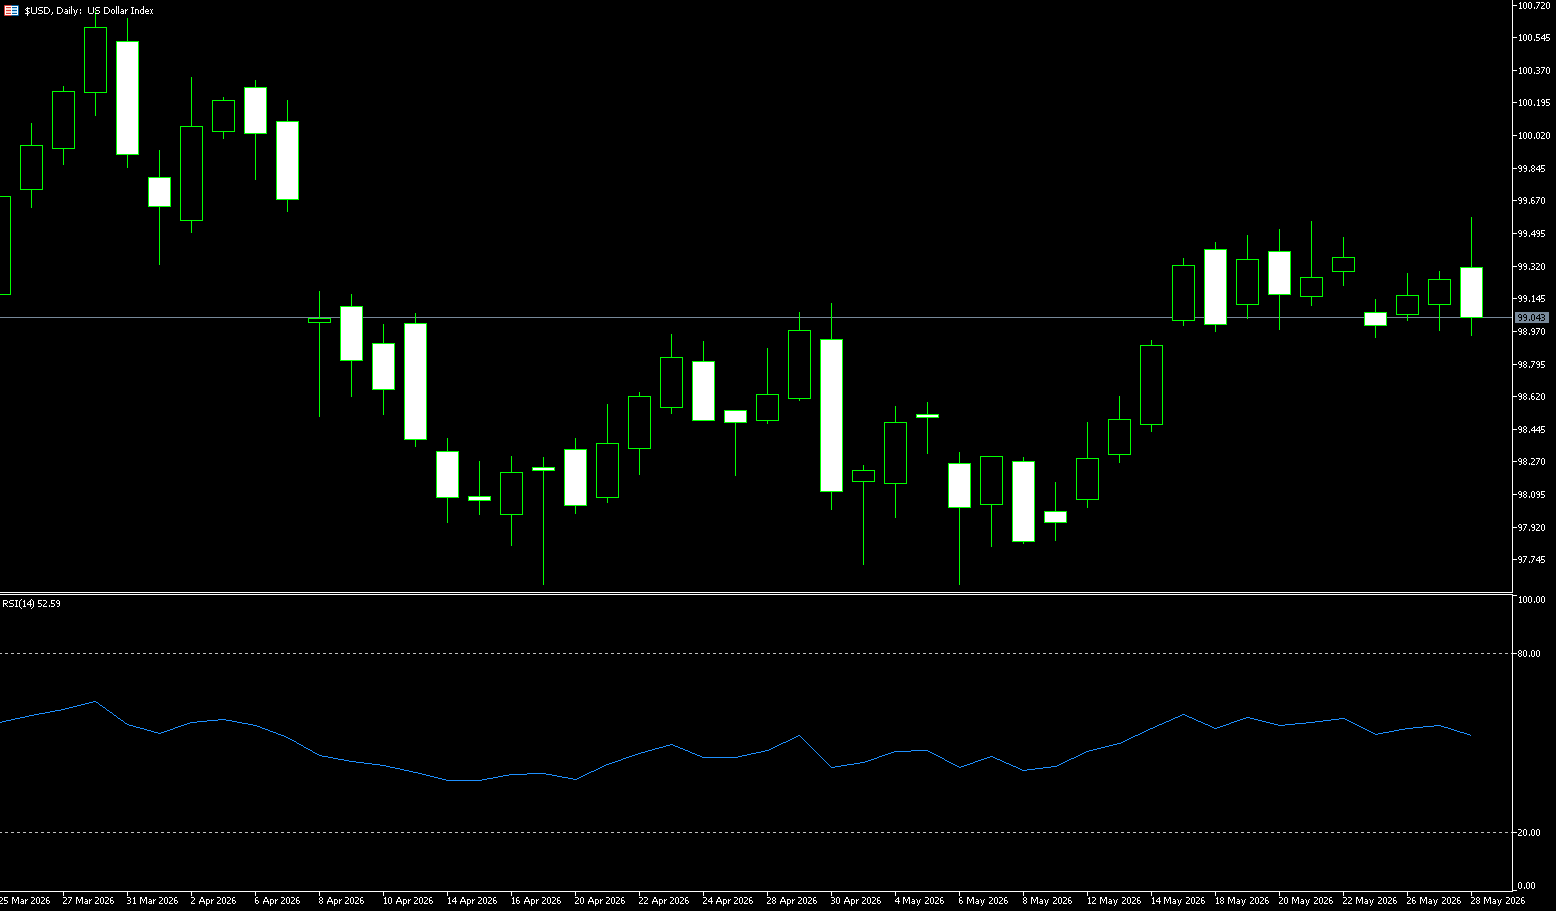
The US dollar index was above 99.00 on Thursday, nearing a seven-week high, as reports of a new round of US strikes on Iranian military facilities dimmed the prospects for a peace agreement and exacerbated concerns about inflation and interest rates. The two countries remain divided on key issues including Tehran's insistence on controlling the Strait of Hormuz and maintaining its nuclear program. Meanwhile, Minneapolis Federal Reserve President Neal Kashkari stated on Thursday that lowering US inflation remains his top priority, noting that consumer prices remain high while the labor market continues to show resilience. Investors are currently focused on the upcoming Personal Consumption Expenditures (PCE) price index, the Federal Reserve's preferred inflation indicator, for further guidance on the outlook for US interest rates. The market currently estimates a roughly 50% probability of a Federal Reserve rate hike by December.
Energy price volatility triggered by the Middle East conflict is currently the most difficult variable for traditional models to fully explain in the US dollar index. The current trading focus for the US dollar index is not on predicting immediate action by the Federal Reserve, but rather on whether it will remove its easing signals. The US dollar index is trading around 99, with limited change from the previous trading day. The 99.00 level has become a sentiment pivot point, while the 98.70-98.60 range will determine the resilience of any pullback, and the 99.60-99.70 area will determine the quality of any rebound. Looking at the daily chart, the latest price of the US dollar index is slightly above 99. The index has regained its position above the 20-day moving average at 98.74, indicating that the previous dip around 97.62 has been corrected. However, the 99.51 level and the psychological level around 100 remain resistance areas from recent highs. The MACD histogram is in positive territory, with the fast and slow lines recovering upwards, but the momentum has not expanded significantly. This combination suggests a slightly bullish consolidation rather than an accelerating trend.
Today, consider shorting the US Dollar Index at 99.20, with a stop-loss at 99.30 and targets at 98.70 and 98.80.
WTI Crude Oil
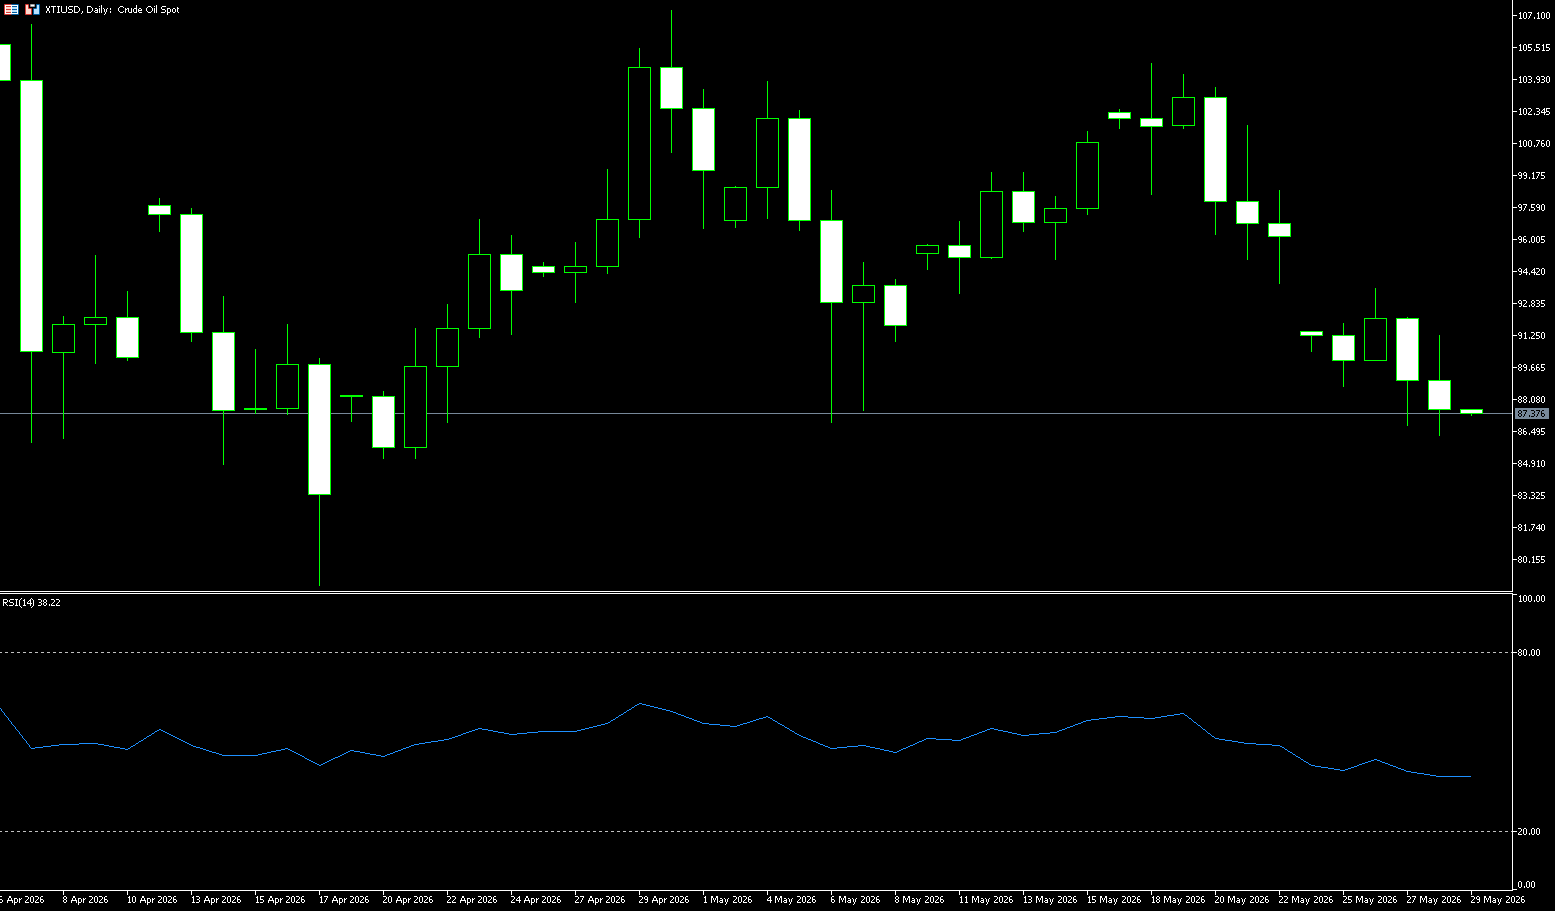
WTI crude oil rose above $87.80 a barrel on Thursday as negotiations between the US and Iran on several key issues to end the conflict remained deadlocked. Reports of a new round of US strikes against Iran also exacerbated concerns about further disruptions to commercial shipping in the Strait of Hormuz. One of the main obstacles is Tehran's demand to maintain control of the strait and uphold its nuclear program. President Trump also reiterated that Washington would not accept what he called a bad deal and rejected any sanctions easing, despite Iran's calls for an end to attacks and economic concessions. Nevertheless, oil prices are still on track for a second consecutive week of decline, as the market anticipates a possible peace agreement and the reopening of the Strait of Hormuz.
Currently, the signing of a US-Iran agreement is on the fast track, but official news emerged around the same time that a 60-day ceasefire framework between the US and Iran had been established, but the reopening of the Strait of Hormuz remained unresolved, causing oil prices to initially fall before rebounding. Currently, oil prices are trading within two main ranges: the first range is $86.13-$105.21, with key retracement resistance levels at $93.42-$95.67; the second range is $77.22-$105.21, with a retracement range of $87.91-$91.21. Oil prices are currently testing the second range. The core targets for this rebound are $93.57 (this week's high) and $96.40 (the 20-day moving average). If prices rebound to these levels and encounter strong selling pressure, forming a second high, the market strategy will shift from buying on dips to selling on rallies. $93 will be a key dividing line between bulls and bears: a valid break above this level would signal the start of a short-term rebound; if resistance persists, $87.66 (the lower Bollinger Band) will become the focus of the battle between bulls and bears. A break below this level could see oil prices head straight for the long-term psychological support level of $80.
Today, consider going long on crude oil at 87.65, with a stop loss at 87.50 and targets at 90.00 and 91.00.
Spot Gold
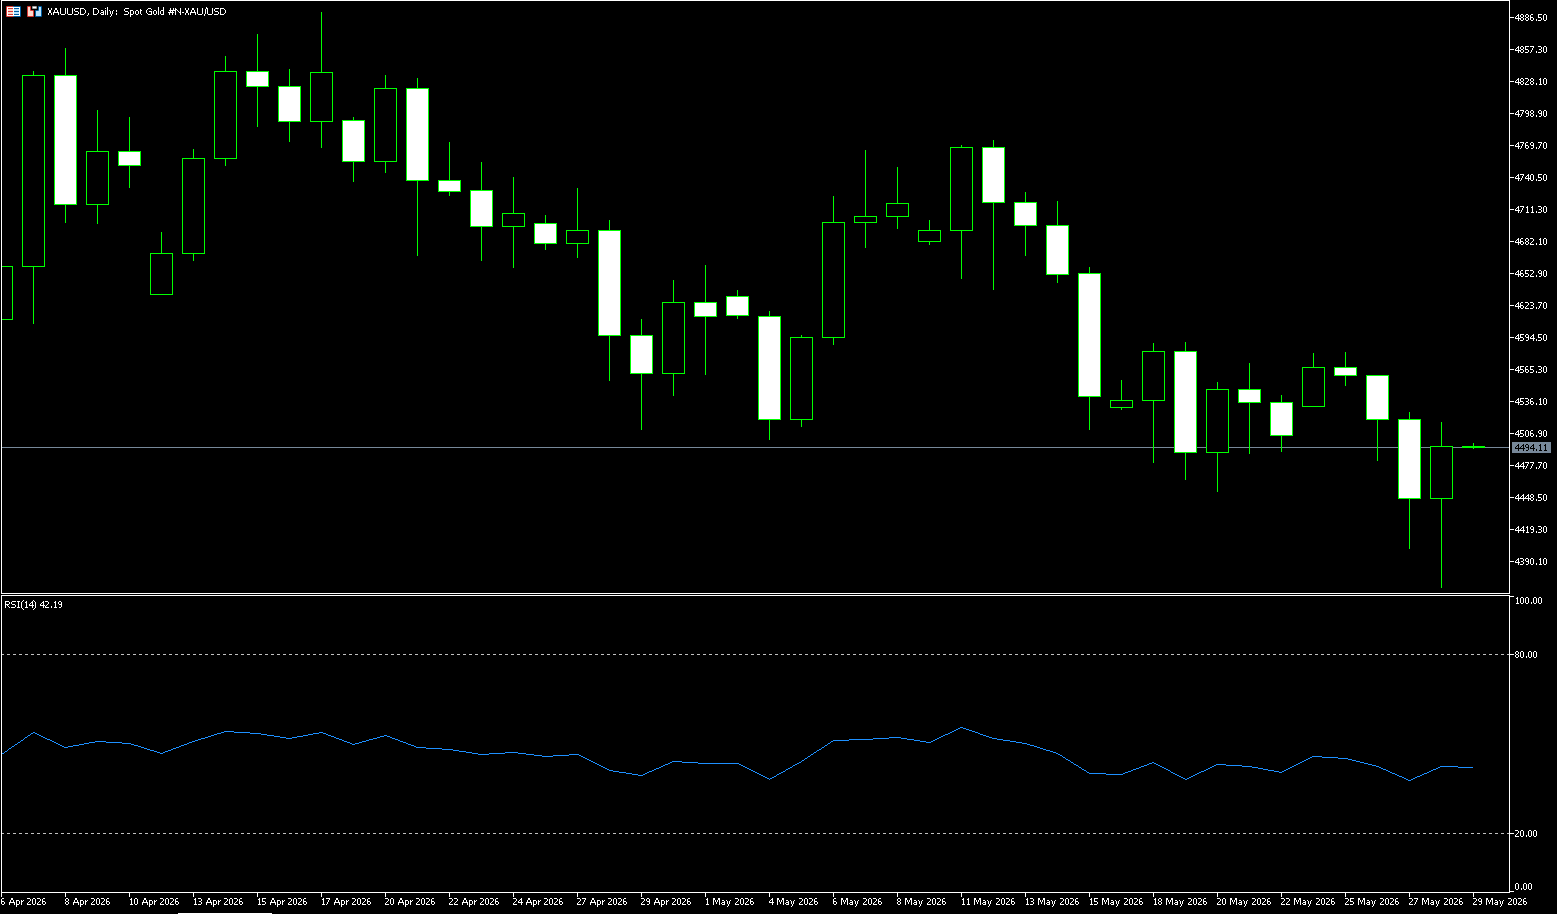
Gold fell below $4,400 an ounce on Thursday, hitting a two-month low, as reports of a new round of US strikes on Iranian military bases clouded the prospects for peace talks, with inflation and interest rate concerns remaining a focus. Key disagreements remain unresolved, including Tehran's insistence on control of the Strait of Hormuz and retaining its nuclear program. President Trump reiterated that the US would not agree to what he called a bad deal and refused to ease sanctions on Iran, despite Tehran's demands for financial aid and a halt to attacks. Even if both sides take further steps toward an agreement, high energy prices are expected to exacerbate inflationary pressures and prompt central banks to maintain higher interest rates rather than cut them. Gold prices have now fallen by more than 15% since the start of the conflict.
Currently, gold prices have fallen below all major moving averages except the 200-day moving average. The 5-day moving average (MA5) is below the current price, while the 10-day, 20-day, 50-day, and 100-day moving averages (MA10, MA20, MA50, and MA100) are all significantly higher, forming a layer of resistance. This bearish alignment of "price below most major moving averages" indicates that gold is in a clear downtrend, with increasing pressure for a short-term pullback. It's worth noting that since falling from above $4,950 in mid-May, the price has been trading below the 20-day moving average (MA20) for several consecutive days, clearly indicating a short-term bearish pattern. Support levels to watch are $4,400 (psychological level), $4,399 (200-day moving average), and then $4,350 (March 26 low). Conversely, significant resistance lies above $4,500. However, the complexity and uncertainty of the Middle East situation still provide potential support for gold. This week's gold price movement largely depends on the market's reaction to the 61.8% Fibonacci retracement level at $4,541.80. If the price holds above this level, the next target is $4,744.34.
Today, consider going long on gold at 4,490, with a stop loss at 4,485 and targets at 4,550 and 4,560.
AUD/USD
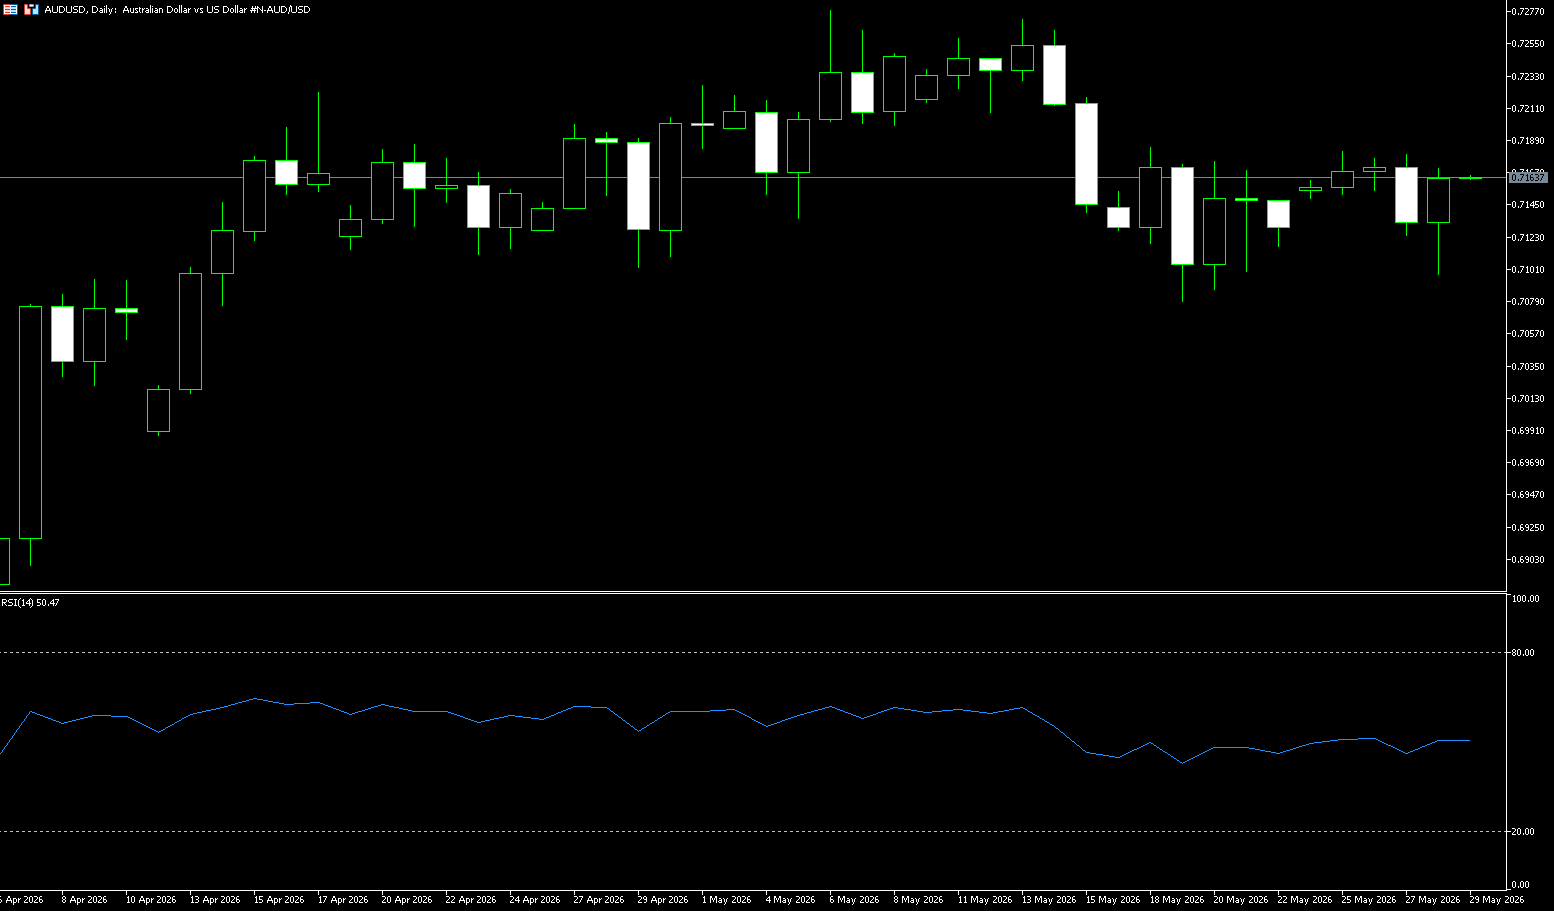
The Australian dollar fell to around 0.71, hitting a six-week low, as weak household demand exacerbated expectations that policy tightening was nearing its end. Data showed that household spending fell more than expected by 1.1% in April, with consumers reducing spending on travel, clothing, and food, while higher fuel costs and geopolitical uncertainty weighed on confidence. This decline further suggests that restrictive monetary policy is suppressing demand, even as business investment surged 6.5% in the first quarter, primarily driven by imported data equipment. The market widely expects the Reserve Bank of Australia to keep interest rates at 4.35% in June, while the probability of an August rate hike has halved to 40%. Early inflation data also supported the shift in sentiment, with the overall consumer price index (CPI) falling to 0.4% in April and the annual inflation rate slowing to 4.2%, partly due to fuel tax relief. However, core inflation remained high at 3.4%, still above the Reserve Bank of Australia's target range, reflecting the continued spillover effects of rising global energy costs.
Market sentiment shifted in favor of safe-haven assets as Iran retaliated against the US attack near Bandar Abbas airport, targeting its military bases in the Gulf region. The US Dollar Index, which tracks the dollar against six major currencies, rose 0.3%, slightly above 99.50. The Australian dollar/US dollar pair is currently trading sharply lower, around 0.7100. The pair is bearish in the short term, as it remains below its 20-day simple moving average (0.7183). Furthermore, a head and shoulders (H&S) pattern supports the bearish bias. The Relative Strength Index (RSI) is near 45, indicating weak momentum rather than oversold conditions, suggesting sellers still have the upper hand. On the downside, a break below the neckline of the H&S pattern around 0.7070 could trigger a new round of declines. Key support areas are at 0.7050 and near the April 13 low of 0.6990. On the upside, the 20-day simple moving average at 0.7183 is the first resistance level the bulls need to break to alleviate immediate downward pressure and pave the way for a more sustained rally to 0.7200.
Consider going long on the Australian dollar today at 0.7150, with a stop loss at 0.7140 and targets at 0.7200 and 0.7210.
GBP/USD
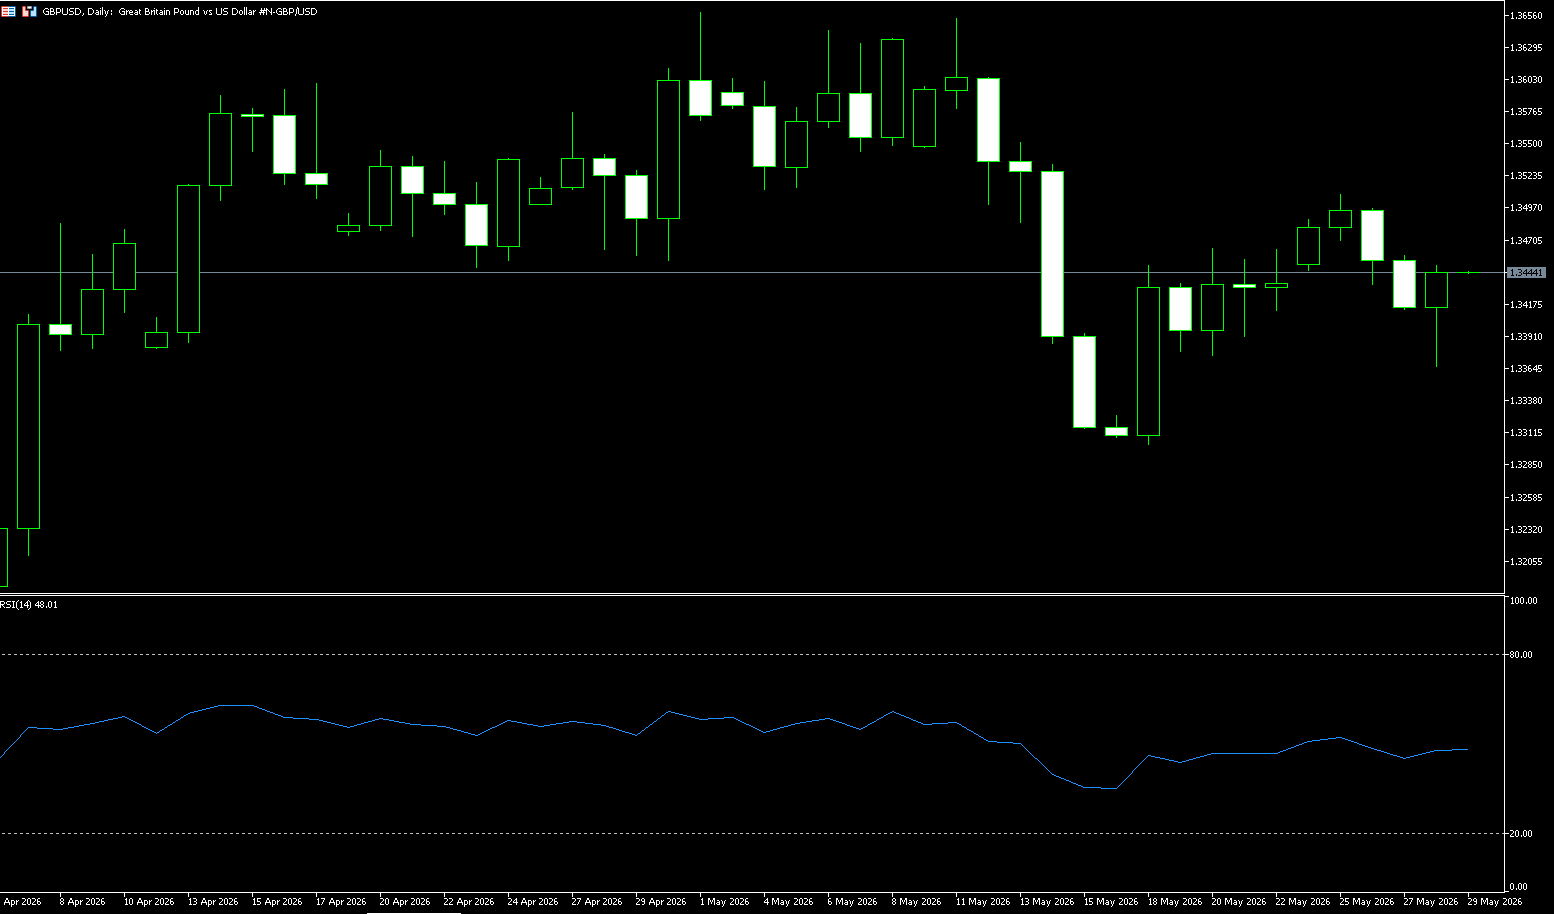
The GBP/USD pair attracted some bargain hunting during Wednesday's Asian session, halting the previous day's pullback from near two-week highs, just above the psychological level of 1.3500. Spot prices are currently trading around the mid-1.3400 range, although upside appears limited amid continued geopolitical uncertainty. The latest US attack on Iran has dampened hopes for an impending agreement to end the three-month-long Middle East conflict. Iran's foreign ministry condemned the US attack, saying it violated the ceasefire agreement that had been in effect since early April. Furthermore, the Islamic Revolutionary Guard Corps (IRGC) has threatened retaliation, and the geopolitical risk premium persists. These factors, coupled with hawkish expectations from the Federal Reserve, are likely to continue to drive the safe-haven dollar and limit the gains of the GBP/USD pair. In addition, political turmoil in the UK and increasing calls for Prime Minister Keir Starmer's resignation, in the absence of relevant market-driven macroeconomic data from either the UK or the US, have also prompted investors to remain cautious about further appreciation of the GBP/USD pair.
GBP/USD is trading around 1.3440. The pair continues its rebound, approaching the 5-day simple moving average at 1.3453, indicating a slightly constructive short-term trend. A broader downtrend resistance line, broken at around 1.3612, remains limiting the upside of the medium-term structure, while the Relative Strength Index (RSI) (14) is around 49, suggesting neutral momentum after the recent rebound from the lows. On the downside, the May 22 low of 1.3413 is a key support level. A daily close below this level would expose further downside risk, targeting the May 20 low of 1.3375. The upside resistance is initially defined by the breakout area of the downtrend line around 1.3612. Only a clear break above this resistance would indicate sufficient bullish momentum to push prices further up to 1.3700.
Today, consider going long on GBP at 1.3430, with a stop-loss at 1.3420 and targets at 1.3480 and 1.3490.
USD/JPY
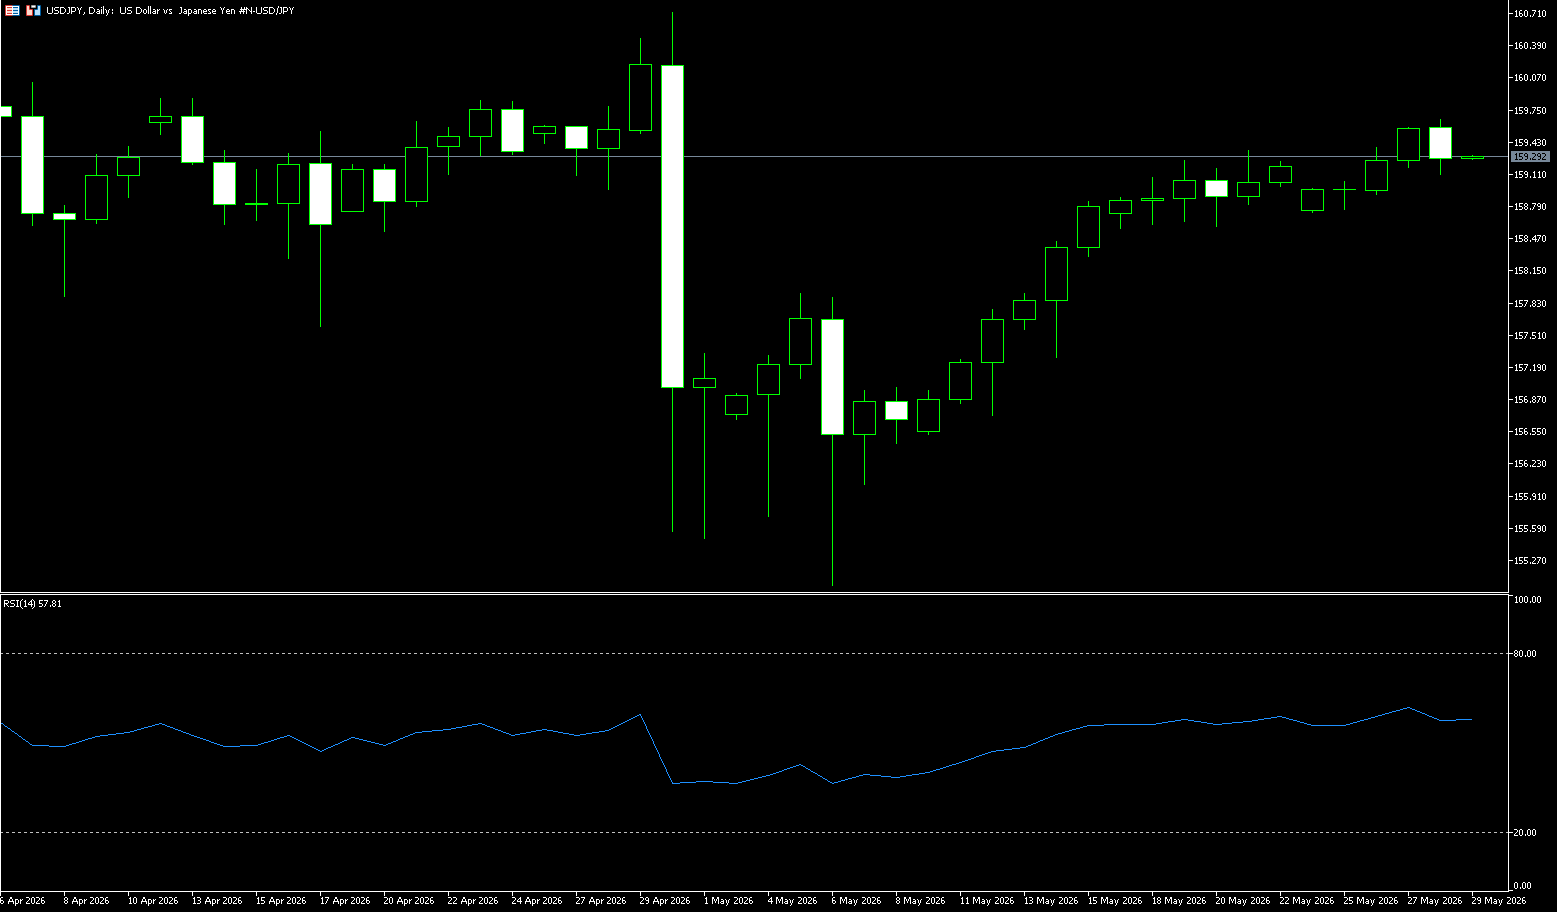
USD/JPY fell below 159 against the dollar on Wednesday, hovering near a one-month high, after Bank of Japan Governor Kazuo Ueda warned of escalating inflation risks but did not hint at a possible rate hike at the next monetary policy meeting. Ueda emphasized the need to closely monitor the impact of rising oil prices on Japan's underlying inflation trend, although he offered little guidance on how these pressures would affect next month's policy decision. Meanwhile, Bank of Japan Deputy Governor Ryozo Himeno reiterated the central bank's commitment to further interest rate hikes, emphasizing that the timing and pace will depend on the impact of the Middle East conflict on Japan's economic and inflation prospects. Investors also continue to focus on developments in the Middle East, as signs of progress on the US-North Korea-Iran agreement have been overshadowed by renewed hostilities, making the overall outlook more uncertain.
The dollar traded at 159.40 against the yen, having recovered about two-thirds of the ground lost after the suspected intervention on April 30. Momentum indicators are neutral to bullish. The 14-day Relative Strength Index (RSI) has begun to rise above the key 55 level. The Moving Average Convergence Divergence (MACD) indicator remains slightly negative but is close to zero. Bulls may encounter significant resistance around Wednesday's high of 159.60, followed by the 160.00 level, which is considered the trigger point for Tokyo's intervention. A break above this level would shift focus to the April 30 high of 160.72. Initial support lies in the 158.65-158.75 range, an area that supported the pair last week. A break below this area would entice bears to attack the previous resistance zone near 158.00, and subsequently challenge the May 14 low of 157.30.
Consider shorting the US dollar today at 159.40, with a stop loss at 159.60 and targets at 158.50 and 158.40.
EUR/USD
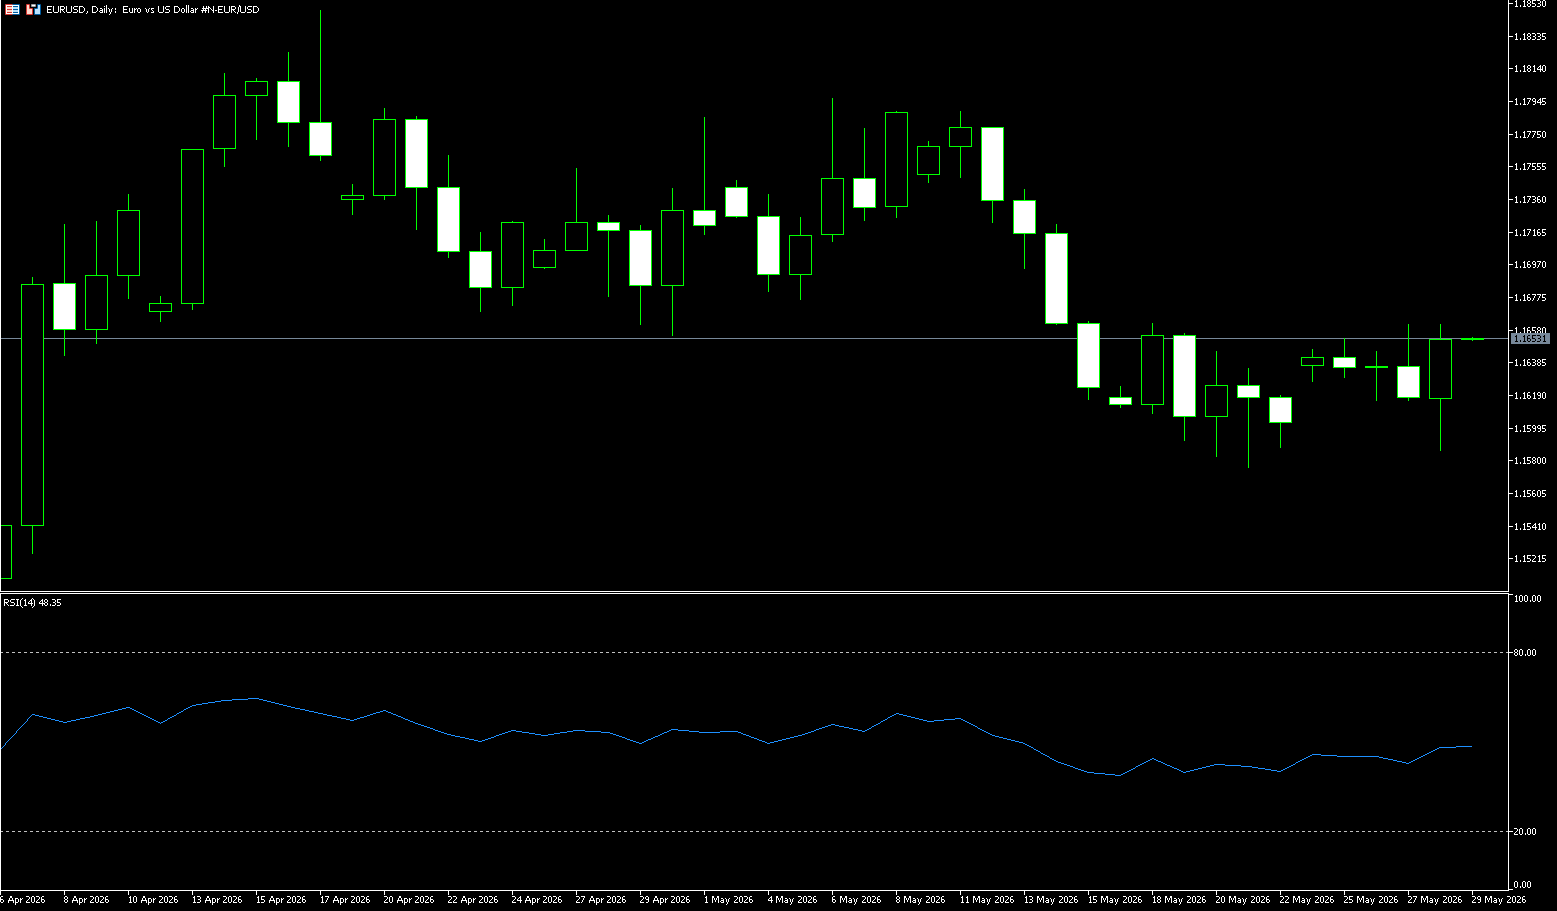
On Wednesday, EUR/USD was flat around 1.1650. However, renewed tensions in the Middle East following Iran's threat of retaliation for attacks on US launch sites and ships could limit upside for the major currency pair. Tensions between Washington and Tehran have escalated again after US President Trump stated that negotiations with Iran to extend the ceasefire and reopen key waterways are underway. Uncertainty and signs of ongoing conflict in the Middle East could boost safe-haven currencies like the US dollar and put downward pressure on the major pair. On the other hand, hawkish comments from the European Central Bank could support the euro. European Central Bank (ECB) policymaker François Villeroy de Gallo said on Tuesday that the central bank "will take the necessary measures" to maintain its inflation target. ECB Governing Council member Isabelle Schnabel noted that even if a peace agreement is reached with Iran, the central bank should raise interest rates in June, as the conflict has lasted far longer than expected and high energy prices are impacting the broader economy.
From a technical perspective, the euro/dollar exchange rate is holding above the 23.6% Fibonacci retracement level of the April-May decline. Furthermore, the Relative Strength Index (RSI) is around 48, and the Moving Average Convergence Divergence (MACD) is slightly positive, suggesting improved momentum. This, in turn, supports further intraday appreciation, although hawkish bets from the Federal Reserve may limit dollar losses and suppress spot prices. Therefore, any subsequent gains are more likely to encounter immediate resistance near the Fibonacci retracement level, around the 1.1675-1.1680 area. Next is the confluence point at 1.1710, which includes the 200-period simple moving average and the 50% retracement level on the 4-hour chart. This area should limit the short-term bias, and a break above it could see EUR/USD target the 61.8% retracement level around 1.1740. On the downside, immediate support is at 1.1600 (psychological support level); deeper support lies at 1.1577 (lower Bollinger Band) and the 1.1500 area. A break below this level would reopen a broader bearish phase.
Consider going long EUR/USD today at 1.1640, with a stop loss at 1.1630 and targets at 1.1690 and 1.1680.
Disclaimer: The information contained herein (1) is proprietary to BCR and/or its content providers; (2) may not be copied or distributed; (3) is not warranted to be accurate, complete or timely; and, (4) does not constitute advice or a recommendation by BCR or its content providers in respect of the investment in financial instruments. Neither BCR or its content providers are responsible for any damages or losses arising from any use of this information. Past performance is no guarantee of future results.
More Coverage






Risk Disclosure:Derivatives are traded over-the-counter on margin, which means they carry a high level of risk and there is a possibility you could lose all of your investment. These products are not suitable for all investors. Please ensure you fully understand the risks and carefully consider your financial situation and trading experience before trading. Seek independent financial advice if necessary before opening an account with BCR.
BCR Co Pty Ltd (Company No. 1975046) is a company incorporated under the laws of the British Virgin Islands, with its registered office at Trident Chambers, Wickham’s Cay 1, Road Town, Tortola, British Virgin Islands, and is licensed and regulated by the British Virgin Islands Financial Services Commission under License No. SIBA/L/19/1122.
Open Bridge Limited (Company No. 16701394) is a company incorporated under the Companies Act 2006 and registered in England and Wales, with its registered address at Kemp House, 160 City Road, London, City Road, London, England, EC1V 2NX. This entity acts solely as a payment processor and does not provide any trading or investment services.


 English
 简体中文
简体中文
 繁體中文
繁體中文
 Bahasa
Melayu
Bahasa
Melayu
 Tiếng
Việt
Tiếng
Việt
 ไทย
ไทย
 日本語
日本語
 한국어
한국어
 ភាសាខ្មែរ
 español