


0
US Dollar Index
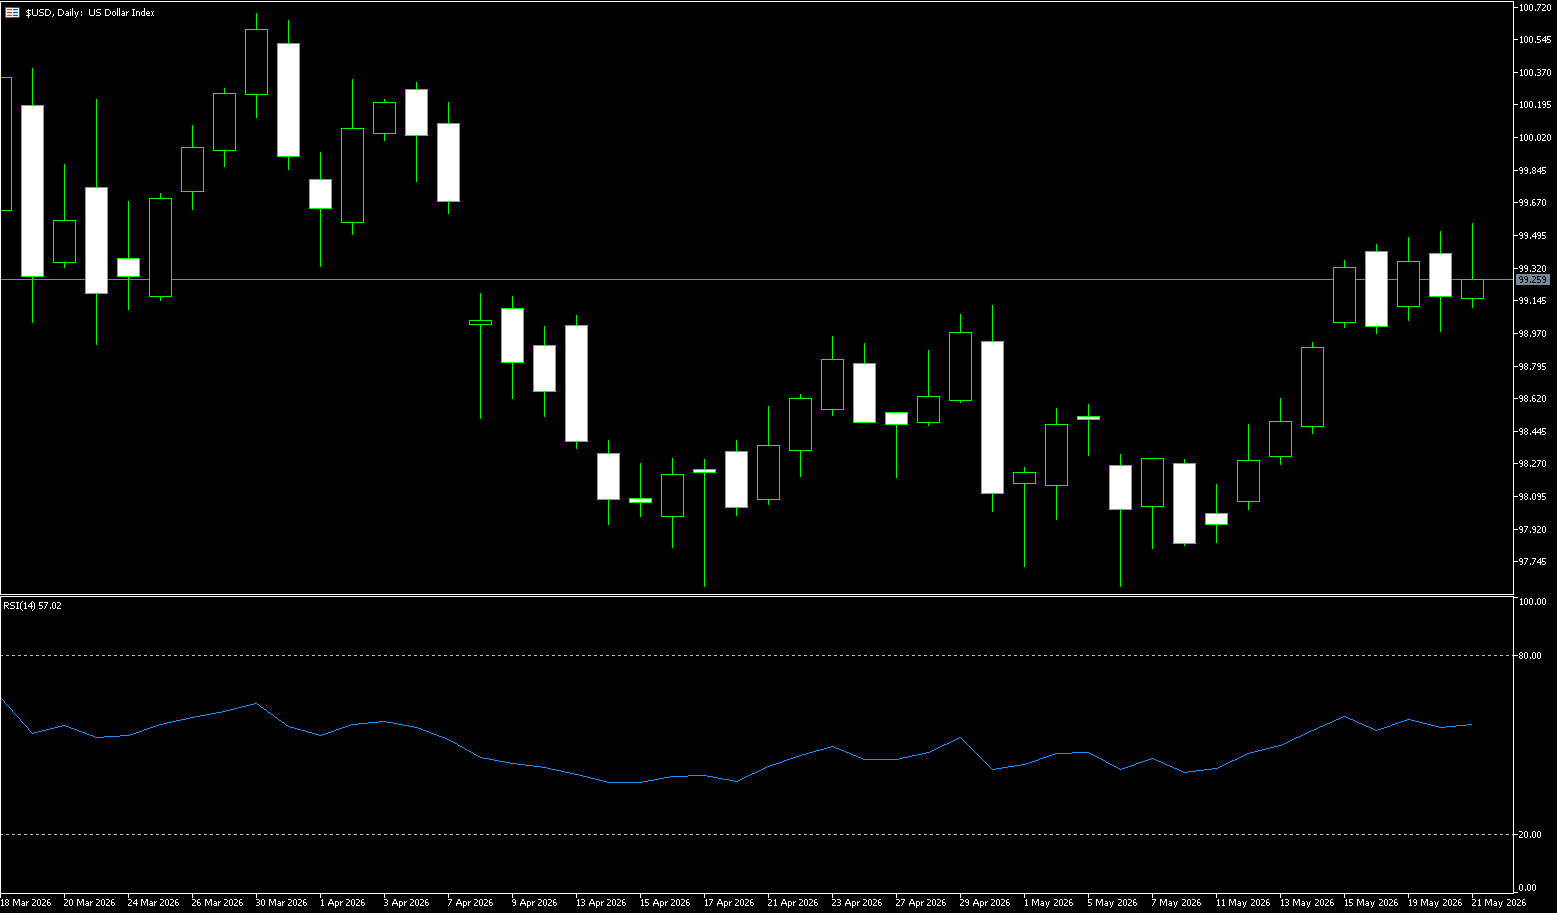
The US dollar index fell to around 99.15 on Thursday, retreating to a six-week high, as optimism surrounding a potential peace deal between the US and Iran eased concerns about inflation and interest rate hikes, while reducing safe-haven demand for the dollar. President Trump stated that negotiations between the US and Iran had entered the final stage, boosting expectations that the strategically vital Strait of Hormuz might soon reopen. The prospect of a recovery in shipping traffic triggered a sharp drop in oil prices, helping to alleviate inflationary pressures and reducing market expectations that central banks would need to tighten policy. However, the minutes of the latest Federal Reserve meeting showed that most policymakers believed that another rate hike this year would still be appropriate if inflation remained above the Fed's 2% target. Although the market widely expects the Fed to keep interest rates unchanged for the remainder of the year, traders currently assign about a 50% probability of a rate hike in December.
The daily chart shows that the US dollar index has rebounded steadily after forming a bottom around 96.62, and has now formed a clear upward channel structure. The recent consecutive positive candlesticks indicate that market buying power remains strong. The daily stochastic oscillator (RSI) has entered a high-level zone, but a clear top divergence structure has not yet formed, indicating that although the US dollar faces some overbought pressure in the short term, the overall upward trend has not ended. On the upside, the 99.50 to 100.00 area has become the most critical resistance zone. If the situation in the Middle East continues to deteriorate, and US Treasury yields rise further, the US dollar index may retest the 100 level. On the downside, 98.80 has become the first important support level, while 98.50 is a key short-term defense zone. If the US dollar index breaks below this level, the market may re-enter a period of consolidation.
Today, consider shorting the US dollar index at 99.30, with a stop loss at 99.40 and targets at 98.70 and 98.60.
WTI Crude Oil
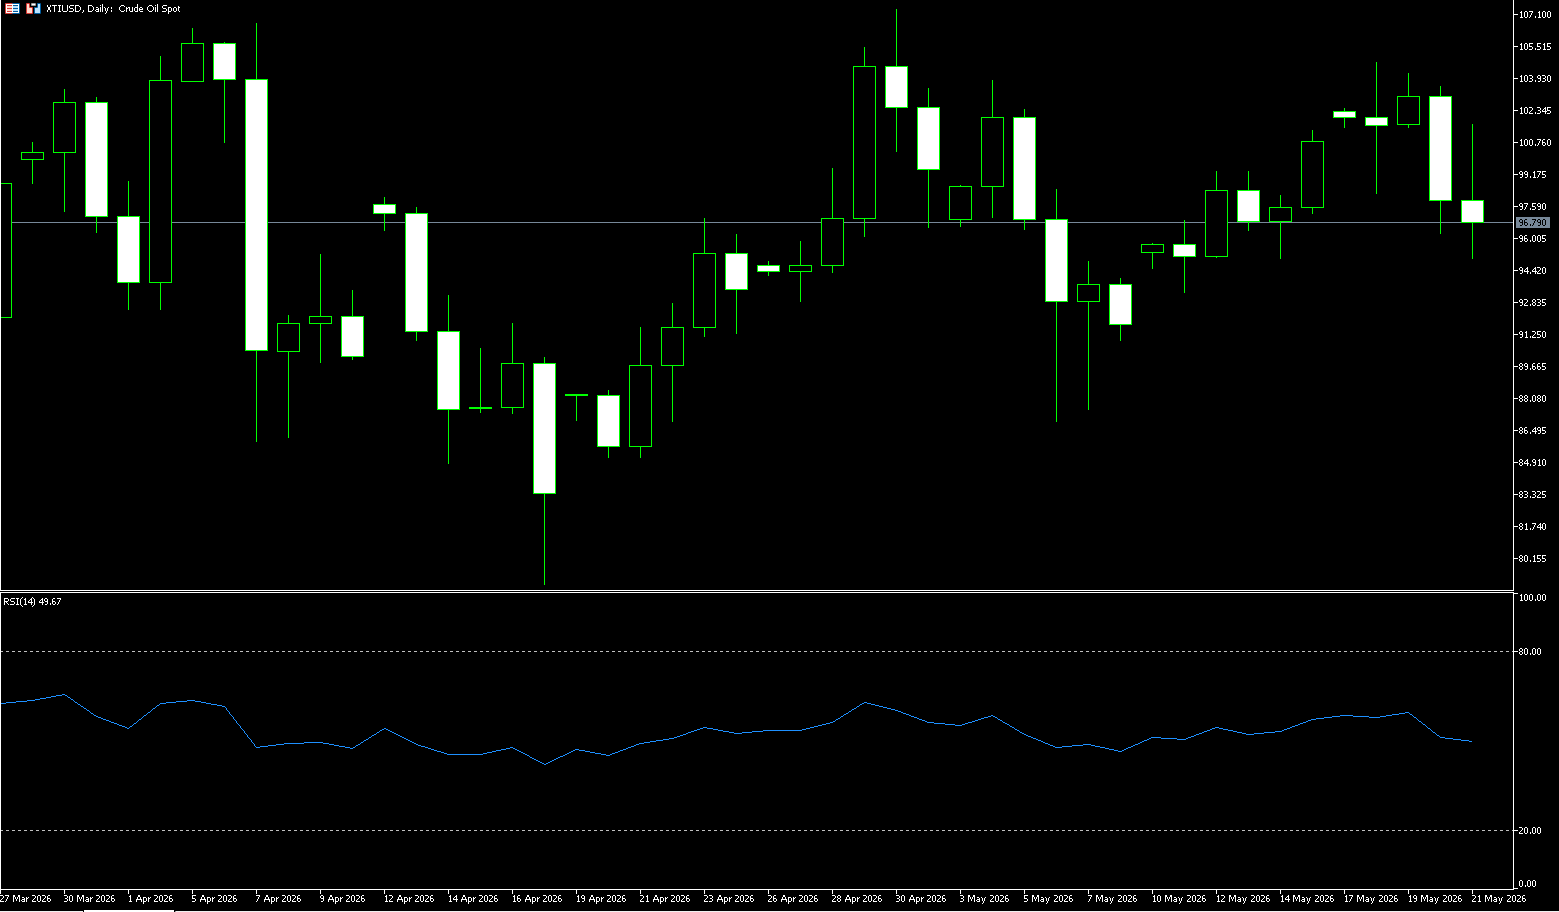
WTI crude oil stabilized at $97 per barrel on Thursday, after falling more than 5% in the previous session. President Trump stated that negotiations between the US and Iran were nearing their final stage, boosting market expectations that Middle Eastern oil supplies might gradually return. Tehran is currently assessing Washington's latest draft response to its 14-point proposal. A potential agreement could lead to the lifting of the maritime blockade on the Strait of Hormuz, which has disrupted tanker traffic since March. Satellite data showing three supertankers transiting the strait further supports supply optimism. However, analysts warn that the global physical oil market may remain tight, given that oil shipped from the Persian Gulf can take nearly two months to reach its final market. Meanwhile, the CEO of Abu Dhabi National Oil Corporation stated that a full recovery of Middle Eastern oil flows is unlikely before the end of 2027.
Technically, WTI crude oil is currently trading at the end of a symmetrical triangle pattern on the daily chart, with the breakout window narrowing further. Fundamentally, the core issue is the geopolitical tensions surrounding Iran, and the market's balance between bulls and bears has been disrupted by the recent sharp drop. On the daily chart, US crude oil remains in a typical symmetrical triangle consolidation pattern. This pattern formed after a pullback from the previous high (around $119-$120), with the upper boundary being a downtrend line and the lower boundary an uptrend line. The lower boundary highly coincides with a key moving average. Prices are oscillating repeatedly between these two trend lines, with volatility gradually narrowing. This pattern aligns closely with the current dual expectations of "peace vs. war" regarding the Iranian situation. Affected by the mid-week plunge, prices are testing the 50-day moving average at $95.60, which also serves as a crucial support level for the lower edge of the triangle. If this level holds, the bullish consolidation pattern can be maintained; however, a break below this level would confirm a downtrend, opening up further downside potential to $90.00. Current resistance levels to watch are $100 (a psychological level) and $104.70 (this week's high).
Today, consider going long on crude oil at 96.75, with a stop-loss at 96.600 and targets at 100.00 and 99.00.
Spot Gold
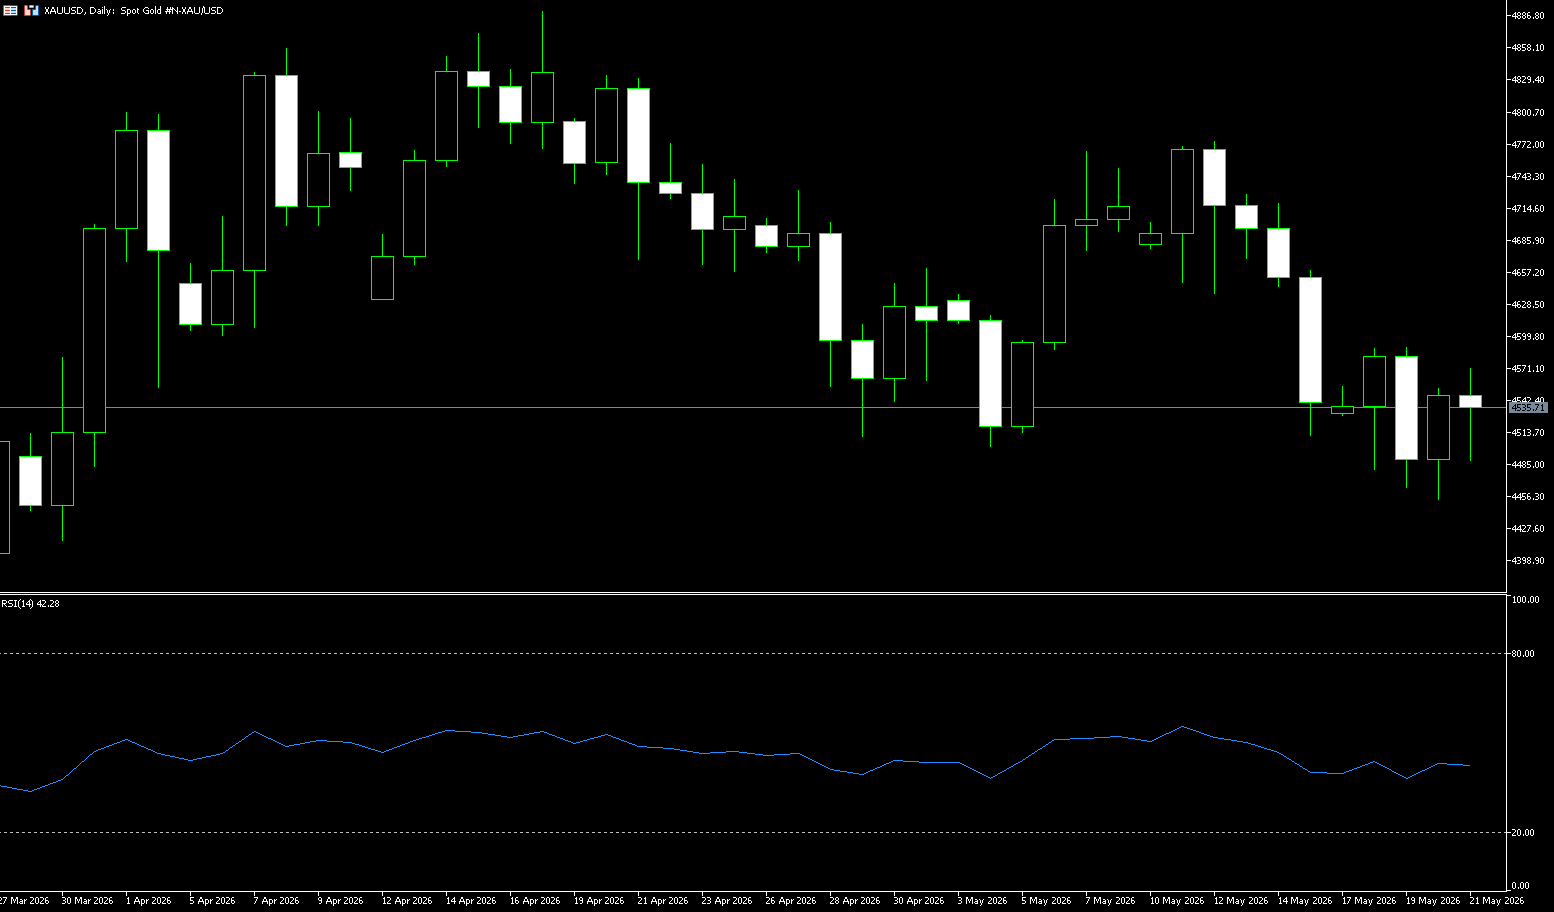
On Thursday, gold prices held above $4,500 per ounce, after rising more than 1% in the previous session, supported by optimism about an impending peace agreement between the US and Iran, which could ease inflationary pressures and reduce concerns about interest rate hikes. President Donald Trump stated that negotiations between the US and Iran had entered the final stage, further fueling expectations that the Strait of Hormuz might soon reopen. The prospect of restored shipping flows triggered a sharp drop in oil prices, helping to alleviate inflation concerns and reducing market expectations that central banks would need to tighten monetary policy. Meanwhile, the minutes of the latest Federal Reserve policy meeting showed that most officials believed that raising interest rates this year would still be reasonable if inflation remained above the Fed's 2% target. Investors are divided on whether the central bank will raise interest rates in December or keep borrowing costs unchanged until the end of the year.
The recent lackluster performance of gold is rooted in several factors. Besides the slow progress of US-Iran peace talks and the potential for another major conflict, the persistently high yields on global government bonds, a key stabilizing factor in global financial markets, are exerting strong downward pressure on gold prices. From a price structure perspective, after breaking below the lower edge of its short-term trading range, the lower Bollinger Band on the daily chart around 4,464.50 has become a key focus. The daily chart shows that the current gold price is approaching the lower Bollinger Band; in the MACD indicator, the DIFF is approximately -48.76, and the DEA is approximately -33.66, with the histogram remaining in negative territory. The technical chart reflects an unrecovered trend momentum, rather than a single day's emotional fluctuation. Therefore, upside potential could be seen at the $4,589.50 (this week's high) and $4,619.50 (the 20-day moving average) area. Downside potential should be seen at the psychological level of $4,500 and the lower Bollinger Band around 4,464.50.
Consider going long on gold today at 4,538, with a stop loss at 4,533 and targets at 4,580 and 4,590.
AUD/USD
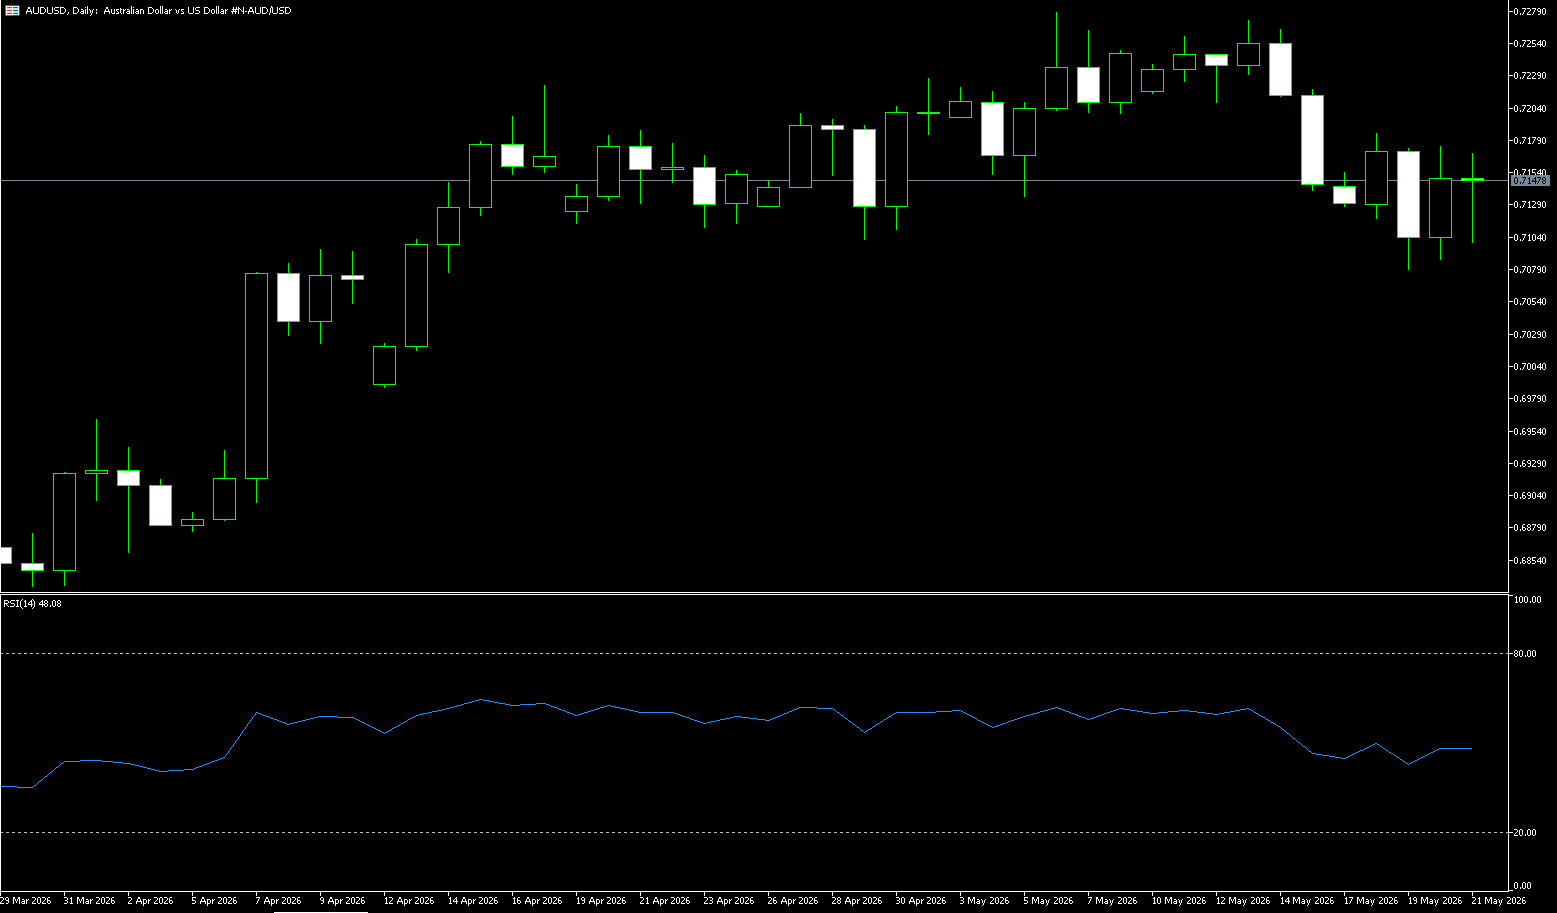
The Australian dollar reversed gains from the previous session before depreciating to around US$0.71 on Thursday, as a surprise rise in the unemployment rate dampened expectations for further interest rate hikes. Australia's seasonally adjusted unemployment rate rose to 4.5% in April 2026, exceeding the March reading and market expectations of 4.3%. The latest data marks the highest unemployment rate since November 2021. Meanwhile, employment fell by 18,600 to 14.74 million in March 2026, failing to meet market expectations of a 17,500 increase and marking the first decline since November. This prompted investors to lower their expectations for the Reserve Bank of Australia to raise the cash rate to 4.6% in June, following three consecutive rate hikes. Further adding to the bearish sentiment was preliminary data showing that the manufacturing Purchasing Managers' Index (PMI) fell to 50.3 in May from 51.3 in April, while the services PMI slipped into contraction territory to 47.7 from 50.7.
The Australian dollar's upward trend appears to have encountered some resistance in the 0.7270-0.7300 range, with AUD/USD still searching for a strong catalyst to extend the rally and challenge yearly highs and higher levels. The Australian dollar quickly shed Monday's optimism, prompting AUD/USD to break below the key 0.7100 support and hit a five-week low of 0.7079. On the daily chart, AUD/USD is trading at 0.7115. The pair remains constructive, as it remains above the 55-day simple moving average at 0.7091. Momentum has cooled somewhat, with the Relative Strength Index (RSI) slipping to around 45 and the Average Directional Index (ADX) hovering around 15, suggesting a temporary pause in directional confidence rather than a complete trend reversal, while prices respect these fundamental support levels. On the downside, initial support lies near the five-week low of 0.7079, followed by initial support near the 50.0% Fibonacci retracement level of 0.7056. If the bearish trend continues, the psychological level of 0.700 will be tested. On the upside, the first major resistance zone begins at 0.7187 (the 20-day moving average), a break above which would expose higher resistance at 0.7200.
Consider going long on the Australian dollar today at 0.7140, with a stop-loss at 0.7130 and targets at 0.7200 and 0.7190.
GBP/USD
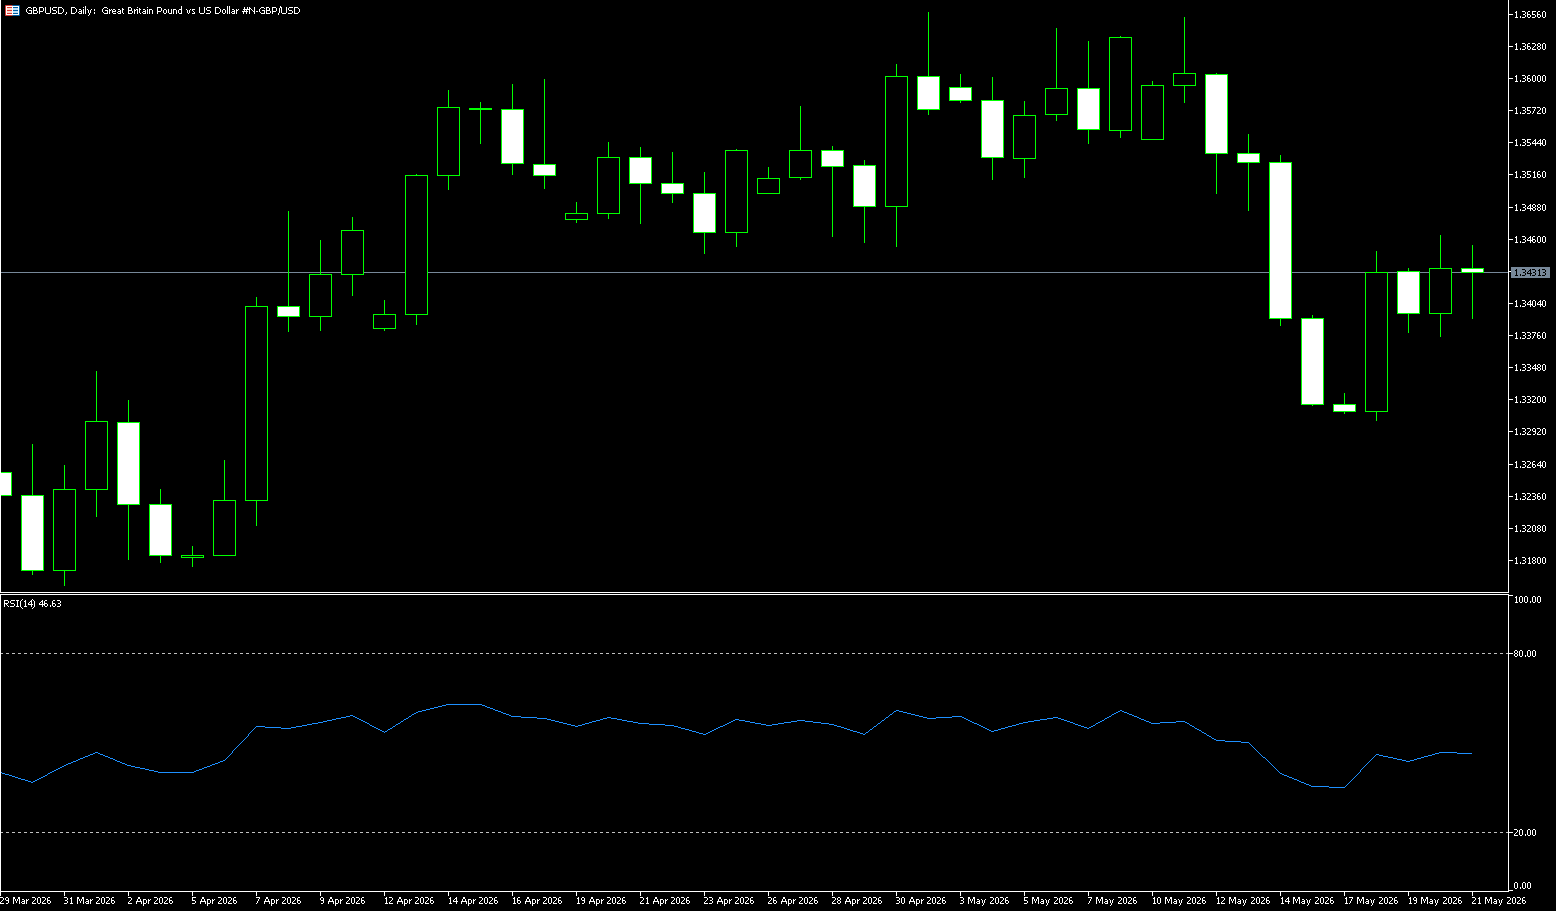
GBP/USD remained around 1.3430 during Thursday's Asian trading session. However, the sharp slowdown in UK inflation and uncertainty surrounding US-Iran negotiations could put pressure on the pound against the dollar. Data released by the UK Office for National Statistics (ONS) on Wednesday showed that the UK's overall Consumer Price Index (CPI) fell to 2.8% year-on-year in April from 3.3% in March, below the expected 3.0%. In addition, core CPI, excluding volatile food and energy items, rose 2.5% year-on-year, lower than the previous 3.1% and market expectations of 2.6%. US President Trump said on Wednesday that negotiations with Iran had entered the final stage, but warned of further attacks unless Iran agrees to an agreement. Continued tensions between the US and Iran may boost the US dollar and pose resistance to the major currency pair in the short term.
Currently, GBP/USD is trading at 1.3430. The pair holds a mild intraday bullish bias, suggesting interest in buying on dips during minor pullbacks. On the daily chart, GBP/USD is near the 65-day simple moving average at 1.3331, and the stochastic RSI has slipped into oversold territory around 22, indicating an overall neutral bias with slight downward fatigue rather than a clear trend. On the upside, initial resistance is at the 35-day simple moving average at 1.3482; a sustained break above this resistance would provide a more constructive tone for the short-term move above 1.3500. On the downside, the 1.3400 level forms the first support; a significant break below this level would expose further weakness, moving towards 1.3348 (the lower Bollinger Band), and then the 1.3300 level.
Today, consider going long on GBP at 1.3420, with a stop loss at 1.3410 and targets at 1.3460 and 1.3480.
USD/JPY
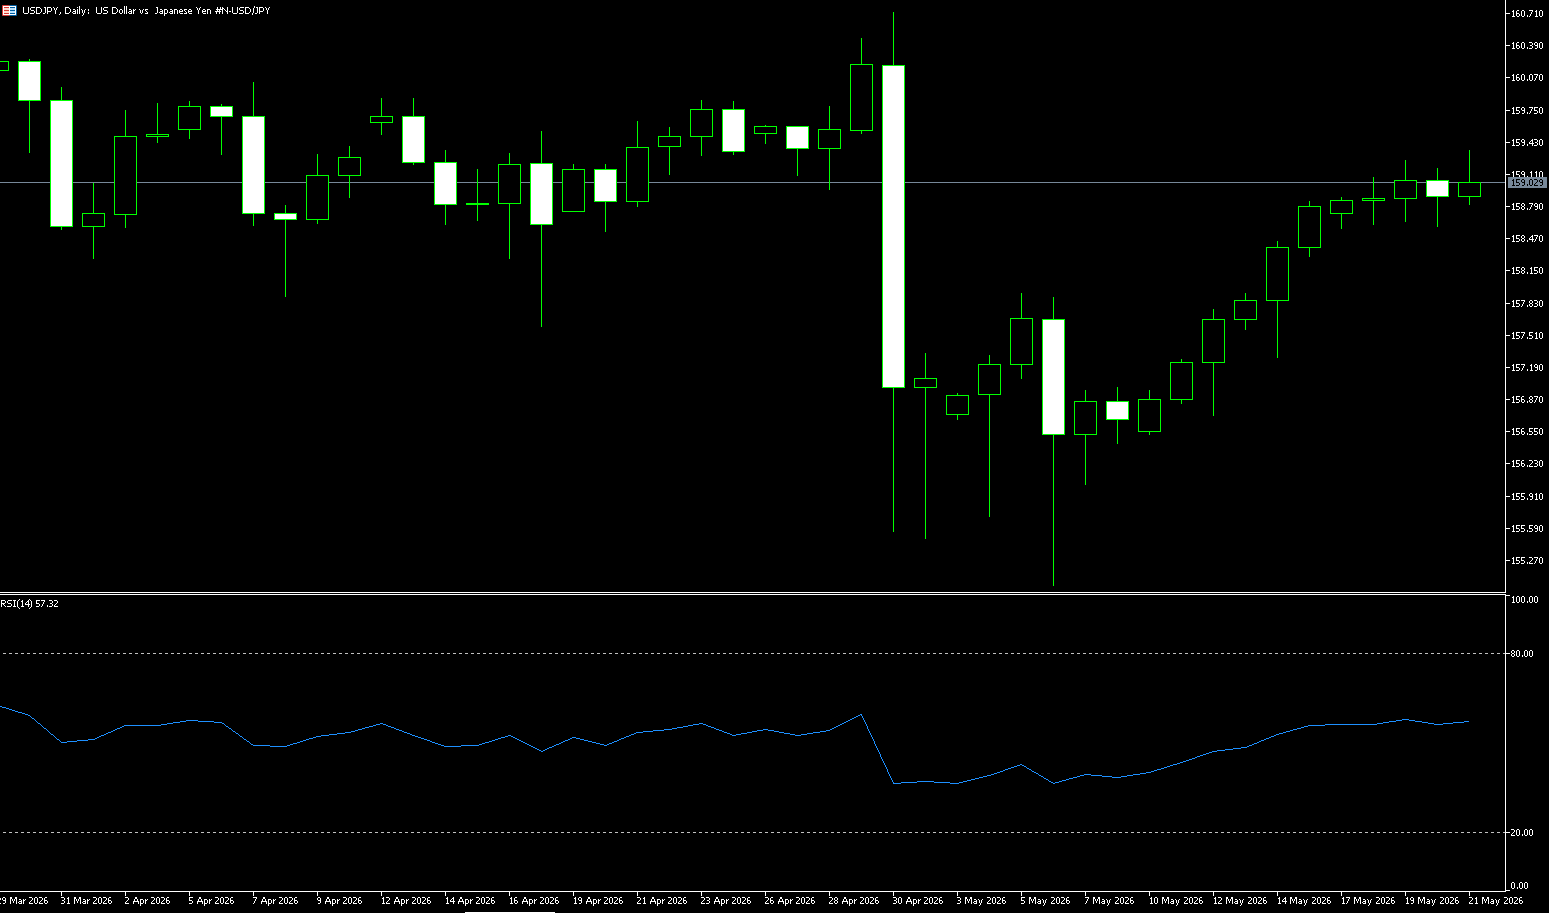
The yen broke through 159 against the dollar on Thursday, ending its recent decline, as oil prices and the dollar weakened, and market optimism grew regarding a potential peace deal between the US and Iran. President Trump stated that negotiations between the US and Iran had entered the final stage, raising expectations that the Strait of Hormuz might soon reopen. Domestically, data showed that Japanese exports rose 14.8% in April, exceeding expectations, thanks to strong demand from China, the US, ASEAN countries, and the EU. Meanwhile, the yen remains near the key 160 level against the dollar, which reportedly prompted Japanese authorities to intervene in late April and early May. Several Tokyo officials recently indicated that policymakers might intervene frequently in the foreign exchange market to stabilize the currency if excessive volatility persists.
While the overall environment for the US dollar may remain supportive, the upside potential for USD/JPY may be limited due to the increased risk of further intervention by the Japanese Ministry of Finance. Japanese officials have consistently warned the market of possible further action—authorities have intervened at least twice since April 30. Therefore, the possibility of further intervention to push the yen significantly stronger against other currencies cannot be ruled out, which would be detrimental to USD/JPY, even if the dollar strengthens overall. USD/JPY closed higher for the seventh consecutive trading day, marking its longest winning streak since June 2024. The daily RSI has also hovered in overbought territory for several trading days, indicating limited upside potential and even a possible pullback. There is still a possibility that USD/JPY will test 160 or even higher, around 160.73 (the high of April 30). However, the market remains generally cautious around the 160 level. If the Japanese Ministry of Finance takes substantial intervention, the USD/JPY pair could quickly fall back to the 100-day simple moving average at 157.54, or even the psychological level of 157.
Consider shorting the USD at 159.20 today, with a stop loss at 159.35 and targets at 158.40 and 158.30.
EUR/USD
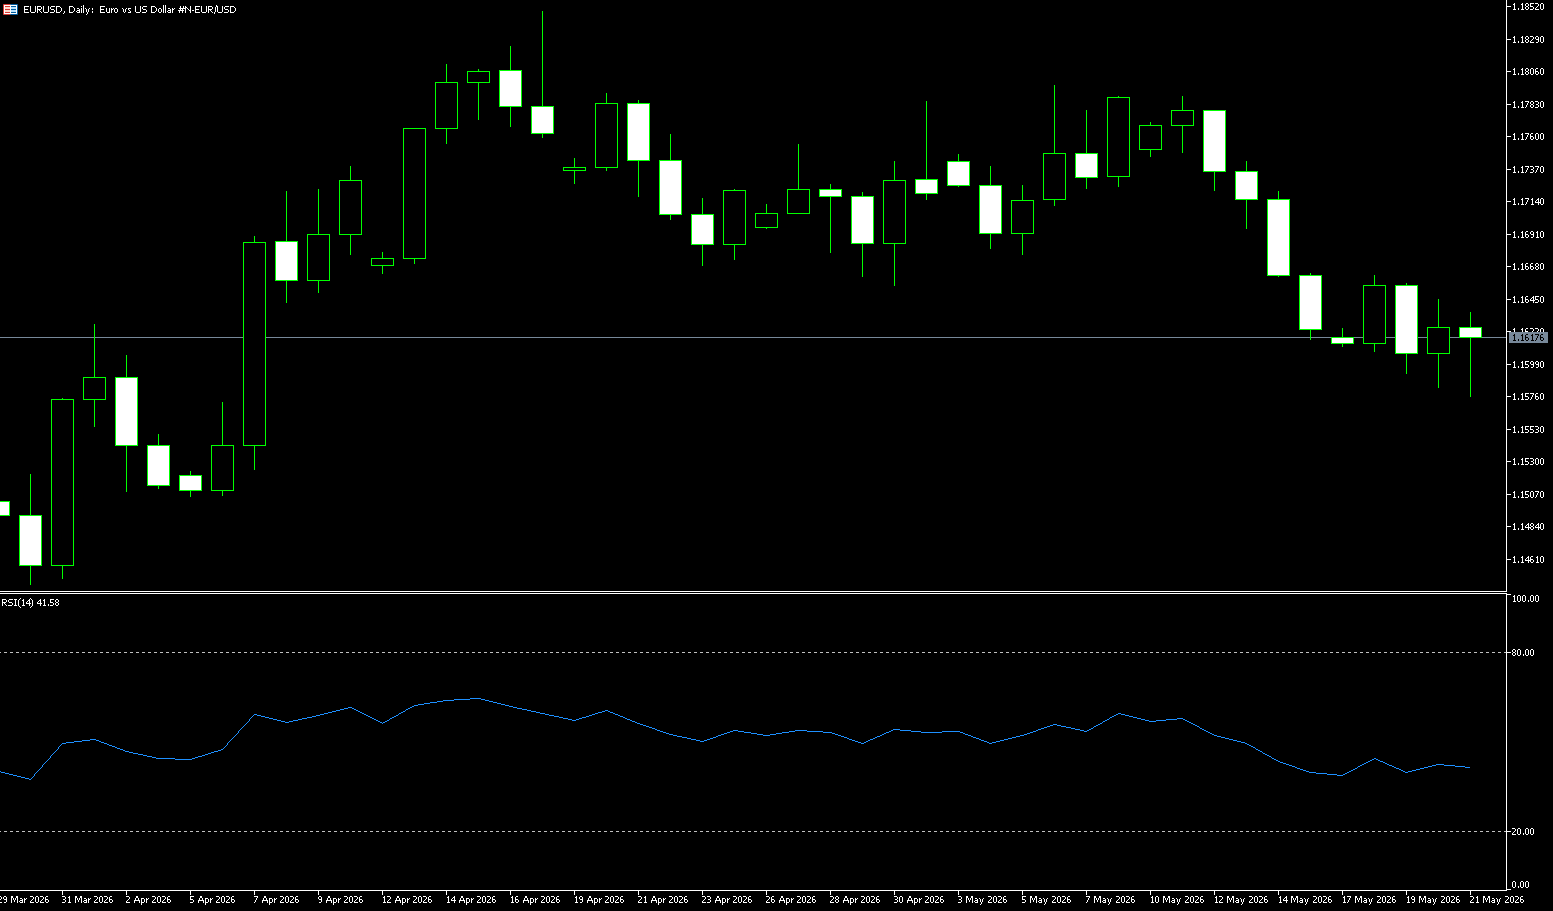
The EUR/USD pair traded flat around 1.1620 in early Asian trading on Thursday. The potential upside for this major currency pair may be limited as uncertainty surrounding US-Iran negotiations could boost safe-haven assets. US President Donald Trump said on Wednesday that negotiations with Iran had entered the final stage, while warning of further attacks unless Iran agrees to a deal. Meanwhile, Iranian President Masoud Pezeshkian stated that Tehran was not on the verge of capitulation and threatened retaliation beyond the Middle East for any strikes. Signs of escalating US-Iran tensions could boost safe-haven currencies like the USD and put resistance on this major currency pair. Across the Atlantic, a Reuters poll showed that about 85% of economists expect the European Central Bank to raise its deposit rate by 25 basis points to 2.25% in June, up from just over half of the expectations before the April meeting.
The dollar saw its biggest gain in two weeks in mid-May, causing the euro/dollar to briefly fall below 1.1600, its lowest level in over a month. The pair held near that level at Friday's close, suggesting further downside potential in the coming days. Markets appear to have roused from recent weakness, with trading activity significantly increasing across all financial sectors. The euro traded around 1.1620 against the dollar, exhibiting a short-term bearish pattern as long as the spot price remains below the recent low of 1.1682. The pair's failure to hold this dynamic resistance level indicates that the rebound was still sold off to the 1.1600 level after the double-top pattern formed below 1.1660 was broken. Above, the 65-day moving average at 1.1658 is the first resistance level the bulls need to reclaim to alleviate immediate selling pressure and open the door for a deeper corrective rebound towards the high of 1.1700.
Today, consider going long on the Euro at 1.1607, with a stop loss at 1.1600 and targets at 1.1660 and 1.1650.
Disclaimer: The information contained herein (1) is proprietary to BCR and/or its content providers; (2) may not be copied or distributed; (3) is not warranted to be accurate, complete or timely; and, (4) does not constitute advice or a recommendation by BCR or its content providers in respect of the investment in financial instruments. Neither BCR or its content providers are responsible for any damages or losses arising from any use of this information. Past performance is no guarantee of future results.
More Coverage


Risk Disclosure:Derivatives are traded over-the-counter on margin, which means they carry a high level of risk and there is a possibility you could lose all of your investment. These products are not suitable for all investors. Please ensure you fully understand the risks and carefully consider your financial situation and trading experience before trading. Seek independent financial advice if necessary before opening an account with BCR.
BCR Co Pty Ltd (Company No. 1975046) is a company incorporated under the laws of the British Virgin Islands, with its registered office at Trident Chambers, Wickham’s Cay 1, Road Town, Tortola, British Virgin Islands, and is licensed and regulated by the British Virgin Islands Financial Services Commission under License No. SIBA/L/19/1122.
Open Bridge Limited (Company No. 16701394) is a company incorporated under the Companies Act 2006 and registered in England and Wales, with its registered address at Kemp House, 160 City Road, London, City Road, London, England, EC1V 2NX. This entity acts solely as a payment processor and does not provide any trading or investment services.

 English
 简体中文
简体中文
 繁體中文
繁體中文
 Bahasa
Melayu
Bahasa
Melayu
 Tiếng
Việt
Tiếng
Việt
 ไทย
ไทย
 日本語
日本語
 한국어
한국어
 ភាសាខ្មែរ
 español

