


0
Currency & Commodity Analysis:
US Dollar Index
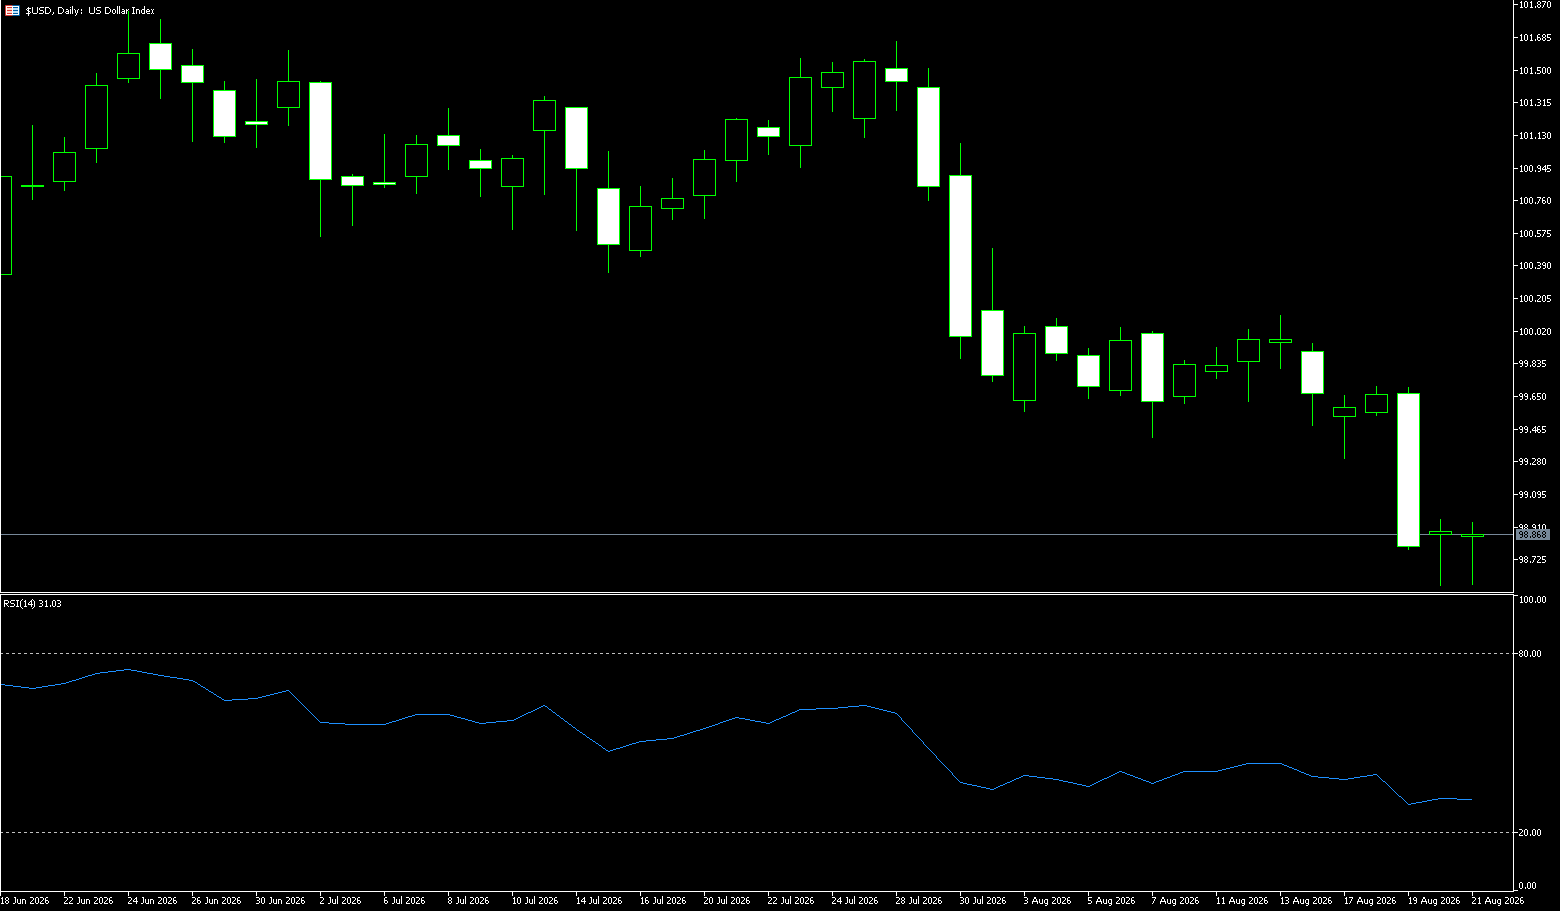
The US dollar index fell to a three-month low near 98.56 last week as the US government twice expanded its bond buyback program to control long-term borrowing costs. The U.S. Treasury Department announced it will at least double the size of its liquidity support repurchase operations covering securities with maturities of 10 to 30 years, as a recent surge in yields has exacerbated concerns about market liquidity and stability. This move indicates the Treasury is prepared to take a more active role in the bond market to limit long-term yields, potentially improving dollar liquidity in the global financial system. Meanwhile, the minutes of the Federal Reserve's July meeting confirmed that some policymakers favor raising interest rates this year to prevent stronger inflationary pressures in the future. Elsewhere, increased uncertainty in the Middle East and the ongoing stalemate between the U.S. and Iran have heightened concerns about inflation risks.
Last Tuesday, the U.S. Treasury announced it would increase its long-term bond repurchase operations, sending two clear signals. First, the recent surge in long-term yields to more than two-decade highs has reached a critical point that the U.S. can no longer afford. Second, and much more important, is that the U.S. has no intention of addressing the root cause—fiscal policy has spiraled out of control and there is an urgent need to reduce the fiscal deficit. Instead, yesterday's announcement was merely a financial tool to mask the escalating pressure on the U.S. Treasury market. In fact, the clearest signal to date suggests that the U.S. is repeating Japan's mistakes and embarking on a path of currency devaluation. When fiscal policy spirals out of control, while governments can certainly use various means to suppress yields, this puts downward pressure on the domestic currency because the market cannot obtain the risk premium it desires. What should have been a debt crisis thus evolved into a currency crisis, the root cause of the yen's sustained weakening over the years.
Last week, the US dollar index exhibited a pattern of breaking through resistance levels, falling sharply, and then consolidating at low levels. It bottomed out at 98.56, a low since mid-May. Before the weekend, it found buying support between 98.50 and 98.60. Simultaneously, investors assessed the geopolitical risks in the Strait of Hormuz while digesting the continued sell-off in the bond market, leaving the dollar lacking a clear direction and entering a period of low-level consolidation. Technical indicators: The daily Stoch-RSI has fallen to around 18, entering oversold territory, but has not yet formed a clear golden cross reversal signal; it is a bottoming process after oversold conditions, not a confirmed bottom. The 50-day moving average has fallen above 100, and the 200-EMA is at 99.75, with the moving average system turning into a resistance level. Looking ahead to next week's technical outlook, bears remain in control, resulting in a rapid and sharp decline. However, technical indicators show that the daily Stoch-RSI has fallen back to around 18, entering oversold territory, but a clear golden cross reversal signal has not yet formed. This indicates a bottoming process after oversold conditions, not a confirmed bottom. The 50-day moving average has fallen above 100, and the 200-EMA is at 99.75, with the moving average system turning to suppress prices. Short-term moving averages are in a bearish alignment. However, a short-term technical rebound cannot be ruled out. Key technical levels for next week: Resistance – First resistance: 99.00 (short-term support/resistance level, the level broken this week); Strong resistance: 99.75-99.80 (200-day EMA, important medium-term resistance); Support – First support: 98.56 (bottom of the weekend's consolidation); Extreme downside target: 98.00 (May low, key medium-term defense). Next Week's Outlook – Two Scenario Analysis: Bearish Baseline Scenario: If the rebound fails to hold above 99.00, the US dollar will maintain its weak trend, testing 98.50. If the daily chart breaks below 98.50, it will further challenge the key support level of 98.00. Rebound Correction Scenario: If the US dollar rises above 99.00, the rebound target is 99.75-99.80. Only a daily close above 99.80 will reverse the short-term bearish structure and retest the 100 level.
Today, consider shorting the US Dollar Index at 98.95, with a stop-loss at 99.05 and targets at 98.50 and 98.40.
WTI Crude Oil
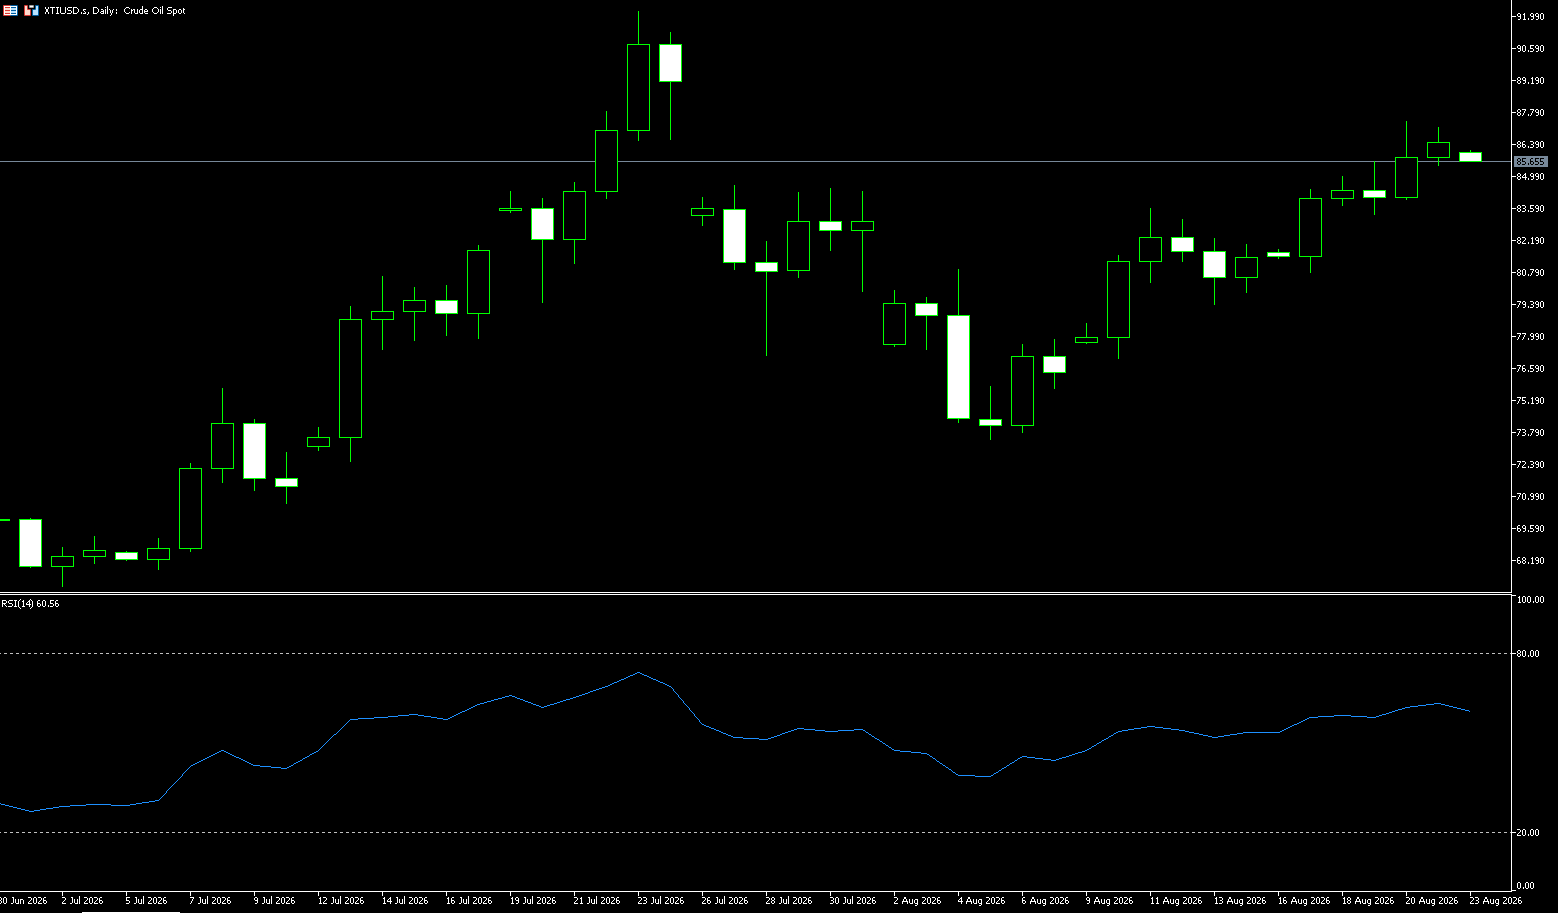
Last week, international crude oil prices rose strongly, with WTI crude oil surging nearly 6% for the week! On Friday, crude oil prices traded above $86 per barrel, and are expected to rise for the second consecutive week, up nearly 6% so far this week. This increase is due to the continued tensions between the US and Iran, with both sides locked in a stalemate over the Strait of Hormuz. The United States is taking steps to isolate the Iranian economy, which President Trump has described as an "economic D-Day," with details of the plans expected to be released on Monday. The proposed measures may aim to sever Tehran's ties with international financial and commercial channels, including banks, businesses, shipping registers, cash transfers, and smuggling networks. Washington's goal is to increase economic pressure on Iran, forcing Tehran to negotiate on the conflict, its nuclear program, and control of the Strait of Hormuz. Elsewhere, Ukraine's series of attacks on Russian energy infrastructure has led to fuel shortages in some regions, further increasing pressure on global oil markets.
Today, global markets were driven by two main themes: Middle East geopolitics and shipping security, and a weakening dollar resulting from US Treasury liquidity operations. In the short term, the Gulf of Aden hostage crisis, Qatar's mediation signals, and fluctuations in US Treasury yields and the dollar are likely to trigger high-frequency volatility, especially during the Asian/European opening sessions. Oil prices are highly sensitive to any signals regarding air traffic control or diplomatic relations, while gold and silver are supported by a weak dollar. In the longer term, if the restrictions imposed by the Strait of Hormuz persist, expectations of declining global inventories could further increase the risk premium for oil prices, leading to market discussions about a potential move to higher levels. If the dollar remains weak, precious metals may remain relatively strong. Tail risks include a complete standstill in the Strait of Hormuz, a failed mediation leading to military escalation, and the spread of the Gulf of Aden conflict. Geopolitical developments over the weekend warrant close attention.
Last week, WTI crude oil was driven by Middle East geopolitical risk premiums, generally trending upwards. Oil prices rose from the $82-$83 range, reaching a high of $87.37, and are currently consolidating around $86. Weekly chart: The weekly candlestick closed with a large bullish candle, stabilizing above multiple medium-term moving averages, indicating a shift from a previous pullback to a rebound pattern. However, the price is approaching a previous resistance zone, and bullish momentum has weakened, resulting in an upper shadow and the accumulation of profit-taking at higher levels. Daily chart: The price has stabilized above the 61.8% Fibonacci retracement level of the July-August decline at $85.02, with all medium-term moving averages turning upwards, indicating a bullish overall structure. The RSI has entered a high-level range, showing signs of bearish divergence, indicating a slowdown in the upward momentum and a period of consolidation at higher levels, without any unilateral acceleration. Market characteristics: Geopolitical news dominates volatility; positive news leads to rallies, while easing news results in rapid pullbacks, increasing volatility and worsening the risk-reward ratio for chasing rallies.
From a technical perspective, WTI crude oil previously broke through $80 and quickly extended upwards, but has now pulled back to levels before $80, meaning that $80 has transformed from a psychological barrier into a short-term battleground between bulls and bears. From a medium-term perspective, oil prices have previously broken through important moving averages and the resistance of the recent downtrend, showing a significant improvement in their technical pattern. However, the recent continuous decline indicates that upward momentum is weakening. If the daily chart can regain a foothold near $82.50, the next potential test is $85 and $87. A decisive break above $85 could open up further upside potential in the medium term. Conversely, if the daily chart continues to close below $78.86 (the 9-day moving average) and $80.00 (a psychological level), caution is warranted as this rebound may enter a deeper correction, with the next support level to watch being the $76.07 (200-day moving average) area. The technical improvement following WTI's break above the 200-day moving average was a crucial foundation for this upward move. The $83.75 (75-day moving average) level forms the first resistance zone, while the area around $86.54 (100-day moving average) represents a higher-level target.
Today, consider going long on crude oil at 86.18, with a stop loss at 86.00 and targets at 89.00 and 88.00.
Spot Gold
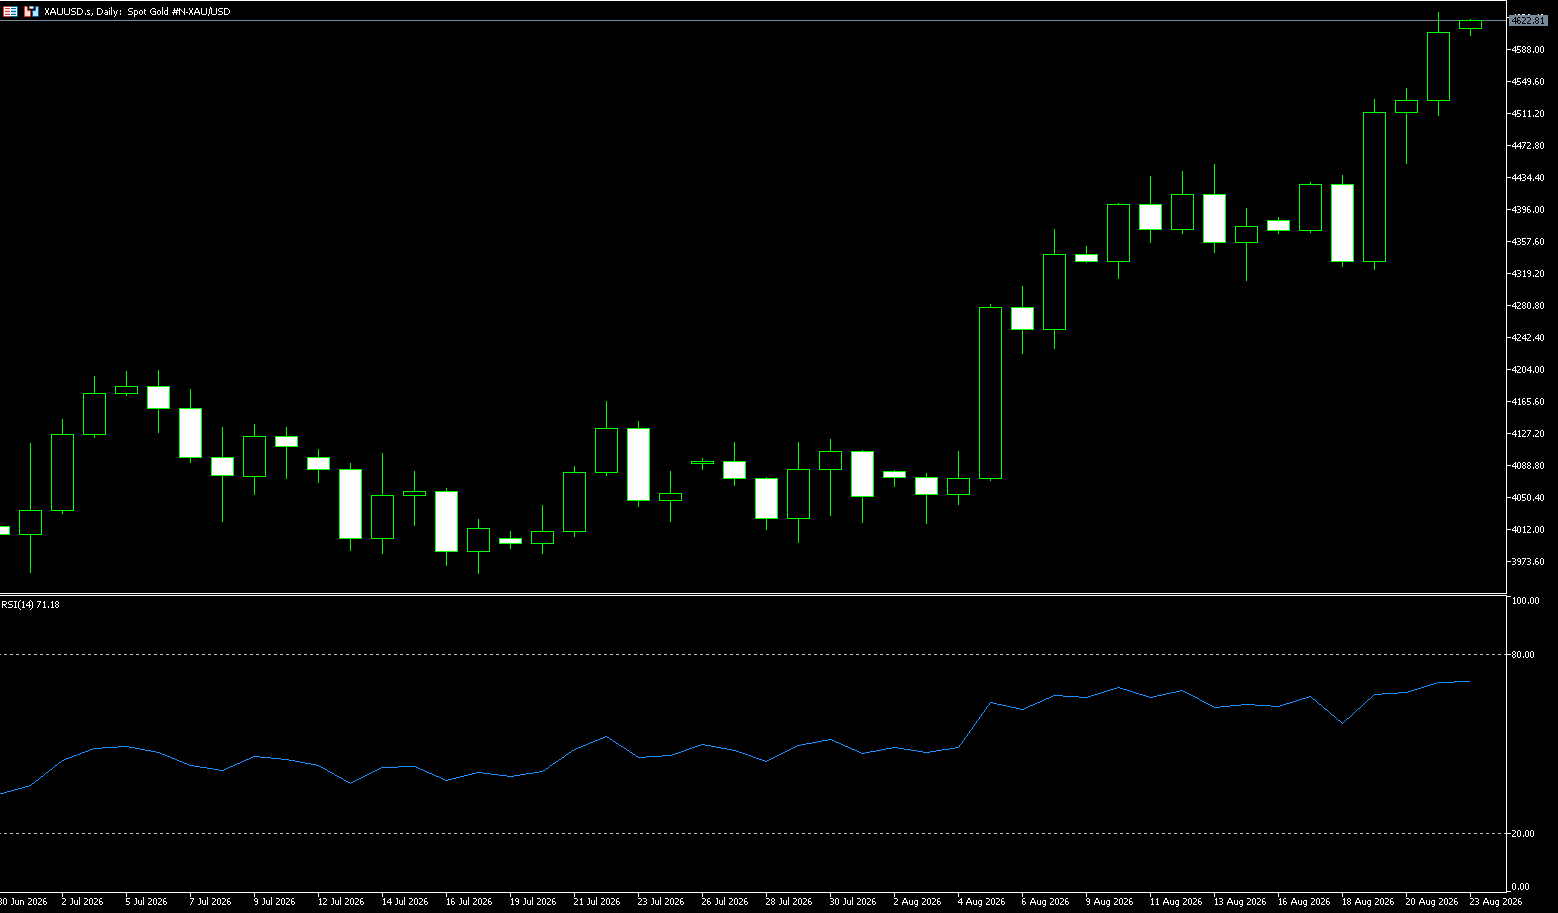
Last week, gold prices surpassed $4,600 per ounce and are on track for a third consecutive week of gains as investors turned to the safe-haven metal amid heightened volatility in currency and bond markets, while rising oil prices continued to highlight inflation risks. Precious metal prices surged more than 4% on Wednesday after the US Treasury announced plans to at least double its long-term debt buyback program to control borrowing costs, causing a sharp drop in Treasury yields and the dollar. Market concerns lingered that the government's efforts to control long-term borrowing costs might only be a temporary solution. Meanwhile, oil prices continued to rise as the US prepared to impose comprehensive new economic sanctions on Iran. Elsewhere, gold remained supported by strong investment demand and continued central bank purchases, particularly from China.
Gold prices are caught in a tug-of-war between Treasury buyback intervention and geopolitical risks of inflation, and are expected to continue trading in a range at high levels in the short term. The market is digesting expectations of a "devaluation trade" and uncertainty surrounding Federal Reserve policy, while high oil prices and debt concerns are laying the foundation for a long-term bull market, with investment banks already bullish on the $5,000 mark. Gold, which surged over 4% mid-week after the US Treasury suddenly announced an increase in its long-term Treasury bond buyback program, gradually recovered its losses after Treasury Secretary Bessant reiterated that the buyback program could exceed $4 billion, reaching a high of $4,600 during the session, a new high in over three months. Behind the seemingly calm closing price lies a fierce struggle between inflation concerns and expectations of declining real interest rates, as well as a deep interplay of multiple forces including fiscal intervention, monetary policy independence, and geopolitical conflicts.
Last week, gold experienced a volatile bottoming-out process followed by a significant event-driven rally, closing with a large bullish candle on the weekly chart, indicating overall bullish dominance, but short-term prices have entered overbought territory. The US Treasury's announcement of expanding its long-term bond buyback program led to a decline in long-term US Treasury yields and a weakening dollar, triggering a rapid surge in gold prices, with a single-day increase of over $100. The daily moving averages are in a bullish alignment, with the 5/10/20-day moving averages all trending upwards, and gold prices are trading near the Bollinger Band. The MACD histogram is expanding, but the RSI has entered overbought territory, indicating significant short-term profit-taking and a potential technical pullback. Chasing the price higher is not advisable. On the weekly chart: a large bullish candlestick has broken above multiple weekly moving averages, indicating a bullish medium-term trend. However, the price is approaching a historical resistance zone, suggesting increased volatility after the initial surge.
Next Week's Technical Outlook: The overall long-term bullish structure remains intact, but short-term overbought conditions suggest a period of consolidation to digest profit-taking. The likely scenario is a pullback to confirm support before choosing a direction, although a pullback followed by further upward movement is possible. The daily chart shows spot gold holding above the 50-day and 100-day moving averages, confirming a clear short-term bullish trend. Currently, gold prices have surged to $4,600, directly challenging the key resistance level of the Bollinger Band at $4,633. The price has broken above this level, but a valid daily close has not yet confirmed this. Upside: If the daily close holds above the 200-day moving average of $4,514.50, gold prices will open up upward potential, with the next target at the $4,633 (Bolligate Upper Bollinger Band) resistance and the $4,750 level. Downside resistance: The first support level is the 200-day moving average at $4,514.50, followed by the $4,450 level (last Thursday's low).
Today, consider going long on gold at $4,598, with a stop-loss at $4,594 and targets of $4,650 and $4,660.
AUD/USD
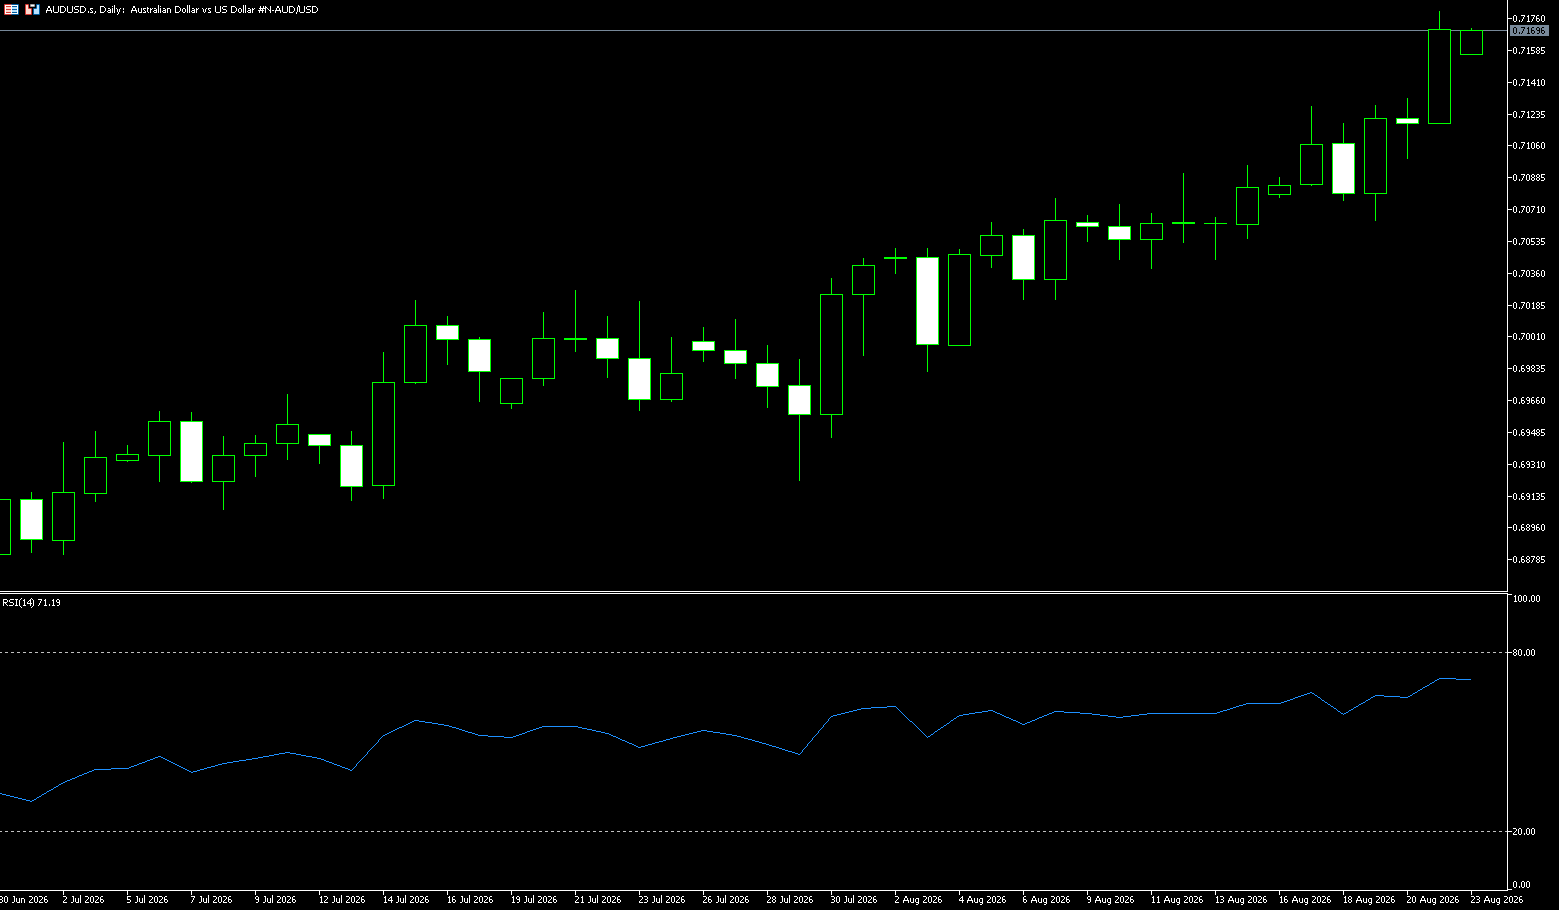
The AUD/USD pair regained upward momentum after a slight decline the previous day due to weak Australian employment data, climbing to a new high since early June in the first half of the European session. Spot prices are currently trading slightly below 0.7200 and are still on track for a seventh consecutive week of gains, supported by fundamentals. The Australian dollar rose above US$0.71, reaching its highest level in eleven weeks and marking its eighth consecutive week of gains, its longest weekly rally since 2020, as the US dollar weakened broadly. The dollar came under pressure as an unexpected repurchase program in the US fiscal markets failed to quell the bond market. Investors questioned whether this intervention could provide lasting relief to high long-term borrowing costs, leading to a rebound in US Treasury yields and exacerbating concerns about the country's widening fiscal deficit and heavy debt burden. The weaker dollar largely offset the pressure from weak Australian labor data, which showed a decline in employment in June and an unemployment rate that climbed to a near five-year high of 4.5%. However, the data was not considered weak enough to completely eliminate market expectations of further tightening by the Reserve Bank of Australia. The market is implying only a 13% chance of a rate hike to 4.6% next month, but an expectation of around 68% by February next year.
Federal Reserve Chair Mohammed Mussaleem delivered a speech last week consistent with established baselines and historical averages, projecting a stable, moderately hawkish stance. The speech emphasized strong growth, accommodative financial conditions, underlying inflation hovering around 2.5%-3%, and the possibility that raising rates now might prevent more aggressive action later, all highlighting upside risks to inflation. At the same time, Mussaleem stressed the Fed's credibility and the independence of its policy from fiscal pressures. His acknowledgment of potential new supply shocks, such as a "super El Niño," and credit squeezes in parts of the economy added to the risk-aware tone, somewhat softening the hawkish bias, but overall still leaning towards preventative tightening rather than complacency.
Last week, the Australian dollar continued its upward trend against the US dollar, which began at 0.6880 at the end of June, reaching a high of 0.7180 during the week, a new high in nearly 11 weeks, closing higher overall. The weekly chart is on track for its fourth consecutive weekly gain. The Australian dollar has held above the 100-day moving average of 0.7069 and the Bollinger Bands average of 0.6993 against the US dollar, maintaining its upward trend. The RSI (14) is trading in the 67-70 range, nearing overbought but not yet severely overbought. The MACD is above the zero line, but the upward momentum is weakening, with several attempts to break higher resulting in upper shadow candlesticks, indicating selling pressure. The weakening US dollar was the main driver last week, with weak US retail sales and US Treasury repurchase agreements suppressing yields and reducing expectations of a Fed rate hike. Australian employment data and hawkish comments from the Reserve Bank of Australia provided support, but internal data was limited, and the exchange rate largely followed the dollar's movements.
Next week's technical outlook on the daily chart: The Australian dollar/US dollar pair maintains a short-term bullish bias as it holds above the 100-day simple moving average of 0.7069 and the Bollinger Bands average of 0.7053. The currency pair is approaching the Bollinger Band's upper bound at 0.7049, indicating that the recent upward trend may extend further. Meanwhile, key technical levels are: First resistance: 0.7200-0.7223 (psychological level; May 5th high); Second resistance: 0.7273-0.7300 (May 13th high; psychological level). A successful break above this range would open up further upside potential. Support levels are: First support: 0.7069-0.7090 (100-day moving average, short-term bullish support); Second support: 0.7053-0.7055 (Bollinger Band midline, medium-term strength/weakness dividing line). A break below this level would invalidate the current upward structure and lead to a deeper correction.
Consider going long on the Australian dollar at 0.7160 today, with a stop loss at 0.7150 and targets at 0.7195 and 0.7210.
GBP/USD
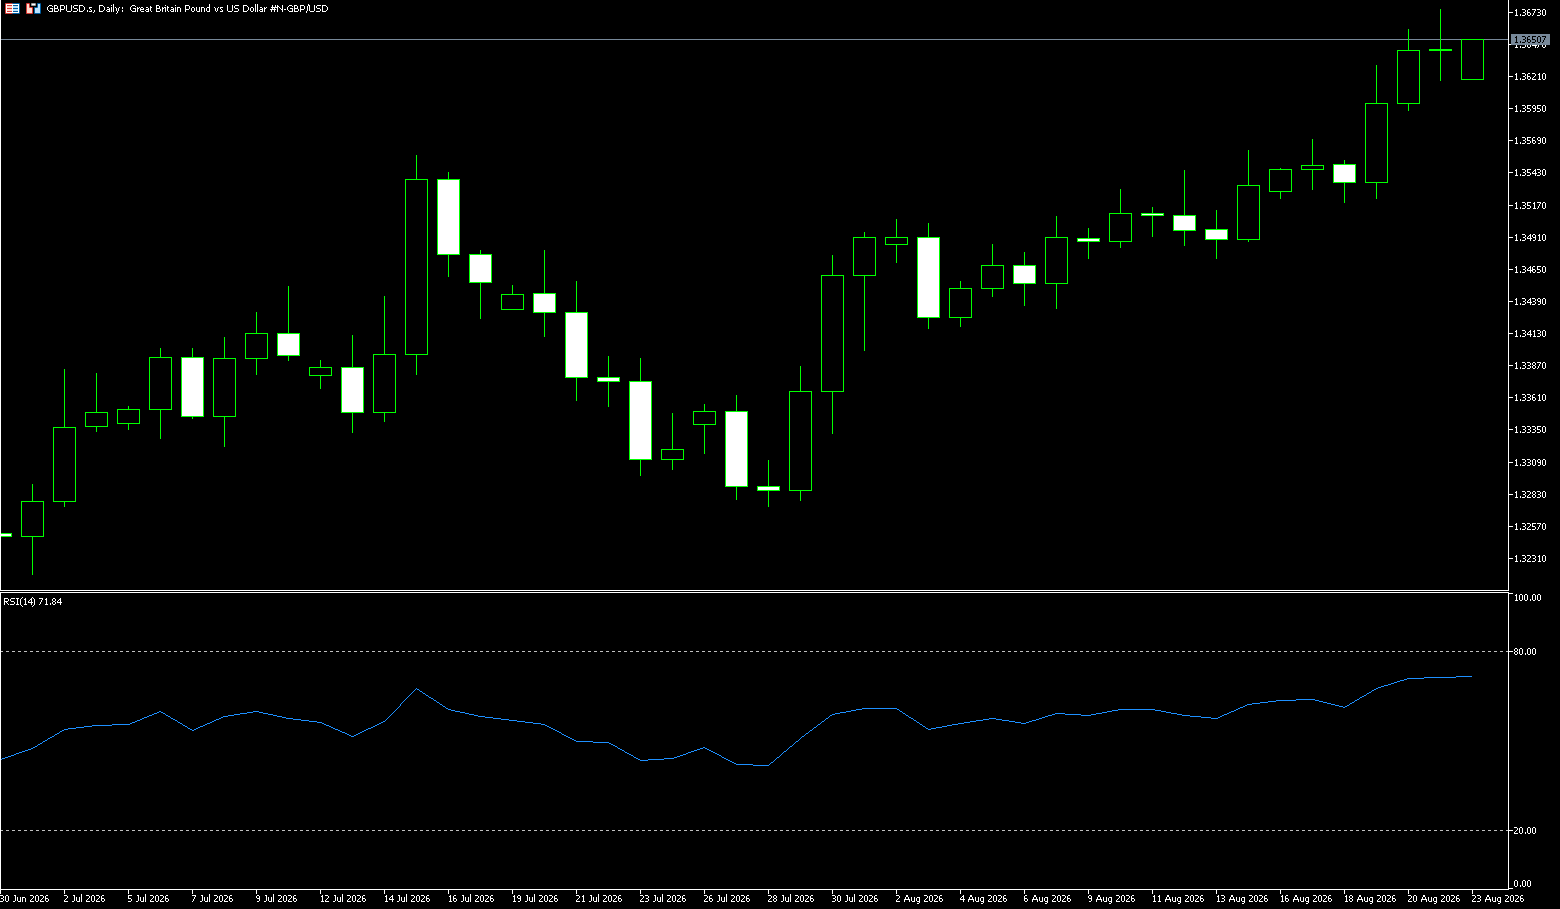
The pound rose above 1.3650 against the dollar last week, reaching its highest level in six months, as a weaker dollar boosted major currencies. The pound benefited from a sharp drop in the dollar after the US Treasury unexpectedly announced plans to at least double its purchases of long-term Treasury bonds. This move aims to support liquidity and control high long-term borrowing costs, thus driving up G10 currencies across the board. Domestic factors also supported the pound, with UK inflation remaining relatively high, reinforcing expectations of tighter monetary policy. Consumer price inflation accelerated to its highest level in four months in July, although recent labor market data suggested a cooling in employment. The market continues to expect the Bank of England to raise interest rates once before the end of this year, with another quarter-point hike expected to be fully priced in by April next year.
The pound surged to a six-month high against the dollar, boosted by stronger-than-expected UK business activity data, while the dollar remained under pressure following the US Treasury's plan to increase bond buybacks. GBP/USD broke above 1.3660 for the first time since February and was trading above 1.3670 at the time of writing. Earlier in the week, data from the Office for National Statistics showed that UK retail sales fell 0.5% month-on-month in July, in line with market expectations, following a 0.7% increase in June. Year-on-year, sales growth was 1.6%, lower than June's 3.8% and also below the market consensus of 2.2%. Furthermore, net borrowing by the UK public sector increased by £1.8 billion in July, lower than June's £12.78 billion but higher than the market expectation of £300 million.
The pound continued its upward trend against the dollar last week, hitting a new high in nearly six months. It started rising from around 1.3520 and reached a high of 1.3675 during the week, mainly trading between 1.3516 and 1.3675. Weekly chart: A medium-sized bullish candlestick closed, holding above the 50 and 200-period moving averages, indicating a healthy medium-term bullish structure. However, the daily RSI has risen to around 70, entering slightly overbought territory, suggesting potential short-term pullback pressure. Daily chart: The price continues to trade near the upper Bollinger Band, with the MACD remaining above the zero line in bullish territory and rising lows. However, it has repeatedly encountered resistance in the 1.3650-1.3670 resistance zone, experiencing significant selling pressure and entering a high-level consolidation phase after the initial surge.
Technical Outlook for Next Week; Core Judgment: The medium-term overall structure remains bullish, but the daily chart is overbought. Next week, we expect consolidation at higher levels, with two possible scenarios: 1. Continued Bullish Scenario: A strong break above 1.3670 with significant volume would open up further upside potential, with the next target at the 1.3730-1.3780 range; 2. Corrective Pullback Scenario: Failure to break 1.3670 and a subsequent drop below 1.3600 would trigger profit-taking, leading to a retest of the key support level at 1.3500. If 1.3500 is breached, the current short-term uptrend will weaken, with a further decline towards 1.3430-1.3450. Regarding key support and resistance levels: First resistance: 1.3700-1.3714 (psychological level; May 12 high); Second resistance: 1.3751-1.3800 (May 11 high support: psychological level); First support: 1.3600-1.3594 (psychological level; last Wednesday's low); Second strong support: 1.3526-1.3500 (14-day moving average; psychological level).
Consider going long on GBP/USD at 1.3655 today, with a stop loss at 1.3645 and targets at 1.3690 and 1.3700.
USD/JPY
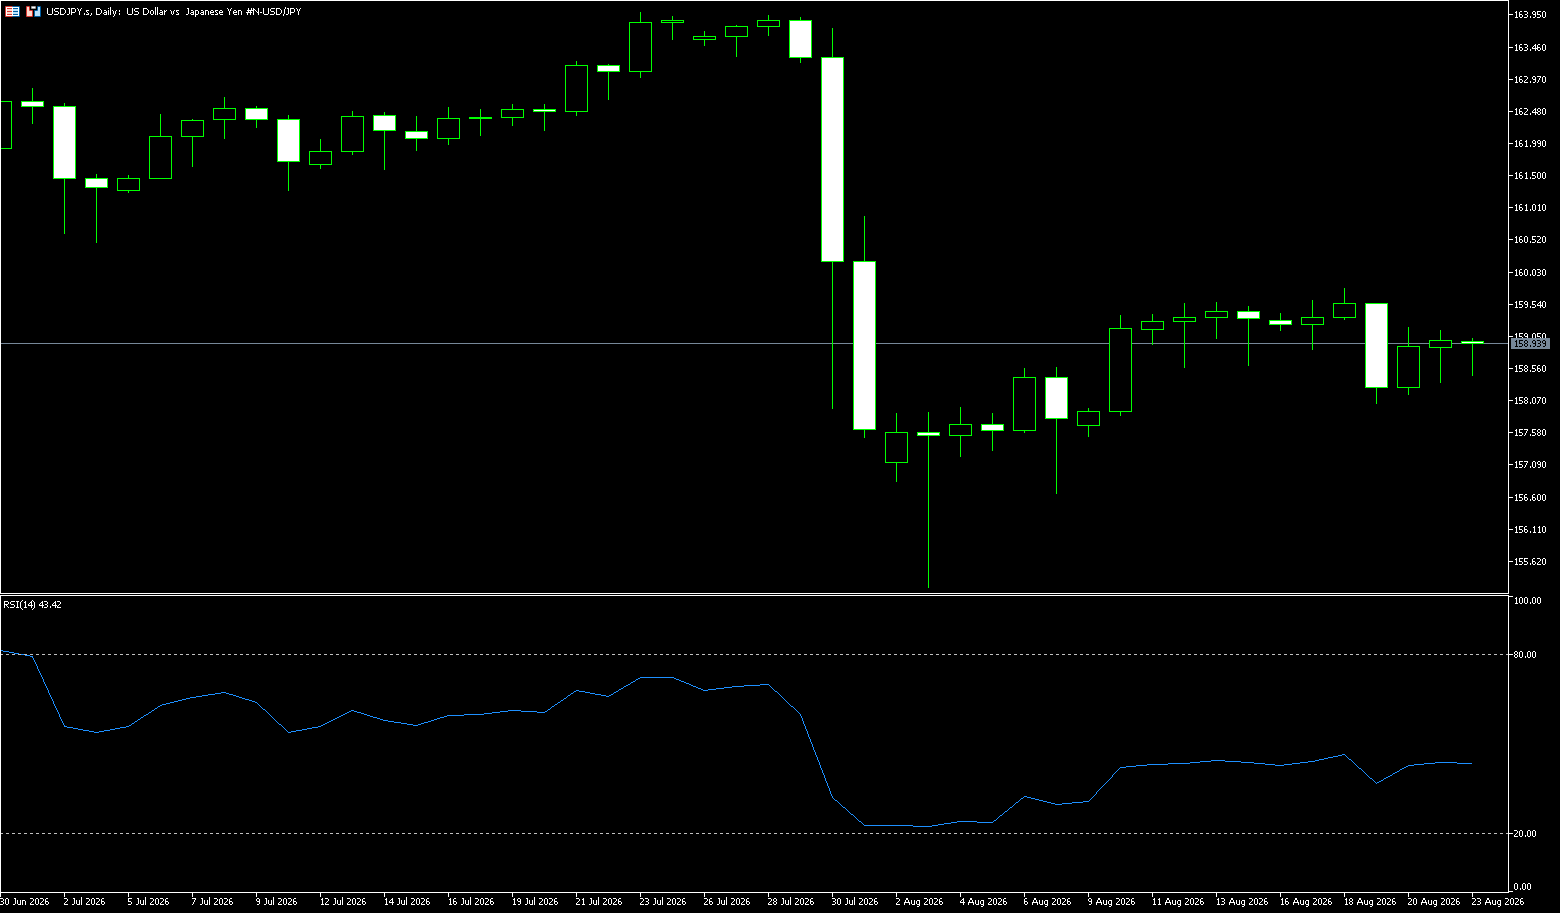
The yen remained relatively unchanged at around 159 against the dollar last week, after experiencing significant volatility earlier this week as data showed Japan's inflation rate accelerating for the second consecutive month, strengthening the case for a near-term interest rate hike by the Bank of Japan. Markets are speculating about possible moves in September, with Bank of Japan Governor Kazuo Ueda suggesting that authorities may begin normalizing policy at a faster pace. Midweek, the yen rose nearly 1% after the US Treasury announced a larger-scale debt buyback program to control borrowing costs, but gave back more than half of those gains a day later due to concerns that the US government's plan might only provide a temporary solution. The local currency also faces long-term pressure due to interest rate differentials, escalating fiscal concerns, and high energy and import costs.
The dollar weakened, partly due to the bond buyback operation pushing down US Treasury yields, and partly due to the continued policy interest rate differential between the Federal Reserve and the Bank of Japan, which suppressed the USD/JPY exchange rate. The proactive market intervention by the authorities of the two major economies has led to increasingly similar operating logics for the two asset classes. From a fundamental perspective, the decline in USD/JPY lacks reasonable support. The significant interest rate differential between the Federal Reserve and the Bank of Japan has resulted in the yen being heavily sold as a funding currency in carry trades. The Japanese government can only use funds opportunistically to curb the upward momentum of the USD/JPY. Now, the US Treasury has been forced to take actions contrary to fundamentals, actively intervening in the bond market to adjust the yield curve, thereby preventing excessively high long-term interest rates from impacting government debt interest costs and the pace of domestic economic recovery.
Last week, the USD/JPY pair experienced a volatile upward trend, trading between 158.00 and 159.78. After finding support at the weekly low of 158.00, it rebounded for several days, approaching 159.80 on Friday, reaching a two-week high before retreating back to below 158. Overall, the weekly candlestick closed positive, indicating short-term bullish dominance, but the upward momentum began to falter near the psychological level of 160. On the daily chart: the price has stabilized above the short-term moving averages, with pullback lows gradually rising, forming a higher low structure; the RSI has risen to around 42, indicating that upward momentum still exists but has weakened. Strong resistance is concentrated in the 159.80-160.00 psychological level area. Resilient US economic data and a rebound in US Treasury yields easing expectations of interest rate cuts supported the US dollar. Japan's July CPI rose, increasing expectations of a September rate hike by the Bank of Japan, limiting the currency pair's unilateral upward movement. The market continued to price in the risk of Japanese intervention near the 160 level, suppressing bullish sentiment.
Analyzing next week's trend, on the daily chart, USD/JPY trading below 159 maintains a short-term bearish tone, as it remains below the 20-day exponential moving average (EMA) at 159.43. Price action continues to be limited by this dynamic resistance level, indicating that upward attempts may face resistance as the pair trades below short-term trend indicators. Next week's technical outlook: Key first resistance 159.80-160.00; next resistance 161.00 (50-day moving average) after a valid breakout. The first support level is 158.03 (last week's low); strong support is at 157.43 (234-day moving average). If the daily chart breaks below this level, the current short-term rebound structure will be destroyed, and the market will return to a downward trend. Further support lies at the psychological level of 157.00. Next week's scenario projections—bullish scenario (baseline scenario): Holding the 158.50 support level, the market will attempt to break through the 160 level. If the daily candlestick closes above 160, the bulls will have more room to rise; however, a rapid pullback due to anticipated intervention is possible near 160, making a pullback after a rally highly risky. Oscillating pullback scenario: Encountering resistance in the 159.80-160 area, the market will retest the 158.50 support level. Next week will likely see a wide range of fluctuations between 158.00 and 160.00. Weakening Scenario: A decisive break below 158.00 invalidates the rebound structure, turning the exchange rate downwards towards the 157.20 area. Overall Outlook for Next Week: The short-term trend is bullish, but the 160 level is a strong risk barrier, raising doubts about the sustainability of any significant rise. A more likely scenario is high-level consolidation, and chasing the price higher is not advisable.
Today, consider shorting the US dollar at 159.10, with a stop-loss at 159.30 and targets at 158.30 and 158.20.
EUR/USD
The euro rose above $1.17, its highest level in three months, following a jump in G10 currencies after the US Treasury increased its bond repurchase limits, causing a sharp decline in the dollar. The US Treasury doubled the limit on long-term notes and bonds that can be repurchased next fiscal quarter, which could increase dollar liquidity from the Treasury's general account. These measures indicate that Washington prioritizes lower long-term yields, opting to increase the dollar supply to strengthen the currencies in the DXY basket. Meanwhile, European natural gas prices surged due to supply shortages in the Middle East, which is expected to maintain upside risks to inflation. The European Central Bank is anticipated to raise interest rates further this year to address price increases.
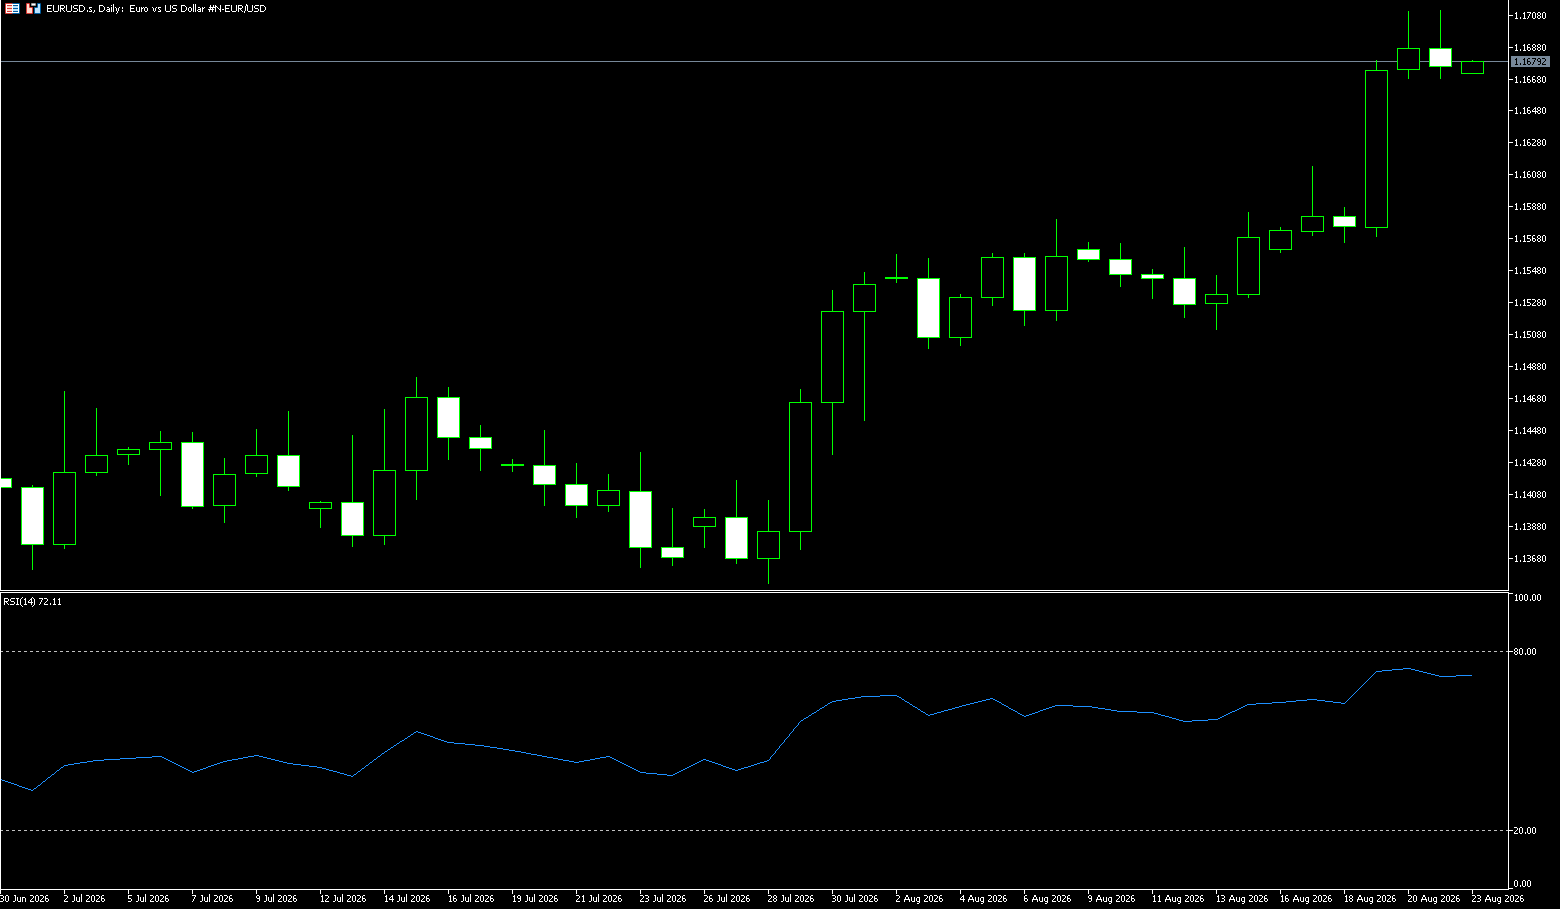
Last week, the euro fluctuated at high levels against the dollar, currently trading around 1.1700, close to its highest level since May 14th at 1.1711. The dollar as a whole remains near three-month lows. Expectations for a Fed rate hike continue to cool, while the ECB is likely to maintain a hawkish stance due to energy-driven inflationary pressures. This divergence in interest rate differentials continues to provide structural support for the euro. However, the inflationary risks from rising energy prices keep year-end rate hike expectations on the table, and high US Treasury yields provide support for the dollar. The ongoing US-Iran standoff at the Strait of Hormuz continues to limit short positions in the dollar due to geopolitical risk premiums.
Last week, the euro traded in a volatile but upward-trending manner against the US dollar, before pulling back and consolidating. The weekly range was 1.1550-1.1710, with the weekly candlestick closing positive but showing a significant upper shadow. The daily RSI entered overbought territory, indicating weakening bullish momentum and a short-term consolidation phase. Driven by policy, the euro performed strongly against the dollar, regaining its position above the 200-day moving average since May. After reaching above 1.1710, it encountered resistance, a level that has repeatedly acted as both support and resistance this year, making it a crucial short-term level to watch. Oscillators generally favor a bullish bias, with the 14-day Relative Strength Index (RSI) rising to 73, entering overbought territory and suggesting a short-term pullback risk. The MACD remains positive, further supporting the bullish outlook.
Next Week's Technical Outlook: Weekly chart: Medium-term bullish, but short-term overbought, likely consolidation before the Jackson Hole central bank meeting provides direction. Key technical levels for next week: First resistance: 1.1710-1.1741 (last week's high; May 13 high); Strong resistance: 1.1788-1.1800 (May 8 high; psychological level). First support: 1.1641-1.1600 (300-day moving average; psychological level); Strong support: 1.1544 (20-day moving average). Trading strategy for this week: Bullish (prioritize buying on dips, avoid chasing highs): If a pullback to the 1.1640-1.1660 range shows a reversal candlestick pattern, consider a small long position; place a stop-loss below 1.1615. First target: 1.1700-1.1710; a break above this level targets 1.1730-1.1760, with profit-taking in stages at resistance levels. Short-selling strategy (playing the pullback, only trading at resistance levels, not trying to predict the top): If the price rebounds to the 1.1700-1.1710 area and shows clear signs of stalling and a long upper shadow, a small short position can be attempted; stop loss above 1.1735. First target: 1.1660-1.1640; a break below this level would target around 1.1580.
Today, consider going long on the Euro at 1.1670, stop loss: 1.1660; target: 1.1730; 1.1740
Stock Analysis:
Australian ASX 200 Stock Index
Basic Market Overview:
The Australian ASX 200 index fell 25 points, or 0.3%, to close at 9,059 on Friday, erasing gains from the previous session. The healthcare, technology, logistics, and business services sectors dragged down the index. Market sentiment was tense ahead of next week's July inflation data release, despite a slight easing in June's figures, which remained above the Reserve Bank's target range. Governor Michelle Bullock recently warned that inflation remains high, citing upside risks from commodity volatility related to the Middle East conflict. Nevertheless, strong US stock index futures limited the market's weakness after Wall Street's sharp decline on Thursday due to rising Treasury yields.
Technology stocks followed their Wall Street counterparts, with Wisetech Global falling 2.1% and Nextdc down 1.3%. Goodman Group fell 5.5%, Wesfarmers fell 2.8%, and Sonic Healthcare fell 2.0%, while the Big Four banks pared losses, closing mixed. Contrary to the trend, Guzman Y Gomez surged 11.5% after reporting a 29.7% profit increase. The local market declined 0.6% this week, marking its second consecutive week of losses.
Sector Performance:
Leading Sectors:
Materials (minerals, gold and lithium), Energy; Benefiting from high international gold and oil prices, resource stocks hedged against interest rate risk.
Leading Sectors:
Australian REITs (-2.4%), Consumer Discretionary, Financials, Healthcare; Rising bond yields pressured REITs, retail earnings fell short of expectations, bank mortgage data was weak, and some healthcare stocks were sold off after earnings reports.
Technical Analysis:
The ASX200 index closed last week at 9059 points, a weekly decline of -0.6%, marking its second consecutive week of losses. It has retreated from its historical high of 9296.7 and entered a high-level consolidation and correction phase. The market was generally weak throughout the week, with 6 out of 11 sectors closing lower. The earnings season saw significant stock divergence, with rising US Treasury yields and concerns about Australian inflation suppressing risk appetite. The resource sector provided the main support. Australian Earnings Season: Weak earnings guidance will likely lead to significant valuation corrections, as the market at high levels has low tolerance for earnings disappointments. Rising US Treasury yields and volatile global risk sentiment suppressed interest rate-sensitive sectors (real estate, consumer goods). The market awaits next week's July Australian inflation data; the Reserve Bank of Australia retains the possibility of a rate hike, and inflation data will directly impact interest rate expectations.
Currently priced at 9059, it is in a high-level pullback range. The daily chart shows a pullback from historical highs, exhibiting a volatile pattern without a clear directional trend. The index has retreated from its highs, with significant selling pressure above 9130; 9000-9130 constitutes a short-term trading range. A sustained move above 9000: maintaining high-level volatility, with a potential rebound to test the 9100-9130 range. The current price is 9059, in a high-level pullback range. The daily chart shows a decline from the historical high, exhibiting a volatile pattern without a clear directional trend. Key technical levels: Strong resistance: 9130-9150; a break above this level will lead to a retest of the historical high of 9297; First resistance: 9090-9100, the first resistance level for a short-term rebound; First support: 9000, a psychological and technically important support level, a key dividing line between bulls and bears; Strong support: 8900-8920; a break below this range would open up further downside potential.
Trading Strategy:
Trading Strategy (Short-term perspective): Focus on range trading, avoid chasing highs.
Long positions: If a pullback to the 9000-9010 support zone shows signs of stabilization, consider a small long position; place a stop-loss below 8970; first target 9090-9130.
Short Selling: A rebound to the 9090-9130 resistance zone followed by a pullback presents a small shorting opportunity; stop-loss above 9160; initial target 9000, with a further target of 8900 if it breaks below.
Key Risk Warnings:
1. Inflation Risk: Higher-than-expected Australian CPI in July will strengthen expectations of a Reserve Bank of Australia (RBA) rate hike, severely impacting the ASX200, especially the real estate, banking, and consumer sectors.
2. External Risks: Continued rise in US Treasury yields and a correction in US stocks will lead to a simultaneous weakening of Australian stocks; geopolitical changes in the Middle East will disrupt crude oil and commodities.
3. Technical Risks: A breach of the 9000 support level will trigger algorithmic selling pressure, accelerating the pullback to below 8900.
4. Earnings Reporting End Risk: Some heavyweight companies are still releasing their earnings reports, which could cause significant volatility in individual stocks.
Dow Jones Industrial Average
Basic Market Overview:
U.S. stocks rebounded on Friday, with the Dow Jones Industrial Average rising over 500 points, and the S&P 500 and Nasdaq Composite also showing strength. Cryptocurrency-related stocks were among the best performing sectors, with Bitcoin surging about 22% this week, driving significant gains in stocks like Robinhood and Coinbase. However, U.S. Treasury yields continued to climb, with the 10-year yield approaching 4.75% and the 30-year yield remaining around 5.27%, keeping market concerns about a deeper correction in the fall unresolved. At the close, the S&P 500 rose 0.43% to 7674.31; the Nasdaq Composite rose 0.44% to 26180.45; and the Dow Jones Industrial Average rose 517.80 points, or 0.98%, to 53277.01.
Despite Friday's rebound in the three major indices, it failed to reverse the overall weakness of the week. The S&P 500 fell 1.4% this week, and the Nasdaq fell 2%, both ending three consecutive weeks of gains; the Dow Jones Industrial Average fell 0.9% this week, marking its second consecutive week of decline. Selling pressure also spread to overseas markets, with the MSCI World Index falling nearly 1% this week. Overall, although US stocks successfully rebounded on Friday, this week's market performance still left a clear signal: Entering next week, whether US Treasury yields can stabilize, what policy signals Warsh released at Jackson Hole, and key events such as Nvidia's earnings report will jointly determine whether this round of Wall Street rebound can be sustained.
Sector Performance:
Leading Sectors (relatively resilient/strongest rebound this week): Healthcare, Materials, Large Banks and Financials; Morgan Stanley and Goldman Sachs led the rebound on Friday, while Johnson & Johnson and Merck provided support for the Dow components.
Leading Sectors: Utilities, Consumer Staples; Thursday's selling pressure was concentrated in consumer goods and some technology heavyweights; tech giants diverged, with only Tesla showing strong rebound, while Apple and Nvidia weakened this week.
Technical Analysis:
US stocks experienced a slight downward trend at the beginning of last week, but a sharp sell-off on Thursday, driven by a surge in long-term US Treasury yields, resulted in a 703.84-point drop to a low of 52754.90. On Friday, better-than-expected US PMI data and a slight decline in US Treasury yields led to a strong rebound, with the index closing up 0.98%, recovering most of its intraday losses. However, the Dow Jones Industrial Average still closed lower for the week. The Dow Jones closed at 53277.01, down 0.85% for the week, marking its second consecutive weekly decline. Rising long-term US Treasury yields, concerns about US fiscal debt, and geopolitical disturbances in the Middle East dampened risk appetite; Friday's better-than-expected services PMI provided bargain hunting to restore market sentiment. Market characteristics: The market exhibited a clear defensive stance with rotation among cyclical resources; technology stocks dragged down the market more than traditional blue chips, and the Dow Jones outperformed the Nasdaq and S&P 500.
Technical Analysis for Next Week; Indicators and Structure—Daily Chart: The price is currently in a short-term consolidation phase with a slight pullback. After breaking below the 50-day moving average, it rebounded on Friday back to near the moving average level. The 14-RSI has returned to the neutral range, with no extreme overbought or oversold conditions. MACD momentum is weak, and the rebound is a correction of oversold conditions, not a reversal of the downtrend. Next Week's Scenario Forecast—Optimistic Scenario: A firm hold above 53800, with a rebound testing 54200-54300; this requires a decline in US Treasury yields and a dovish Jackson Hole speech as catalysts. Neutral Scenario: Fluctuating between 52750 and 53800, awaiting events to determine direction. Pessimistic Scenario: A decisive break below 52750 and then below 52400, initiating a deeper pullback.
Trading Strategy:
Operational Strategy (Short-Term Trading Perspective):
Bull Strategy: Avoid chasing highs. A pullback to the 52750-52800 support zone with a potential bottoming signal could present a small long position; stop-loss below 52350; first target 53700, with a further target of 54200 if it breaks through.
Bearish Strategy: A rebound to the 53700-53800 resistance zone with a potential pullback signal could present a short position; stop-loss above 54350; first target 52750, with a further target of 52400 if it breaks below.
Wait-and-See Strategy: Next week features several major events including Jackson Hole, Nvidia's earnings report, and PCE inflation data. Before these events, the market direction may be unclear; consider reducing positions and waiting for a clear breakout/breakdown of the key range before entering the market.
Key Risk Warnings:
1. Macroeconomic Event Risks: A hawkish speech by the Federal Reserve Chairman at the Jackson Hole Economic Symposium next Friday could push up US Treasury yields, directly impacting US stock valuations. Nvidia's earnings report after Wednesday's close will affect overall market risk appetite. Higher-than-expected US PCE inflation data will also exert downward pressure.
2. Geopolitical Risks: Middle East unrest pushing up oil prices and exacerbating inflation concerns will amplify index volatility.
3. US Treasury Risks: Pressure from US fiscal debt issuance and continued rise in long-term US Treasury yields are currently the biggest negative variable for US stocks, potentially triggering a larger correction.
4. Technical Risks: Friday's rebound was merely a correction after the decline and does not necessarily indicate a trend reversal. A breach of key support levels could lead to accelerated declines.
Disclaimer: The information contained herein (1) is proprietary to BCR and/or its content providers; (2) may not be copied or distributed; (3) is not warranted to be accurate, complete or timely; and, (4) does not constitute advice or a recommendation by BCR or its content providers in respect of the investment in financial instruments. Neither BCR or its content providers are responsible for any damages or losses arising from any use of this information. Past performance is no guarantee of future results.
More Coverage






2026 © - All Rights Reserved by BCR Co Pty Ltd
Risk Disclosure:Derivatives are traded over-the-counter on margin, which means they carry a high level of risk and there is a possibility you could lose all of your investment. These products are not suitable for all investors. Please ensure you fully understand the risks and carefully consider your financial situation and trading experience before trading. Seek independent financial advice if necessary before opening an account with BCR.
BCR Co Pty Ltd (Company No. 1975046) is a company incorporated under the laws of the British Virgin Islands, with its registered office at Trident Chambers, Wickham’s Cay 1, Road Town, Tortola, British Virgin Islands, and is licensed and regulated by the British Virgin Islands Financial Services Commission under License No. SIBA/L/19/1122.
Open Bridge Limited (Company No. 16701394) is a company incorporated under the Companies Act 2006 and registered in England and Wales, with its registered address at Kemp House, 160 City Road, London, England, EC1V 2NX. Open Bridge Limited acts solely as a payment processor for BCR Co Pty Ltd and does not provide any financial, trading, or investment services on its behalf. Open Bridge Limited's role is limited to payment processing.


 English
 简体中文
简体中文
 繁體中文
繁體中文
 Bahasa
Melayu
Bahasa
Melayu
 Tiếng
Việt
Tiếng
Việt
 ไทย
ไทย
 日本語
日本語
 한국어
한국어
 ភាសាខ្មែរ
 español