


0
Currency & Commodity Analysis:
US Dollar Index
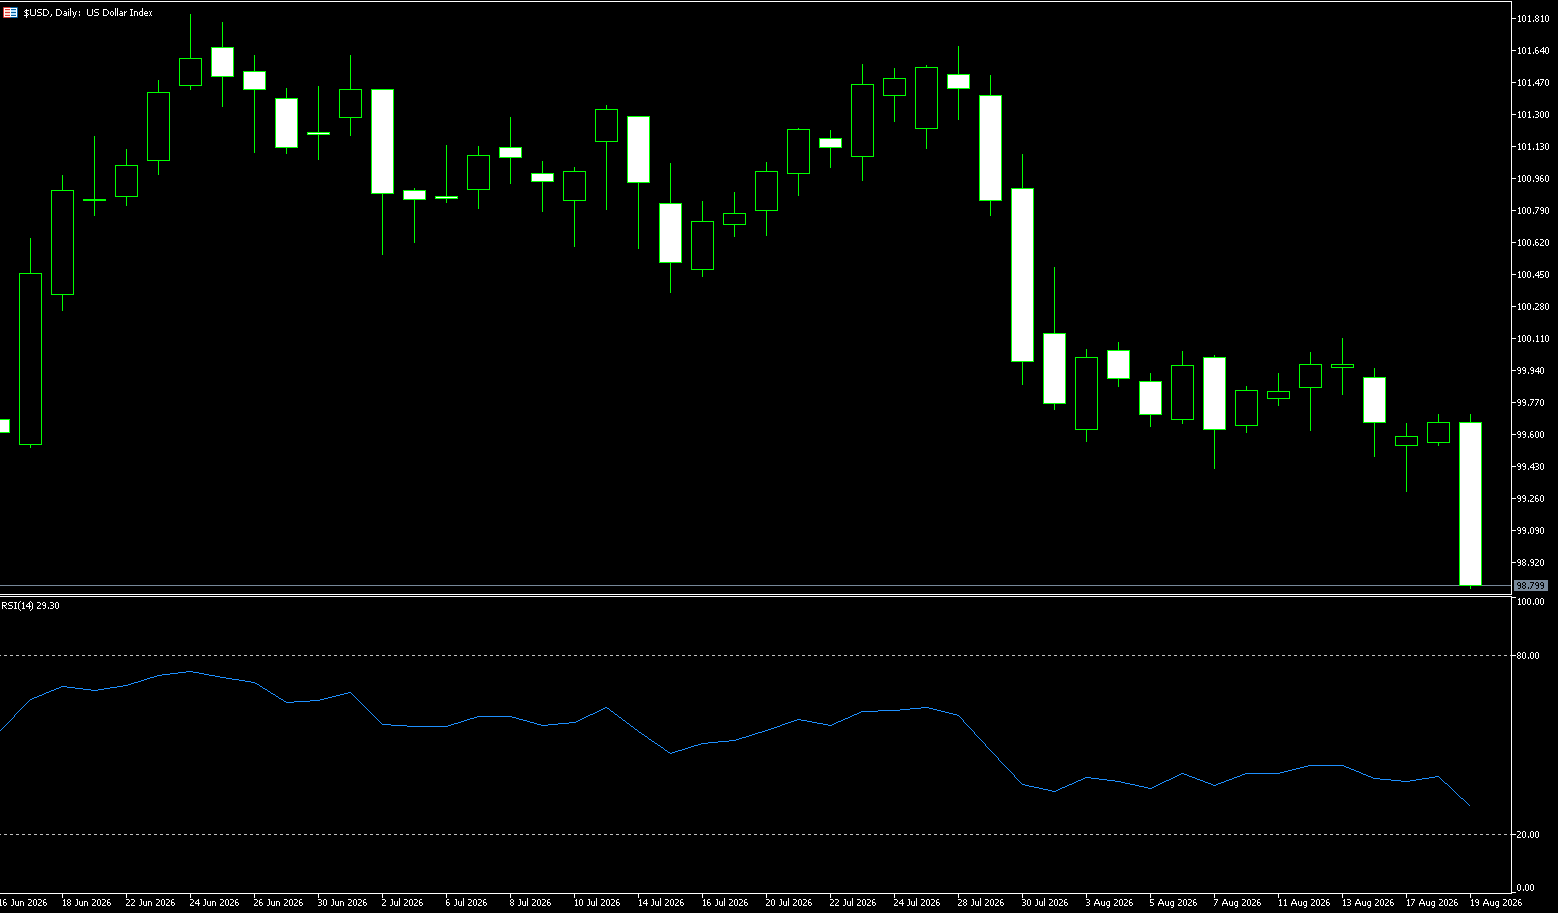
The US dollar index fell below 99 on Wednesday, hitting its lowest point since the end of May, after the US Treasury announced it was doubling its long-term buyback program. This move indicates the U.S. Treasury's willingness to actively intervene in the bond market to limit long-term yields and increase expectations of dollar liquidity from the general treasury account in the global financial system. These measures are consistent with earlier efforts to curb the surge in global long-term bonds, which typically drives foreign companies to sell their dollar holdings to support their currencies. Recent interventions in the foreign exchange market by Japan and the U.S. led to a sharp decline in the dollar index, prompting Treasury Secretary Bessenter to call for raising the limits on foreign access to the Federal Reserve's FIMA facilities so that foreign countries could obtain dollar liquidity without requiring aggressive intervention in the foreign exchange market. Meanwhile, the FOMC meeting minutes confirmed that some members saw reasons for raising interest rates.
Market speculation on the dollar has clearly strengthened. Data from the U.S. Commodity Futures Trading Commission (CFTC) shows that net long positions rose from 17.2K contracts to 22.5K contracts. This weekly increase of 5.3K contracts, the largest in several weeks, indicates that bullish exposure to the dollar is accelerating again after a relatively modest accumulation throughout July. This confirms that speculative demand for the dollar has been building momentum over the past month. The 14-day Relative Strength Index (RSI) is at 30, still below the Bollinger Band midline of 100.17, suggesting that downward pressure continues despite the absence of a clear oversold reading. Support levels to watch are Monday's low of 98.26 (May 13 low) and the 98.00 psychological level; resistance levels to watch are 99.77 (14-day exponential moving average) and 100.00 (psychological level).
Consider shorting the US Dollar Index at 98.90 today, with a stop-loss at 99.00 and targets at 98.50 and 98.40.
WTI Crude Oil
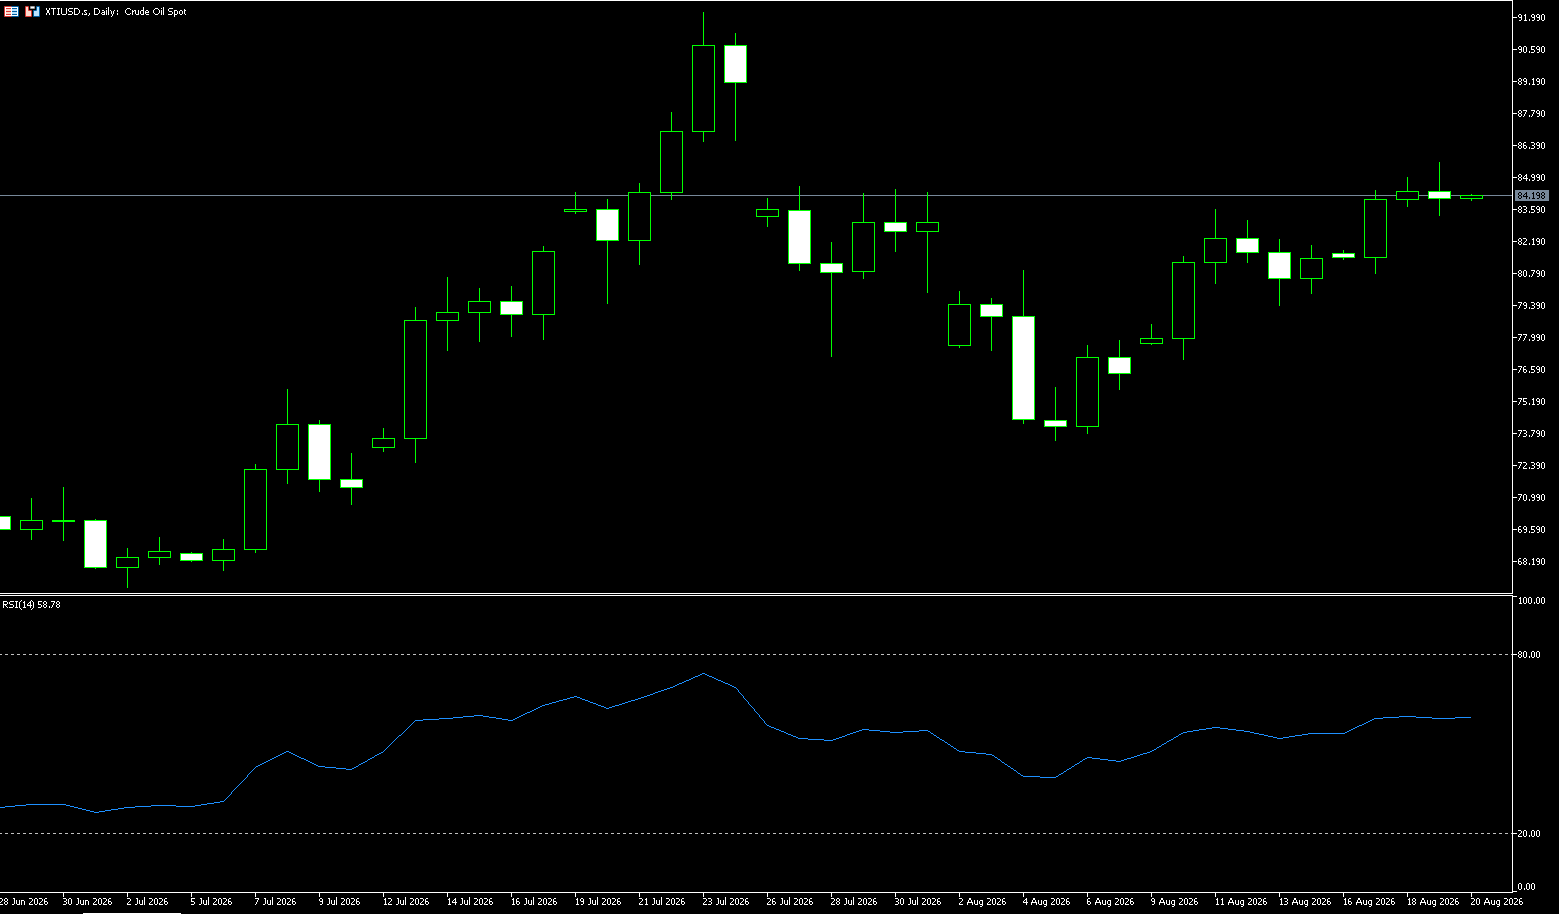
On Wednesday, crude oil prices rose to $84 a barrel, marking the fourth consecutive day of gains, as supply concerns continued to escalate with few signs of an agreement between the U.S. and Iran on ending the conflict and reopening the Strait of Hormuz. President Donald Trump stated that there were no ongoing negotiations with Tehran, while confirming that the U.S. naval blockade remained in effect. Despite Trump's claims that the waterway is open and mines have been cleared, shipping risks in the Strait of Hormuz remain, and traffic through this strategic waterway remains limited. Over the past week, Iranian forces have intensified hostilities, with eight attacks on ships transiting the Strait of Hormuz reported so far this month, including vessels linked to the UAE and Saudi Arabia. In the U.S., industry data showed that crude oil inventories fell by 328,000 barrels last week, after rising by 9.07 million barrels the previous week.
From a technical perspective, WTI's daily chart shows a clear strengthening trend, with prices rising for the fourth consecutive trading day and regaining the $84 mark, forming a relatively clear bullish pattern in the short term. After finding support at lower levels, prices rebounded continuously, and current market momentum leans towards the bulls. However, after the continuous rise, short-term indicators have gradually entered overbought territory, and further upward movement should be approached with caution due to profit-taking pressure. The first resistance level to watch is the $86.00-$87.00 area. If this level can be effectively broken and held, the next target may be near the $90.00 mark; if geopolitical risks escalate further, a move towards $92 cannot be ruled out. On the support side, the key support level to watch is around $82.00, followed by the $80 mark. If WTI falls below $80 again, it means that the recent risk premium may begin to contract significantly.
Today, consider going long on crude oil at 84.00, with a stop loss at 83.80 and targets at 85.00 and 86.00.
Spot Gold
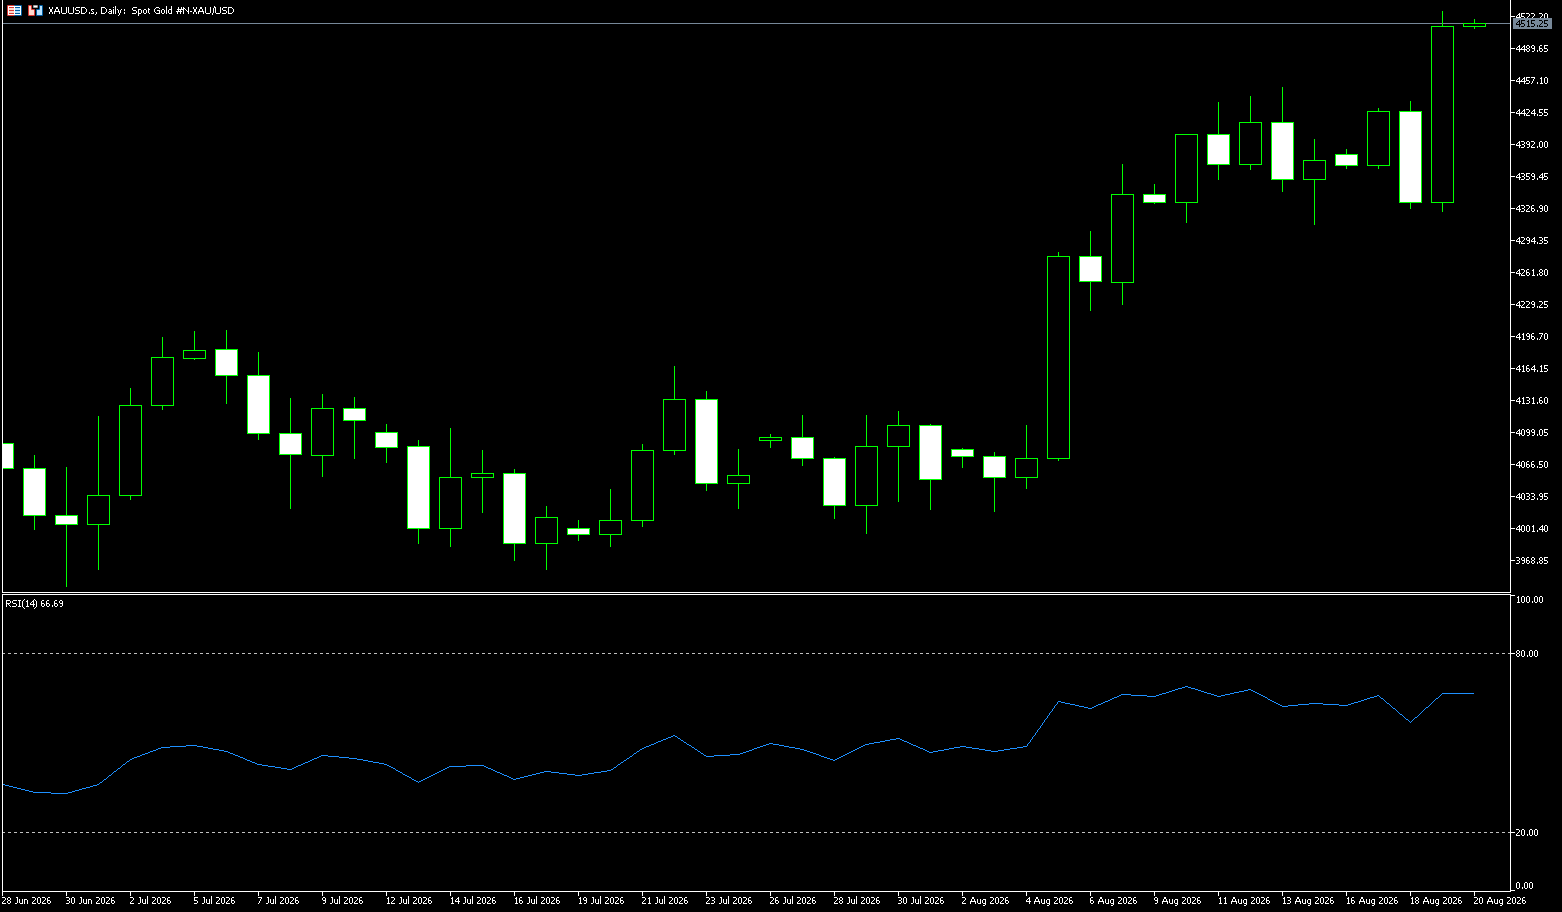
Gold rose in Wednesday's trading session after the Federal Reserve released the minutes of its July meeting. The minutes showed that the central bank kept interest rates unchanged, but not unanimously, with three members voting against and calling for a rate hike. At the time of writing, gold was trading at $4,482, up more than 4.0%. On Wednesday, gold prices rose to $4,525 per ounce, the highest level since early June, following the U.S. Treasury's trend of doubling its repurchase of Treasury bonds and securities in the upcoming fiscal quarter. This marks Washington's renewed efforts to curb soaring long-term bond yields, after Secretary Bessant called for raising the ceiling on the Fed's FIMA tools. Lower borrowing costs reduce the opportunity cost of holding non-interest-bearing precious metals in the market. Furthermore, the initial increase in dollar liquidity resulting from these measures also boosted gold prices. Meanwhile, the minutes of the Fed's interest rate decision meeting confirmed that some policymakers believed that raising rates this year could prevent more severe inflationary pressures in the future.
On the daily chart, gold maintains its recent bullish bias, having broken through the 100-day simple moving average at $4,381. Momentum continues to improve, with the Relative Strength Index (RSI) remaining positive at 67, and the MACD histogram staying above the zero line, indicating that buyers still dominate despite signs of easing upward momentum. Resistance lies at the upper Bollinger Band at $4,548, followed by the $4,600 level, where recent gains may encounter profit-taking. Short-term support is seen at the previous high of $4,450, followed by the psychological level around $4,400. A deeper pullback could see support before breaking below the 100-day moving average near $4,382.
Consider going long on gold today at $4,515, with a stop-loss at $4,510 and targets of $4,550 and $4,560.
AUD/USD
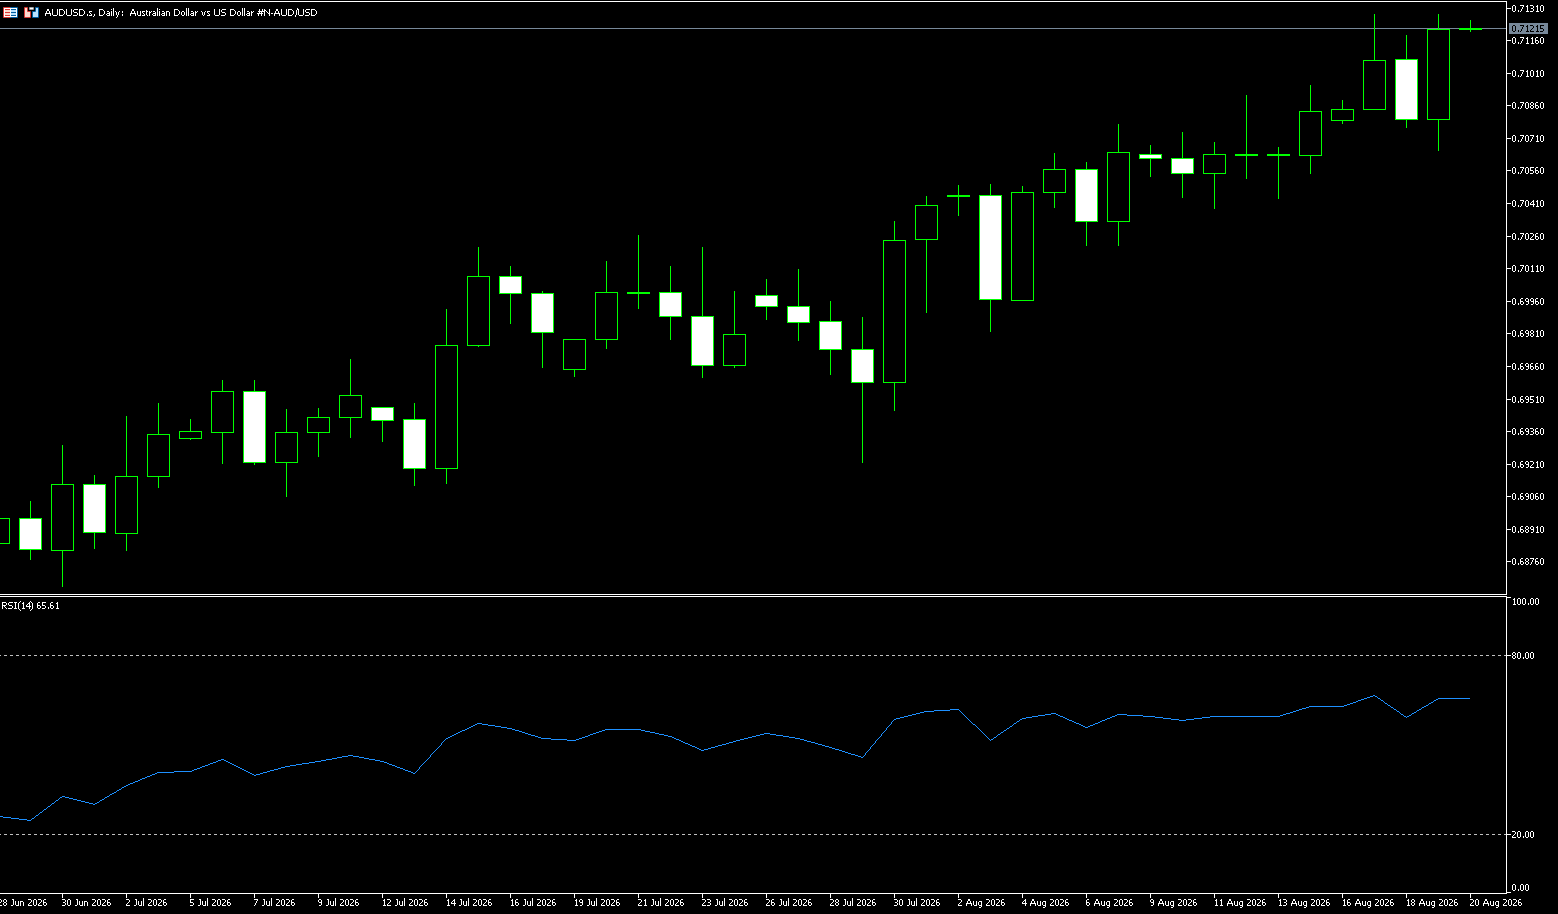
The Australian dollar is above US$0.71 but remains near a ten-week high as investors weigh the latest comments from the Reserve Bank of Australia against weak quarterly wage data. Australian wages rose at a modest pace in the June quarter, marking the fifth consecutive quarter of growth, while the private sector's annual growth rate fell to its lowest level in four years. Lower private sector wage growth may ease pressure on the Reserve Bank of Australia (RBA) to tighten policy, although Deputy Governor Andrew Hauser warned that the central bank may need to raise interest rates again if upside risks to inflation materialize. He emphasized the Middle East conflict, the global AI boom, and weak productivity as key risks to inflation. The RBA kept the cash rate at 4.35% last week, having raised it by 75 basis points since February to curb persistent price pressures. Focus now shifts to Thursday's employment report, with July employment expected to increase by 15,000, following a strong increase of 76,300 in June, and the unemployment rate expected to remain at 4.4%.
Renewed geopolitical risks provided safe-haven buying support for the US dollar, outweighing the weakening effect of weak US economic data on rate hike expectations. Escalating tensions between the US and Iran are putting upward pressure on energy prices, and market concerns have resurfaced that major central banks may need to maintain a tightening stance. Australia's second-quarter wage price index and the Federal Reserve meeting minutes are the key variables this week – the former will influence RBA policy expectations, while the latter will determine whether the US dollar can gain further upward momentum. The Australian dollar traded at 0.7080, extending its gains and breaking above the 20-day exponential moving average (EMA) at 0.7035, maintaining a constructive bullish tone. The price is above this short-term trend indicator, suggesting buyers remain in control, while the Relative Strength Index (RSI) (14) at 60, still below overbought territory, shows solid positive momentum. On the downside, the 20-day EMA at 0.7035 provides immediate support, with 0.7000 (a psychological level) being the next key support. On the upside, a break above the two-month high of 0.7130 would see the pair further test the May 29 high of 0.7200.
Consider going long on the Australian dollar at 0.7110 today, with a stop loss at 0.7100 and targets at 0.7150 and 0.7160.
GBP/USD
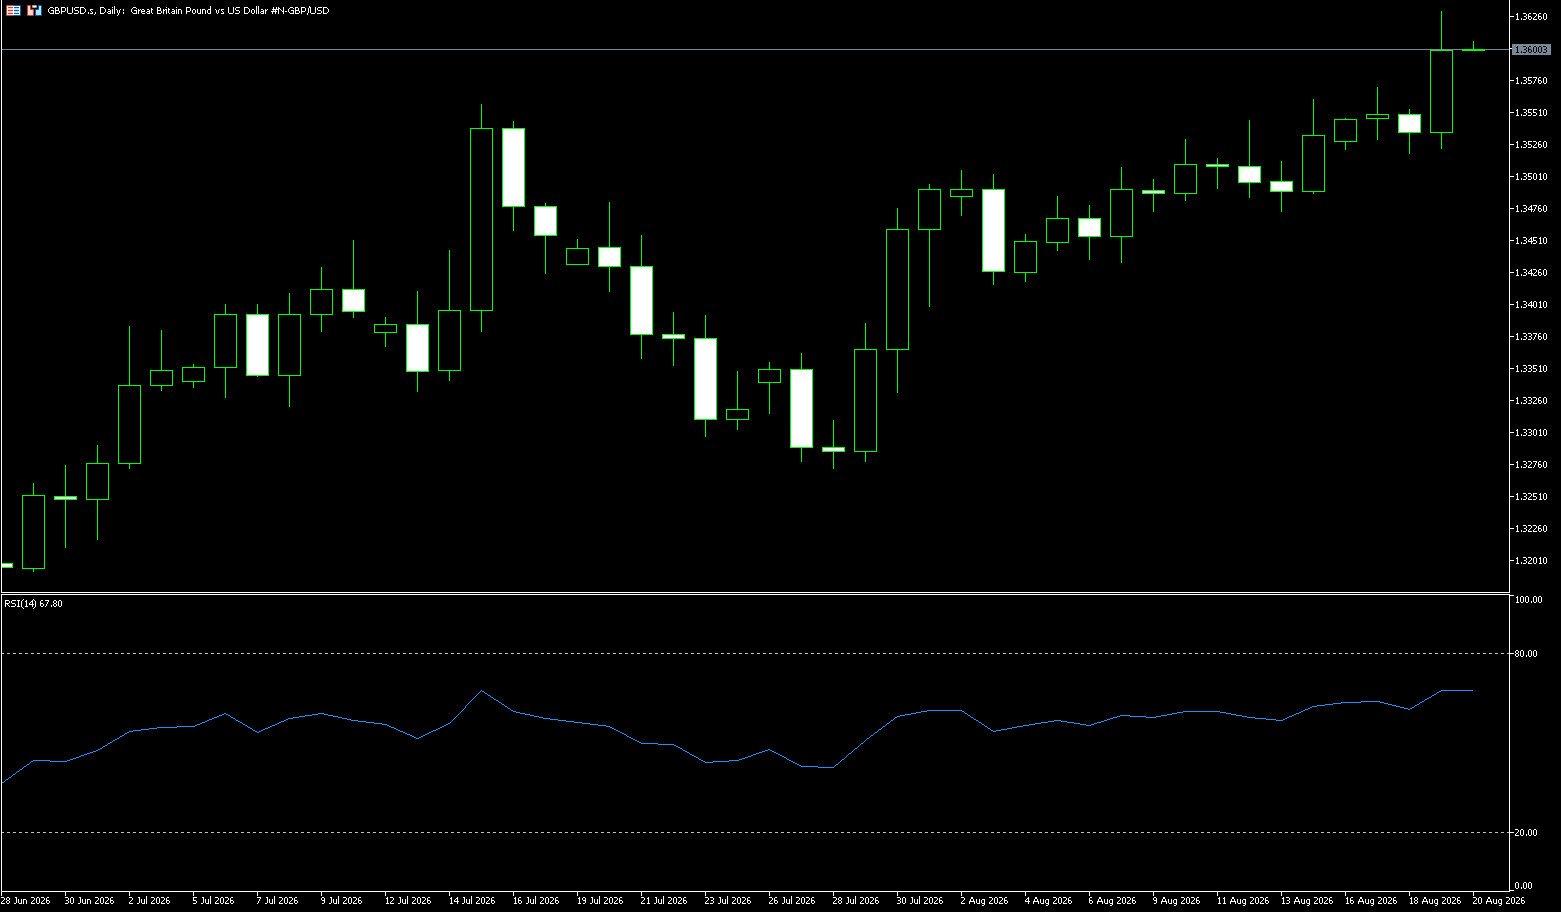
Following the Bank of England's inflation data release, GBP/USD rebounded above 1.3580 on Wednesday, but remained trapped within the range of the previous trading days, below the 1.3600 resistance area. Data released Wednesday by the UK Office for National Statistics showed that UK inflation accelerated in July as expected. The UK Consumer Price Index (CPI) rose 0.3% month-on-month and 2.9% year-on-year, compared to 0.1% and 2.6% respectively in the previous months. Core CPI rose 2.6% year-on-year, unchanged from the previous month, while the market consensus was for a slight decline to 2.5%. Unemployment claims unexpectedly fell. Wage growth accelerated after stagnating for three months, but the pound still fell slightly against most major currencies. The latest UK employment data "didn't contain anything particularly groundbreaking," and in their view, it didn't change the view that "the job market remains sluggish and wage pressures are fairly limited." Analysts believe that this data "will hardly prompt the Bank of England to raise interest rates this year."
On the daily chart, the pound/dollar pair maintains a short-term bullish bias as the spot price remains above the 100-day simple moving average of 1.3422 and the Bollinger Band midline of 1.3450, providing continued support for the recent upward trend. The Relative Strength Index (RSI) (14) is at 68.18, in bullish territory but not yet overbought, indicating that momentum remains constructive, and as long as the exchange rate remains above these basic moving averages, further gains are expected to continue. On the upside, initial resistance appears at the psychological level of around 1.3600, followed by a potential test of the previous high of 1.3658 (May 1); buyers may hesitate as they approach this area. On the downside, initial support is provided by the Bollinger Bands midline at 1.3450, followed by the 100-day SMA at 1.3422, with deeper support near the psychological level of 1.3400. As long as GBP/USD holds this layered support zone, the technical structure will remain biased towards buying on dips rather than a broader reversal.
Consider going long GBP/USD today at 1.3590, with a stop-loss at 1.3580 and targets at 1.3640 and 1.3650.
USD/JPY
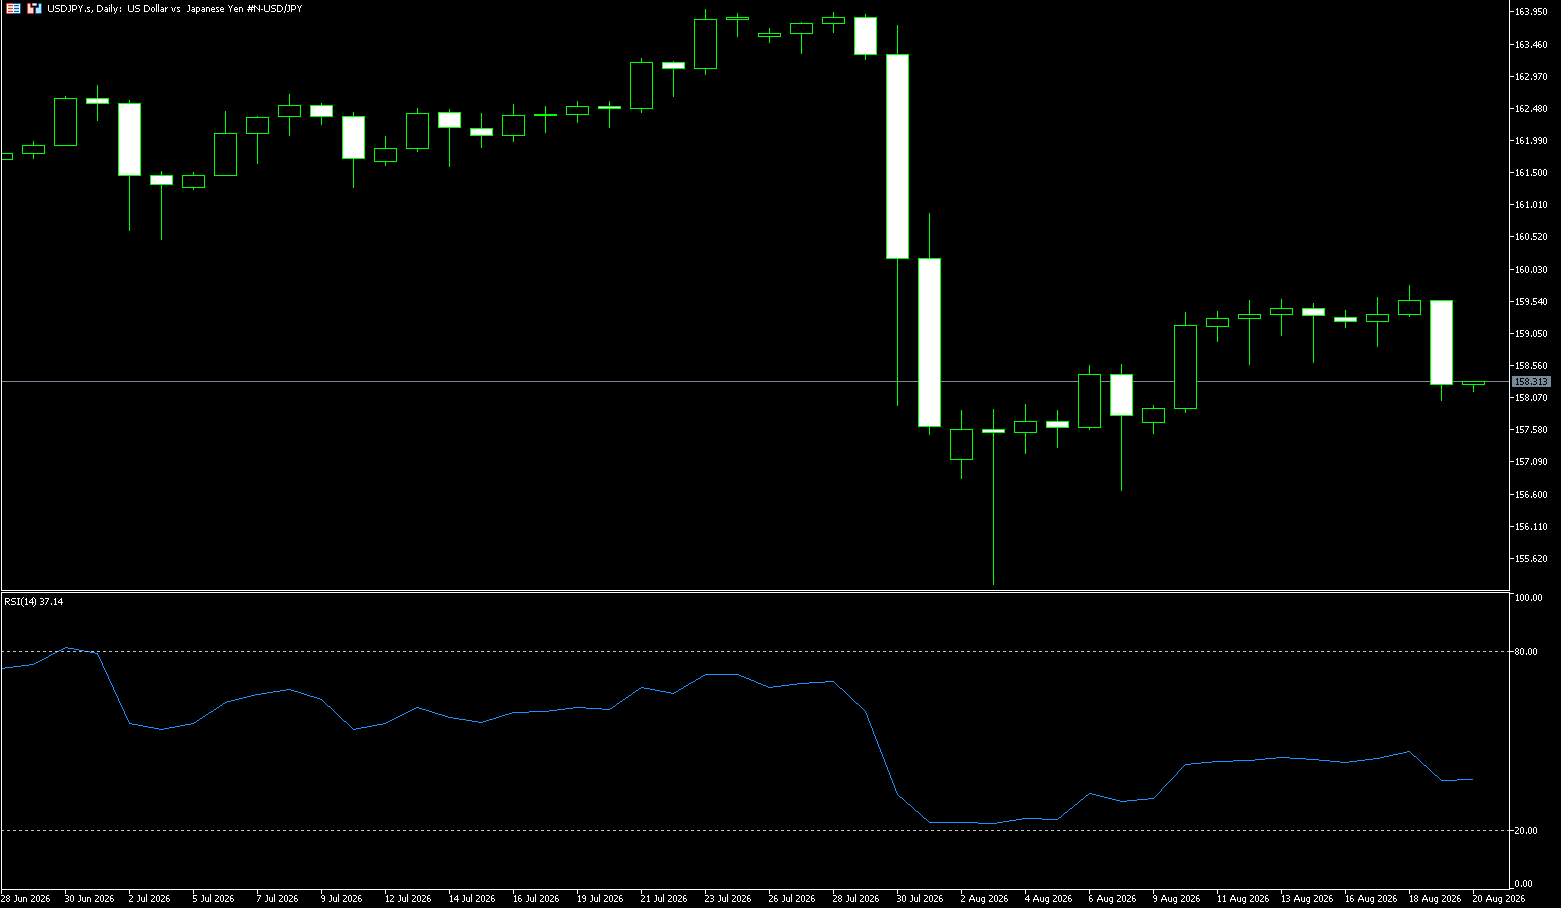
The yen extended its intraday gains on Wednesday as the dollar faced renewed selling pressure following a sharp drop in long-term U.S. Treasury yields. At the time of writing, USD/JPY was trading around 158.10, its lowest level in over a week. U.S. Treasury yields fell after the Treasury announced an expansion of its repurchase program for long-term government debt. The maximum size of each operation will increase from $2 billion to at least $4 billion across both 10-20 year and 20-30 year maturities. Lower U.S. yields reduced the attractiveness of dollar-denominated assets, pushing the dollar lower across the board. The dollar index traded around 98.80, down 0.80% on the day and hitting its lowest level since May 29. Meanwhile, the market remains focused on the Federal Reserve's monetary policy outlook. Recent U.S. employment and inflation data have lowered market expectations for a near-term interest rate hike. In Japan, concerns about intervention and expectations of a hawkish stance from the Bank of Japan provided additional support for the yen. However, fiscal concerns, higher oil prices, and a large interest rate differential with other major economies may limit the yen's upside potential.
From a technical perspective, USD/JPY recently rebounded strongly from the 155.25-155.20 area, the lowest level since early May, but stalled near the 50% Fibonacci retracement level of the pullback from the 40-year high. Meanwhile, momentum indicators suggest weakening upward momentum as USD/JPY consolidates below a cluster of resistance levels. The 14-day Relative Strength Index (RSI) is around 46.58, while the Moving Average Convergence Divergence (MACD) indicator has slightly fallen below the zero line, with a mild negative histogram. Therefore, if the subsequent move breaks through the 50% retracement level of 159.61, it may encounter resistance near the 100-period exponential moving average (EMA) at 159.98. A break above this level should pave the way for further gains towards the 61.8% retracement level of 160.65, and the higher resistance level of 162.00. On the downside, initial support lies at the psychological level of 158.00, while further declines would expose a structural bottom near the 23.6% Fibonacci retracement level of 157.30.
Consider shorting the US dollar today at 158.25, with a stop loss at 158.40 and targets at 157.20 and 157.00.
EUR/USD
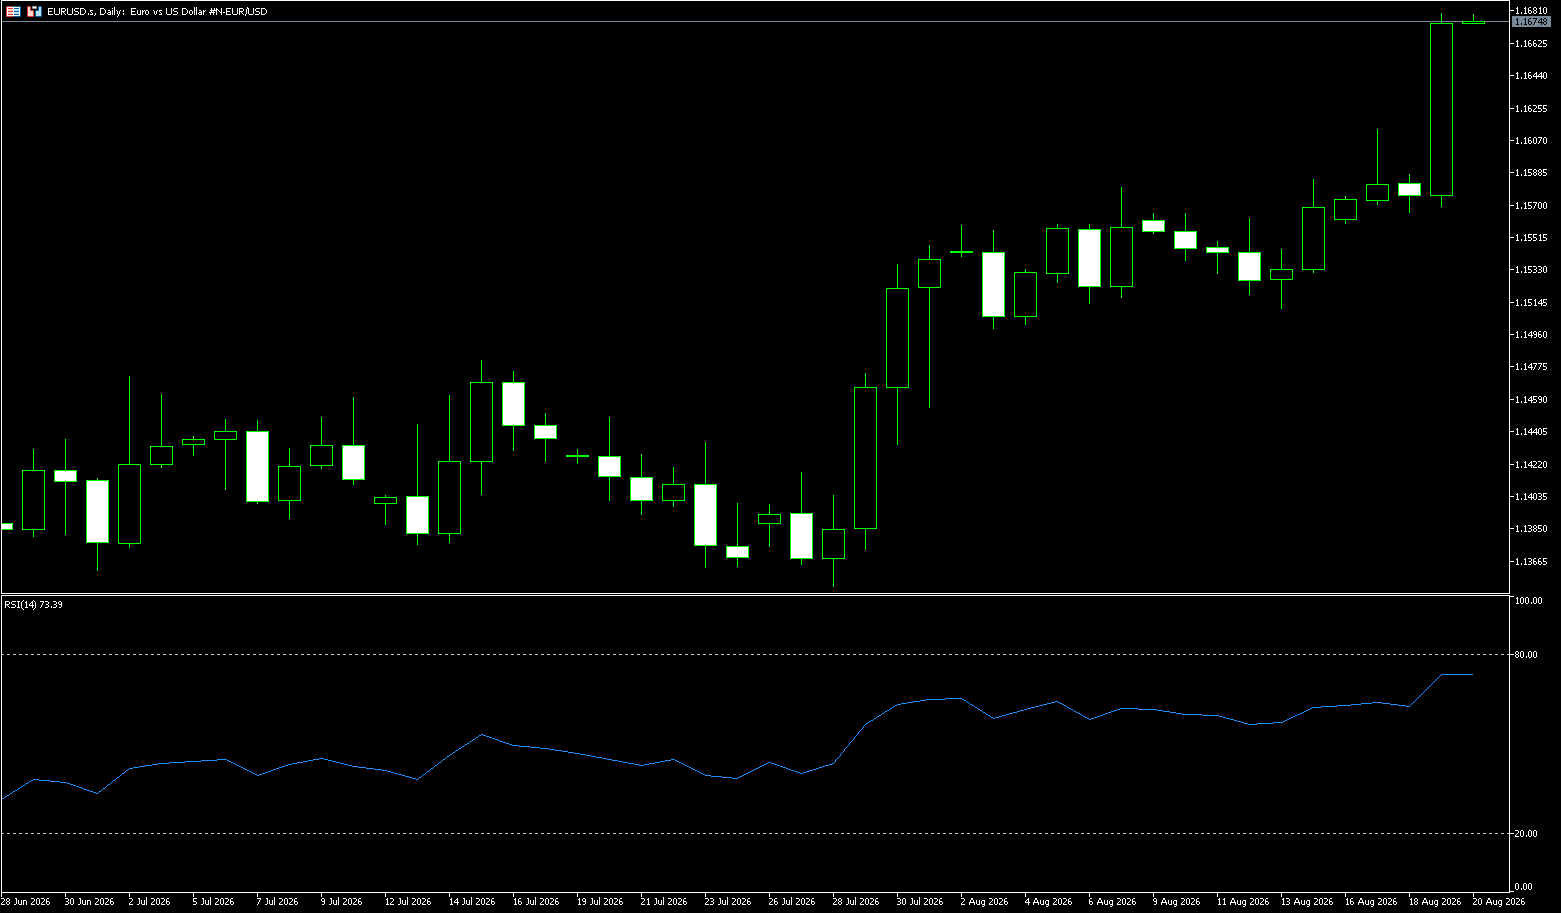
The euro rose more than 0.85% against the dollar to 1.1680 during Wednesday's North American session, despite the hawkish tone of the latest Federal Reserve meeting minutes, with some participants and three dissidents suggesting that a rate hike might be necessary if deflation stalls. The euro/dollar traded around 1.1675, near a two-and-a-half-month high. The euro/dollar rose as lower US yields offset the impact of the hawkish Fed minutes. The Fed released the minutes of its July meeting, in which dissidents acknowledged that inflation appeared widespread and supported a more "restrained policy." The minutes showed that policymakers were concerned about inflation, with many participants believing that "if inflation does not decline, policy tightening may be necessary." The Eurozone's Harmonized Index of Consumer Prices (HICP) rose to 2.9% in July from 2.8% in June, in line with initial expectations. Core inflation rose to 2.5% from 2.4% in June. The FOMC meeting minutes showed that no policy easing was discussed. Newly appointed Fed Chairman Kevin Warsh asked the committee whether it would be best for the Fed to hold only six monetary policy meetings to obtain two months' worth of complete data. Meanwhile, the 2026 schedule will remain unchanged.
Last week's data releases fueled a recent shift in dollar sentiment, "helping to ease expectations of a Fed rate hike," but have not yet triggered any meaningful unwinding of long dollar positions. The dollar index remains supported above its 200-day moving average of 99.17, suggesting that a more dovish policy outlook has not yet translated into a "sharp sell-off" in the dollar index. On the daily chart, EUR/USD maintains a short-term bullish bias as the spot price remains above the 100-day moving average at 1.1569 and the Bollinger Band middle line at 1.1508, suggesting the underlying trend remains constructive after the rebound from the lower Bollinger Band support near 1.1364. Momentum indicators also provide support, with the Relative Strength Index (RSI) (14) at 72.10, suggesting buyers remain dominant but are in overbought territory. On the upside, initial resistance is formed at the 1.1700 level. The next resistance lies near the upper Bollinger Band at 1.1740 (the high of May 13th), where upward attempts may begin to falter. On the downside, immediate support is at the upper Bollinger Band at 1.1652, followed by the August 17th high of 1.1614.
Consider going long on the Euro at 1.1670 today, with a stop loss at 1.1660 and targets at 1.1730 and 1.1740.
Stock Analysis:
Australian ASX 200 Stock Index
Basic Market Overview:
The Australian Securities Exchange (ASX) 200 index fell 16 points, or 0.2%, to close at 9,054 on Wednesday, marking its sixth consecutive decline and a two-week low. Market sentiment remained subdued due to weakness in US stock index futures, rising oil prices, increasing government bond yields, and continued declines in Wall Street chip stocks. Locally, Australian wages rose 3.2% year-on-year in the second quarter, flat compared to the previous quarter, the slowest growth in five quarters, and market caution intensified ahead of July labor data to be released on Thursday. Meanwhile, Reserve Bank of Australia Deputy Governor Andrew Hauser warned that the cash rate may need to be raised again if inflation risks persist, emphasizing that price growth remains "too high."
Technology stocks led the decline, followed by consumer goods, logistics, and financial stocks. Whitehaven Coal fell 2.4% due to weak earnings, while Evolution Mining fell 0.9% despite strong FY26 profits. Three of the four major banks saw their share prices fall by 0.1% to 1.4%. Conversely, Santos rose 2.5% due to higher oil prices and an in-line interim dividend, reflecting its first-half operating free cash flow.
Sector Performance:
Leading Sectors: Healthcare (+2.60%), Energy (+0.77%), Utilities; Energy benefited from higher oil prices, with Santos surging 2.5%; Healthcare was strengthened by heavyweight CSL.
Lagging Sectors:
Lagging Sectors: Information Technology (-3.15%), Consumer Discretionary, Financials; Technology stocks followed the decline in US semiconductor stocks, with most of the four major banks closing lower.
Technical Analysis:
The ASX 200 index closed at 9053.8 on Wednesday, down 16.2 points, or -0.18%, marking its sixth consecutive day of decline and hitting a two-week low. The price broke below the 20-day moving average, fluctuating throughout the day, reaching a high of 9058 and a low of 9027, before recovering some losses slightly at the close. Key drivers: High US Treasury yields and a sharp drop in US chip stocks weakened global risk appetite; rising oil prices fueled inflation concerns. Domestically: Australian Q2 wages rose 3.2% year-on-year, the lowest in five quarters; the RBA Deputy Governor stated that inflation remains high and another rate hike cannot be ruled out; the market awaits Thursday's July employment data to guide interest rate expectations.
The index has declined for six consecutive days and has broken below the 20-day moving average, indicating a short-term bearish trend; however, there is strong support in the 9000-9030 range due to previous high trading volume. Holding above 9025: A period of consolidation and bottoming is likely, testing the 9095-9100 resistance level; a break below 9000: the downside target is the 8940-8900 range. The biggest variable on Thursday: Australia's July employment data. Stronger-than-expected data will amplify expectations of an interest rate hike, putting pressure on the index; weaker employment data could provide a short-term rebound opportunity.
Trading Strategy:
Trading Strategy (Short-Term Perspective)
Bullish Strategy
Avoid chasing highs. Only consider a small long position if a pullback to the 9000-9030 support zone shows signs of bottoming out; set a stop-loss below 8980; first target is 9095-9100, with a break above targeting 9130-9150.
Short Selling Strategy
A rebound to 9095-9100 will likely encounter resistance; consider a small short position. Stop loss above 9135. First target: 9025, a break below that targets 9000, with further downside to 8940.
Wait-and-See Strategy
Volatility will be amplified before the release of employment data. Conservative traders should wait for the data to be released and the direction to become clearer before entering the market to avoid the risk of data gaps.
Key Risk Warnings:
Data Risk: Thursday's Australian employment data will be the biggest disruptor. Strong employment data will strengthen expectations of an RBA rate hike, suppressing the stock market; weaker-than-expected data will stimulate a rebound, potentially leading to gaps.
Overseas Transmission Risk: Continued rise in US Treasury yields and a continued correction in US tech stocks will continue to drag down the ASX200 technology and growth sectors. Rising oil prices will increase inflation expectations, putting pressure on central bank policy.
Earnings Risk: Earnings season is still underway; weaker-than-expected earnings from heavyweight stocks will cause significant volatility in individual stocks and even entire sectors.
Risk of Support Failure: If the 9000 level is decisively broken, the short-term pullback could widen further; avoid blindly buying the dip.
Hong Kong Hang Seng Index
Basic Market Overview:
The Hang Seng Index closed at 25,495 points on Wednesday, virtually unchanged, recovering slightly after earlier declines. Hong Kong Exchanges and Clearing Limited (HKEX) shares rose 1.6% to HK$411.40 after the exchange operator announced strong first-half results. Revenue increased by 19% year-on-year, net profit attributable to shareholders rose by 24%, and the interim dividend increased by 24%, providing support for market sentiment. Meanwhile, Hong Kong and China Gas rose after announcing a 23% increase in first-half profit, helping to support the broader market.
However, gains were limited by a cautious global backdrop. Investors digested a sell-off in tech stocks, high US Treasury yields, higher oil prices, and renewed tensions in the Middle East, factors that dampened risk appetite in Asian markets. Notable moves included Xiaomi (5.1%), Tencent (0.9%), and Meituan (1.9%). In comparison, SMIC and China Unicom fell by 4.6% and 12.8%, respectively.
Sector Performance:
Leading Sectors
Leading sectors: Banking, Oil & Petrochemicals, Gas & Utilities, High-Dividend Defensive Sectors; Hong Kong & China Gas +7.37%, Xiaomi-W +4.81%, with strong performance from mainland banks supporting the market.
Leading Sectors
Leading sectors: Semiconductors, Hardware Equipment, Optical Communication & AI Hardware Chain; Baidu-SW plunged over 11% after earnings, Hua Hong Power plunged nearly 12%, impacted by the pullback in US chip stocks.
Technical Analysis:
Wednesday closing price: 25495.07 points, +23.92 points, +0.09%; Intraday high: 25537.19, low: 25315.32; Hang Seng Tech Index: 4682.05 points, -1.21%, with significant divergence within the tech sector; Total market turnover: HK$253.175 billion; Net outflow of southbound funds: HK$106.21 billion. HK$100 million, with mainland investors taking profits at higher levels; Market characteristics: The index has rebounded slightly for three consecutive days, but this is a rotation among heavyweight stocks to support the market; traditional value stocks are resilient, while growth and technology stocks are under pressure; Trading volume has not increased significantly, indicating that the rebound is a zero-sum game with limited bullish momentum.
Technical analysis for Thursday: Short-term strong resistance: 25570-25600 range, the level where Wednesday's rally met resistance, is the first strong hurdle for the short-term rebound. A sustained break above this level with significant volume is needed to open up further upward potential. Key support/resistance level: 25440 points. A close above this level maintains a slightly bullish bias; a decisive break below this level would weaken the rebound. First support: 25310-25320, Wednesday's low. A pullback to this level with reduced volume indicates continued short-term support. Strong support: 25170-25200, the bottom line for the bulls. A break below this level with significant volume would signal the end of this short-term rebound. Thursday's Market Scenario Prediction—Optimistic Scenario: A firm hold above 25440, followed by an upward test of the 25570-25600 resistance level. This requires a combined drive from financial and blue-chip stocks, along with increased trading volume. Neutral Scenario: Fluctuations between 25320-25570, with continued sector rotation and a continued divergence between high-dividend defensive stocks and technology growth stocks. Pessimistic Scenario: A significant drop below 25310 on high volume, further testing the strong support level of 25170-25200, ending the rebound and returning to a correction phase.
Trading Strategy:
Operational Strategy (Short-Term Perspective):
Range-bound trading, avoid chasing highs.
When the rebound approaches the 25550-25600 resistance zone: Avoid going long. Existing long positions can be reduced to lock in profits, waiting for a pullback before considering buying on dips.
A pullback to the 25310-25320 support level is expected. Observe for signs of a bottoming out with decreasing volume. A small position can be taken for a rebound, suitable for quick in-and-out short-term trading. If the price breaks below this level with high volume, abandon any long positions.
Key Risk Warnings:
Overseas Risks: Volatility in the US technology and chip sectors will directly impact Hong Kong stocks; changes in Fed policy expectations and a stronger dollar will suppress valuations of Hong Kong growth stocks.
Funding Risks: Continuous outflow of southbound funds and insufficient incremental funds limit the rebound's height. The sustainability of the rebound is questionable in a low-volume environment.
Fundamental Risks: Hong Kong stock interim results are being released gradually. Lower-than-expected results from some internet and technology companies will impact individual stocks.
Geopolitical and external news disturbances can easily cause rapid intraday gaps in the index.
Disclaimer: The information contained herein (1) is proprietary to BCR and/or its content providers; (2) may not be copied or distributed; (3) is not warranted to be accurate, complete or timely; and, (4) does not constitute advice or a recommendation by BCR or its content providers in respect of the investment in financial instruments. Neither BCR or its content providers are responsible for any damages or losses arising from any use of this information. Past performance is no guarantee of future results.
More Coverage






2026 © - All Rights Reserved by BCR Co Pty Ltd
Risk Disclosure:Derivatives are traded over-the-counter on margin, which means they carry a high level of risk and there is a possibility you could lose all of your investment. These products are not suitable for all investors. Please ensure you fully understand the risks and carefully consider your financial situation and trading experience before trading. Seek independent financial advice if necessary before opening an account with BCR.
BCR Co Pty Ltd (Company No. 1975046) is a company incorporated under the laws of the British Virgin Islands, with its registered office at Trident Chambers, Wickham’s Cay 1, Road Town, Tortola, British Virgin Islands, and is licensed and regulated by the British Virgin Islands Financial Services Commission under License No. SIBA/L/19/1122.
Open Bridge Limited (Company No. 16701394) is a company incorporated under the Companies Act 2006 and registered in England and Wales, with its registered address at Kemp House, 160 City Road, London, England, EC1V 2NX. Open Bridge Limited acts solely as a payment processor for BCR Co Pty Ltd and does not provide any financial, trading, or investment services on its behalf. Open Bridge Limited's role is limited to payment processing.


 English
 简体中文
简体中文
 繁體中文
繁體中文
 Bahasa
Melayu
Bahasa
Melayu
 Tiếng
Việt
Tiếng
Việt
 ไทย
ไทย
 日本語
日本語
 한국어
한국어
 ភាសាខ្មែរ
 español