


0
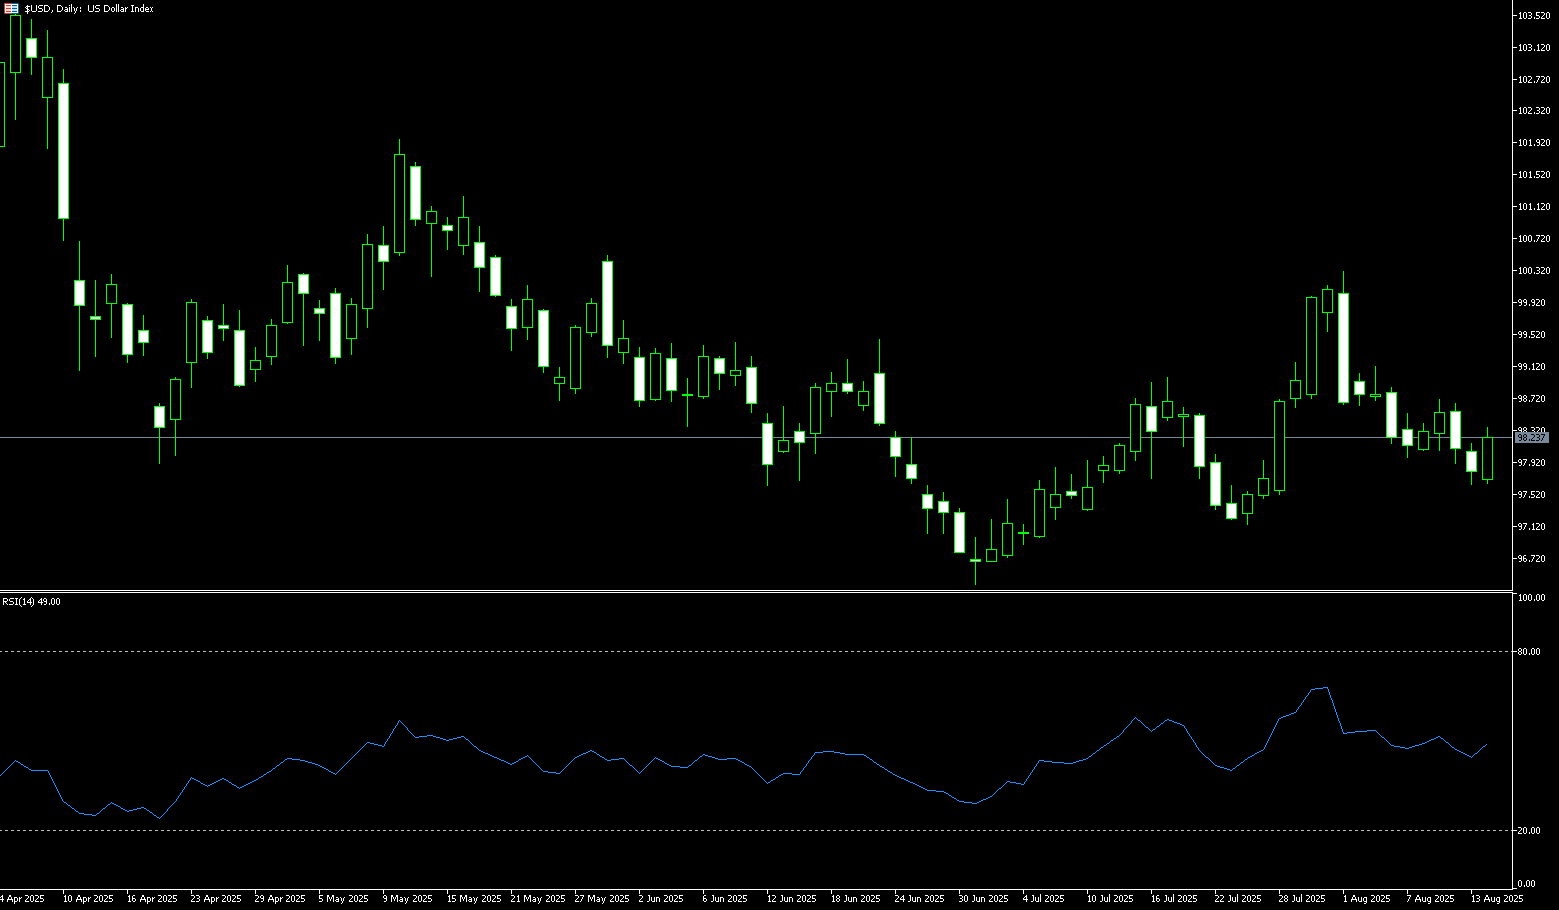
US Dollar Index
The US dollar continued its decline this week after US inflation data reinforced market expectations for a Federal Reserve rate cut next month. US President Trump renewed pressure for a rate cut, further exacerbating the dollar sell-off. US Treasury Secretary Jeffrey Benson called for a "series of rate cuts" on Wednesday and suggested the Fed could begin its easing campaign with a 50 basis point cut. The day before, Trump, who has repeatedly criticized Fed Chairman Powell for not cutting rates sooner, intensified the pressure. Trump, in turn, intensified his criticism of Powell. The administration even proposed legal action over the renovation of the Fed headquarters. This political interference could undermine the central bank's credibility and further pressure the dollar. This move reflects an increase in bearish sentiment as traders price in aggressive policy easing.
With a fully priced-in Fed dovish outlook and intensifying political noise, the US dollar index remains under pressure. The most likely path for the dollar remains down. Technical breakdowns and a compressed yield curve further support the dollar's near-term bearish outlook. On the daily chart, the US dollar index briefly broke below its 50-day moving average at 98.13 and is currently testing near-term support at 97.63 (Thursday's low). A continued decline would raise downside risk to the July 28 low of 97.49 and further to 97.00. Resistance lies at the 20-day moving average at 98.35 and Tuesday's high at 98.62.
Today, consider shorting the US dollar index at 98.30, with a stop-loss at 98.40 and targets at 97.90 or 97.80.
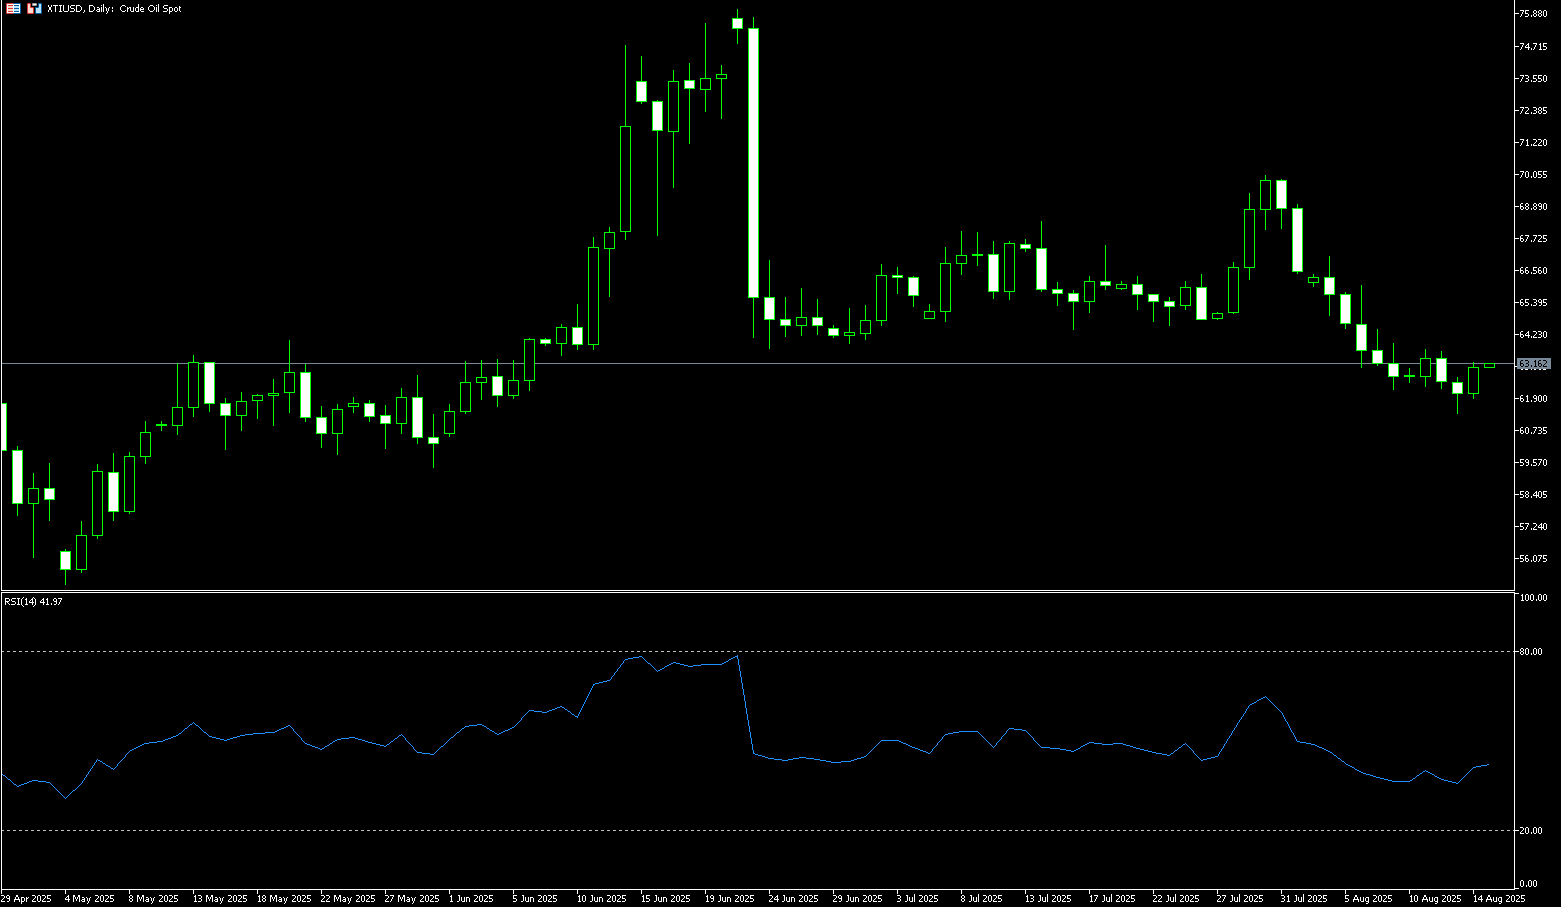
WTI Spot Crude Oil
WTI crude oil traded around $63.00 per barrel on Wednesday, hitting a new low in more than two months. This followed pessimistic supply guidance from the US government and the International Energy Agency, while investors focused on US President Trump's threat that Russian President Vladimir Putin would face "severe consequences" if he obstructed peace in Ukraine. Crude oil exports remain sluggish due to tariffs, and continued declines could weigh on prices. The IEA raised its oil supply growth forecast for this year on Wednesday, but lowered its demand forecast. Meanwhile, OPEC+ raised its global oil demand forecast for next year in its monthly report released on Tuesday, while lowering its supply growth forecast for the United States and other non-OPEC producers, suggesting a tighter market. The market is also closely watching the upcoming meeting between US President Trump and Russian President Vladimir Putin in Alaska on Friday. Although the summit will focus on the Russia-Ukraine conflict, analysts do not expect additional sanctions on Russian crude oil.
With WTI crude oil below its 50-day moving average (66.40) and 100-day moving average (64.26), and with bearish fundamentals (increasing supply, weak demand, and stable Russian exports), WTI crude oil could fall further. The 14-day relative strength index (RSI) is below 40.00, indicating a weak market bias. The next downside target is $61.35, a near three-month low, followed by $60.00, a psychologically important level. If crude oil prices can recover above the 5-day moving average of $62.56 and Thursday's low of $62.66, they could rally above the 100-day moving average of $64.26 and this week's high of $64.43 in the short term.
Consider going long on crude oil at $62.95 today. Stop-loss: $62.75, target: $64.60, $64.80.
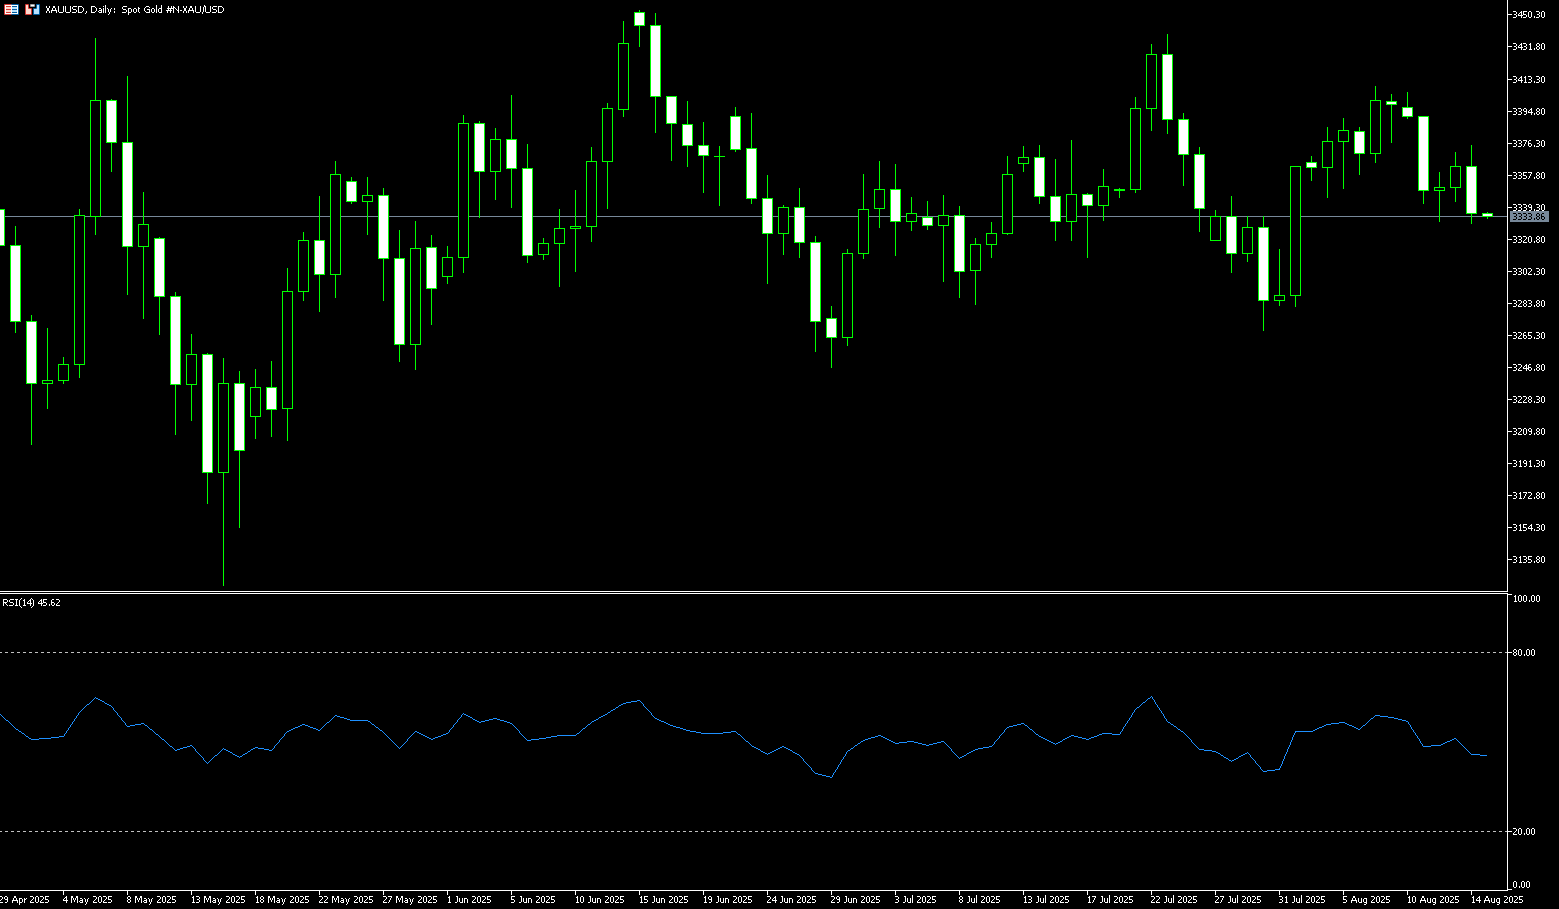
Spot Gold
Gold reversed from last week's high just above $3,400 to trade in the $3,335-$3,340 range. The US dollar index hit a new low in more than two weeks, making gold cheaper for overseas buyers, while the benchmark 10-year Treasury yield fell. Gold prices strengthened as expectations of a September Fed rate cut rose following mild CPI data and weak July non-farm payrolls. Geopolitically, European and Ukrainian leaders will meet with Trump before his meeting with Russian President Vladimir Putin, while China and the US extended their tariff truce for 90 days. The continued weakness of the US dollar index and falling US Treasury yields provided support for gold prices. However, the continued record highs of US stocks and the potential easing of geopolitical tensions have somewhat dampened gold's safe-haven demand.
The daily chart shows a small doji candlestick formed on August 12, indicating market hesitation after the sharp drop on August 11. Spot gold may now test resistance at $3,400 per ounce (round-number mark) and $3,409 (this week's high). On the other hand, it is currently stabilizing near support at $3,331 (this week's low) and $3,332 (the 80-day simple moving average). A break below these support levels could lead to a decline to the range between $3,302.50 (the 100-day simple moving average) and the psychological level of $3,300. Given the recent stabilization in gold prices, further gains towards $3,400 (round-number mark) and $3,409 (this week's high) are possible. A break below this level points to strong resistance at $3,439-3,450, the July 23 low.
Consider a long position in gold at $3,330 today, with a stop-loss at $3,325 and targets at $3,350 and $3,355.
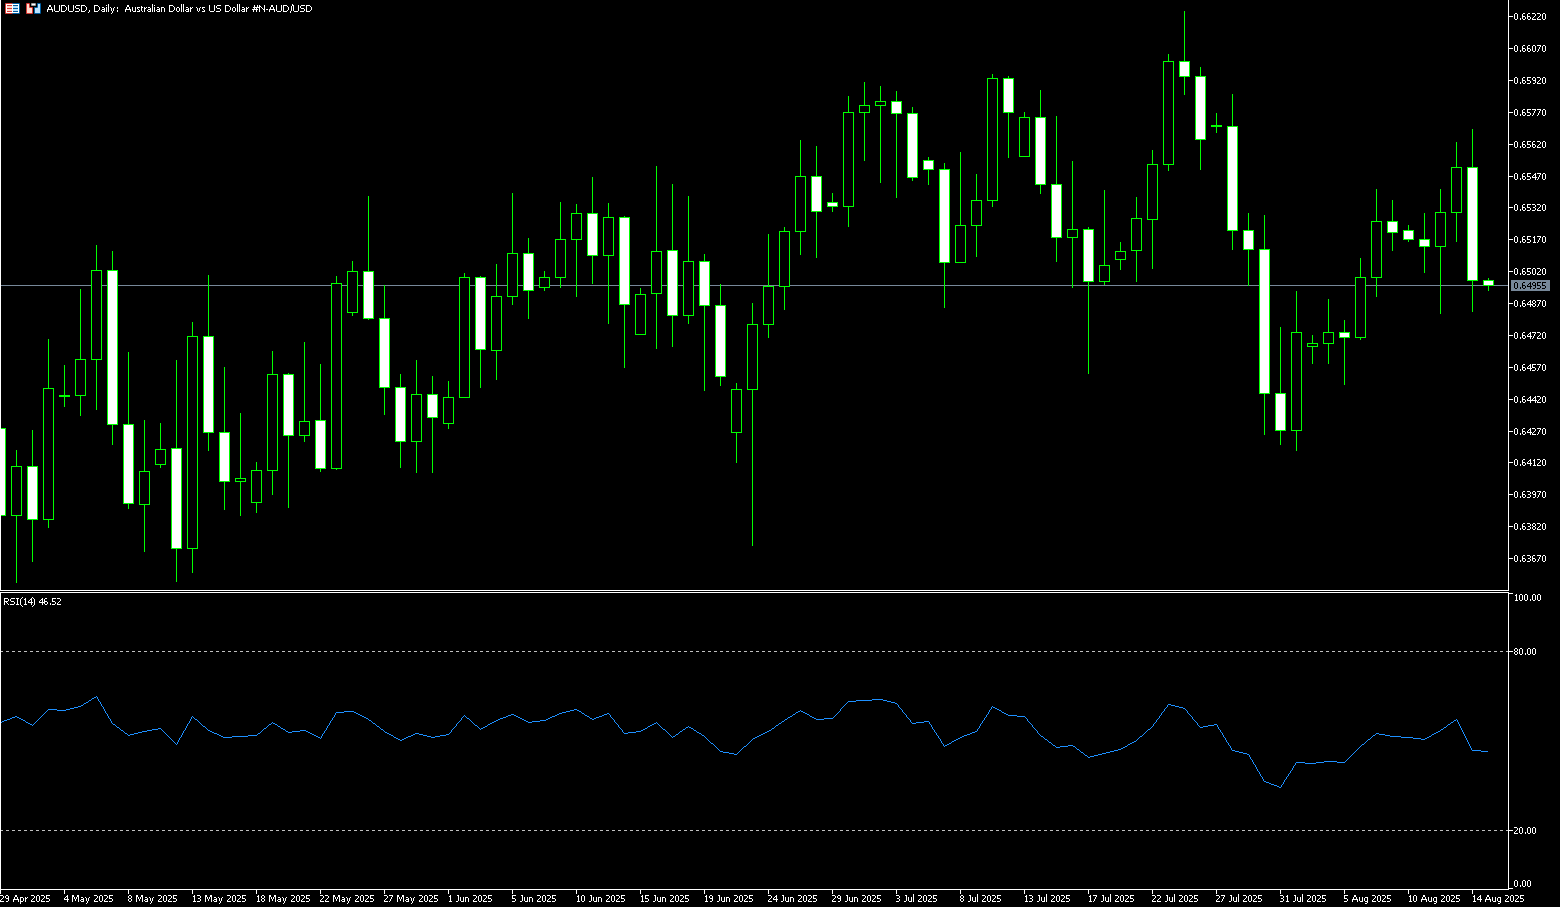
AUD/USD
During Thursday's trading session, AUD/USD fell below $0.6500. Despite positive Australian labor market data for July, the Australian dollar remained underperforming and under pressure. A strong jobs report indicated a resilient labor market. Australia's unemployment rate fell to 4.2% in July from 4.3% in June, in line with forecasts and reversing the previous month's highest level since late 2021. The decline reflected a 10,200 decrease in the number of unemployed to 649,600 and a 24,500 increase in employed people to 14.64 million, slightly below expectations for a 25,000 increase. These data were released against the backdrop of the Reserve Bank of Australia's decision to cut interest rates in August, citing slowing inflation and a recent rise in the unemployment rate. However, the latest employment data suggests a still tight labor market, and most economists expect the central bank to wait until November, when another quarter of inflation data will be available. Meanwhile, continued weakness in the US dollar has fueled bets on a September Fed rate cut, adding momentum to the Australian dollar.
AUD/USD traded around 0.6500 on Thursday. Technical analysis on the daily chart suggests a significant ongoing bullish bias. The pair remains above its 5-day simple moving average, suggesting strengthening short-term momentum. The 5-day (0.6533) and 50-day (0.6520) moving averages have formed a bullish "golden cross" pattern. Furthermore, the 14-day Relative Strength Index (RSI) has risen above 50, confirming the bullish market bias. The pair could target the upper line of the ascending channel, around 0.6590. A breakout above this channel could strengthen the bullish bias and support the pair's pursuit of the psychologically important 0.6600 area, followed by the nine-month high of 0.6625 reached on July 24. On the downside, AUD/USD could test the 0.6500 round-figure mark. A successful break below this critical support area would weaken short- and medium-term price momentum and prompt the pair to test last week's low of 0.6449.
Consider a long AUD at 0.6483 today, with a stop-loss at 0.6470 and targets at 0.6540 and 0.6550.
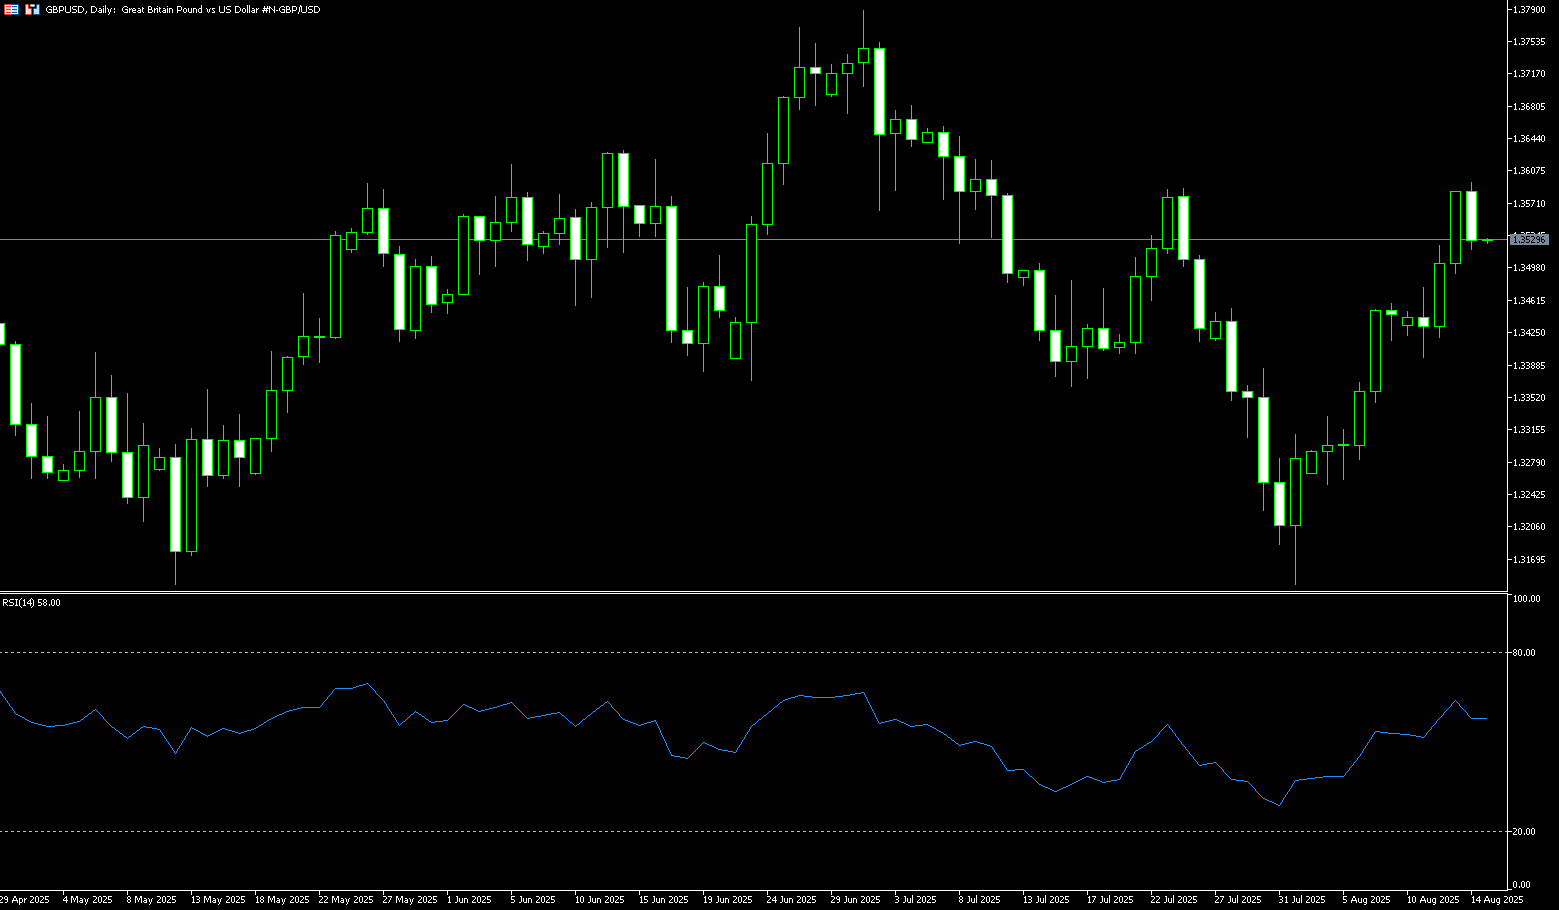
GBP/USD
GBP/USD retreated during North American trading hours as a strong US inflation report prompted traders to reduce bets on a Fed rate cut at its September meeting, falling 0.21%. At press time, the pair was trading at 1.3545, having hit an intraday high of 1.3594. The US Producer Price Index (PPI) rose 0.9% month-over-month in July, up from 0% the previous month. However, the year-over-year reading rose 3.3%, exceeding expectations for a 2.5% increase and up from 2.3% in June. The core PPI, used to calculate the personal consumption expenditures (PCE) price index, surged to 3.7% year-over-year, significantly accelerating from the 2.6% increase in the previous month. The report suggests that businesses are indeed passing on the impact of tariffs to consumers. Further data boosted the US dollar.
On the daily chart, buyers appear to be taking control and gaining momentum after breaking above the 14-day SMA at 1.3435 and the 20-day SMA at 1.3415. Furthermore, the 14- and 20-day SMAs formed a bullish "golden cross" pattern, while the 14-day relative strength index (RSI) showed a bullish trend, further confirming GBP/USD's bullish bias. The next area of focus will be the psychological 1.3600 level. If broken, the next target would be the July 4 high of 1.3681, followed by the 1.3700 level. Conversely, if GBP/USD falls below the 5-day SMA at 1.3506, sellers could push the exchange rate down to 1.3500 and retest the 14-day SMA at 1.3435.
Consider going long on the British pound at 1.3520 today, with a stop-loss at 1.3510 and targets at 1.3565 and 1.3570.
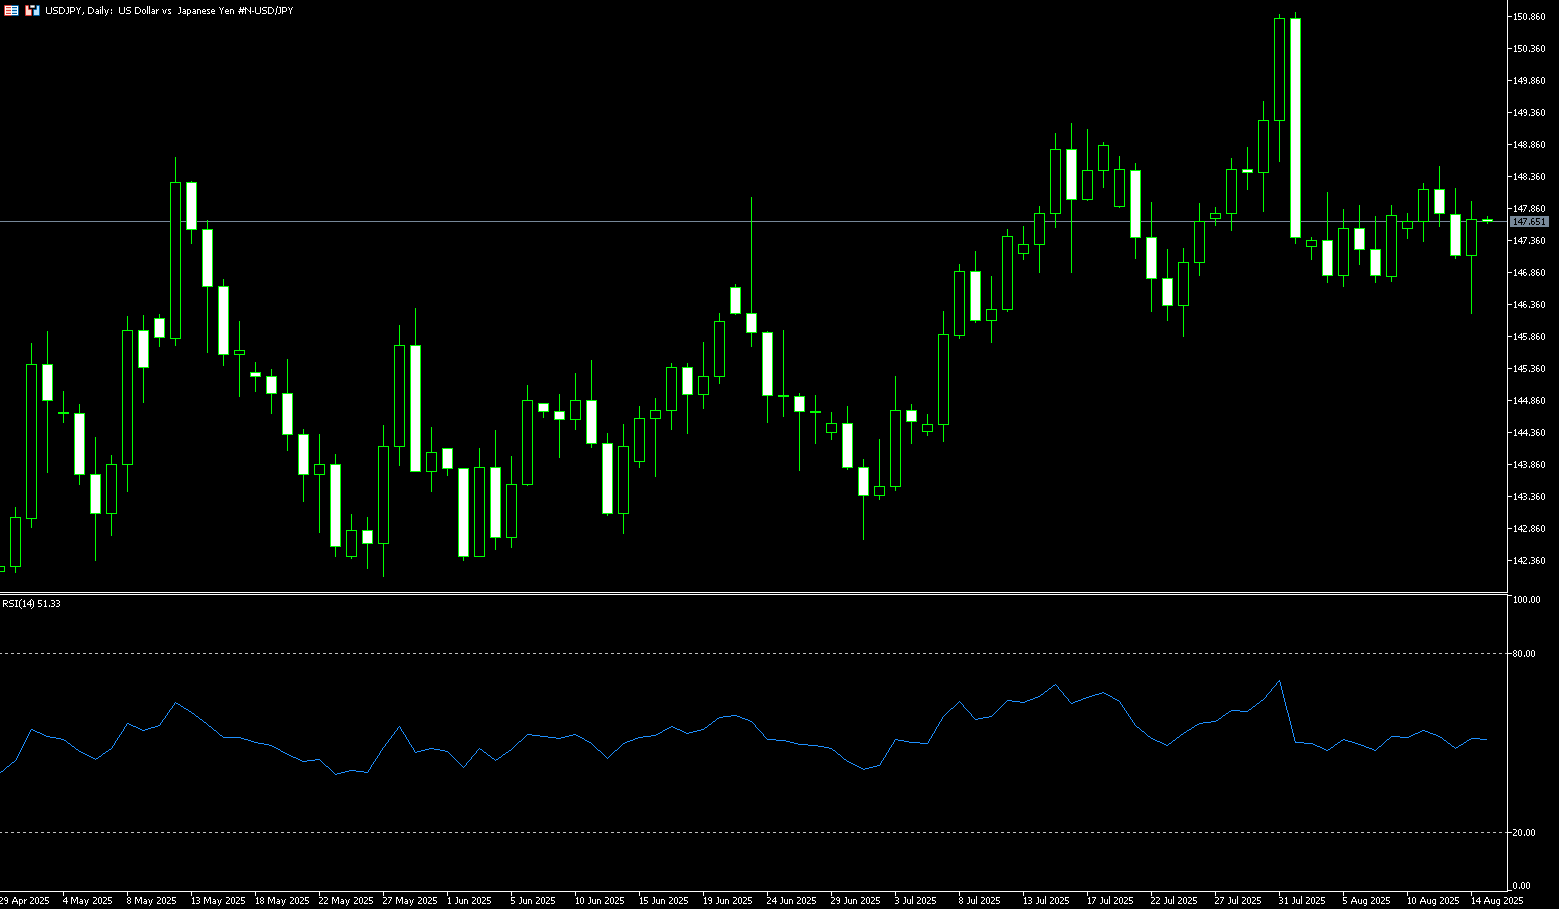
USD/JPY
The yen briefly appreciated to around 146.37 per dollar on Thursday, its highest level in three weeks, as expectations of a Federal Reserve rate cut this year weighed on the greenback. Softer US inflation data suggested that President Trump's tariffs had not exacerbated price pressures, while signs of a cooling labor market reinforced the dovish outlook. US Treasury Secretary Scott Bessant fueled the momentum, calling for multiple rate cuts and suggesting the Fed could start with a 50 basis point cut. Domestically, the Bank of Japan is under pressure to abandon its inflation measurement tied to domestic demand and wage growth, limiting further policy tightening. Bank of Japan Governor Kazuo Ueda maintained a cautious stance, noting that "underlying inflation" remains below the central bank's 2% target.
From a technical perspective, a break below the 200-period simple moving average at 147.52 on the 4-hour chart could be seen as a fresh trigger for USD/JPY bearishness. However, the 14-hour relative strength index (RSI) on the 4-hour chart is nearing oversold territory, suggesting waiting for some intraday consolidation or a modest rebound before positioning for a deeper decline. That said, any rebound attempt is likely to attract new sellers and be capped near the support-turned-resistance level at the 148 round number. The latter should now serve as a key pivot point, and a decisive break could trigger a short-term correction towards the 149 area. Alternatively, USD/JPY appears poised to test below the 147.00 level (round number), before falling further to the next relevant support level at 146.00 (July 24 low). A downward trajectory could eventually drag spot prices to the psychologically challenging 145.00.
Consider shorting the USD at 148.00 today. Stop-loss: 148.25, target: 146.90, 146.80.
EUR/USD
EUR/USD fell sharply on Thursday as the latest US inflation report surprised traders who had been betting on a slim chance of a 50 basis point rate cut by the Federal Reserve in September. The pair is currently trading at 1.1638, down 0.57%. The US Bureau of Labor Statistics (BLS) revealed a sharp acceleration in the Producer Price Index (PPI) in both headline and core figures, primarily driven by higher US tariffs. Meanwhile, the Department of Labor (DoL) reported a decline in unemployment claims compared to its previous reading. The euro briefly rose above $1.1700, its highest level in nearly three weeks. In Europe, eurozone GDP grew by 0.1% in the second quarter, while inflation stabilized at 2% in July. Trade risks remain as the EU faces 15% tariffs on many products exported to the US.
In recent weeks, EUR/USD has maintained its upward trend, currently trading below the 1.1700 level. Buyer momentum is dominant, as indicated by the 14-day relative strength index (RSI). A daily close above this level could pave the way for a test of this week's current high of 1.1730, followed by 1.1750. A break above the latter would expose 1.1800 and the year-to-date high of 1.1830. Conversely, if EUR/USD ends the trading day below 1.1700, sellers will look to test the 20-day simple moving average at 1.1631 in the short term. Below this level lies the round number mark at 1.1600. A break of these levels would open up further downside towards 1.1550.
Today, you can consider going long on EUR at 1.1635, stop loss: 1.1625, target: 1.1690; 1.1700

Disclaimer: The information contained herein (1) is proprietary to BCR and/or its content providers; (2) may not be copied or distributed; (3) is not warranted to be accurate, complete or timely; and, (4) does not constitute advice or a recommendation by BCR or its content providers in respect of the investment in financial instruments. Neither BCR or its content providers are responsible for any damages or losses arising from any use of this information. Past performance is no guarantee of future results.
More Coverage


Risk Disclosure:Derivatives are traded over-the-counter on margin, which means they carry a high level of risk and there is a possibility you could lose all of your investment. These products are not suitable for all investors. Please ensure you fully understand the risks and carefully consider your financial situation and trading experience before trading. Seek independent financial advice if necessary before opening an account with BCR.

 English
 简体中文
简体中文
 繁體中文
繁體中文
 Bahasa
Melayu
Bahasa
Melayu
 Tiếng
Việt
Tiếng
Việt
 ไทย
ไทย
 日本語
日本語
 한국어
한국어
 ភាសាខ្មែរ
 español