


0
US Dollar Index
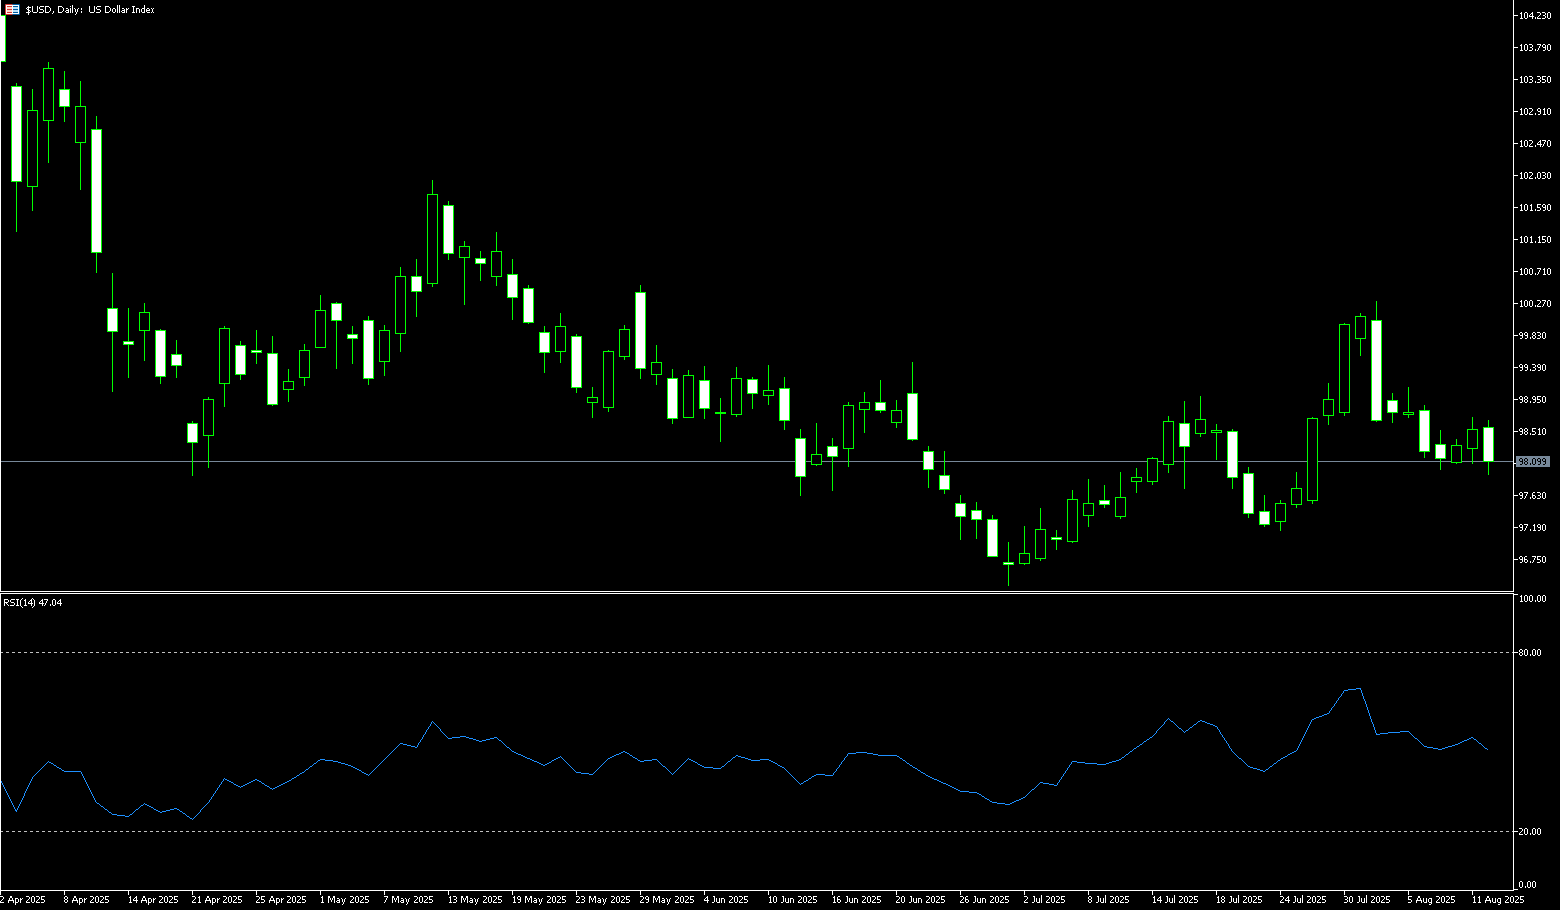
The US dollar index fell to 98.00 on Tuesday, continuing its sharp decline since hitting a two-month high of 100 on July 31st. Recent economic data reinforced market expectations for a September rate cut by the Federal Reserve. Headline inflation remained at 2.7%, slightly below the expected 2.8%, although core inflation rose to a six-month high of 3.1%. Due to a sharp decline in payrolls and a downbeat ISM Purchasing Managers' Index, interest rate traders increased their bets on a 25 basis point rate cut at the Fed's next meeting, putting pressure on the dollar against other G10 currencies. Meanwhile, President Donald Trump extended the US-China truce by 90 days to provide more time for negotiations. Elsewhere, weak UK wage figures prevented further declines in the dollar index. If other global central banks continue to cut interest rates, traders may view any pullback to around 98.00 as a potential buying opportunity.
The daily chart shows that the US dollar index remains within an ascending channel pattern, indicating a sustained bullish bias. On the upside, the market is viewing 98.67 (Monday's high) and 98.81 (9-day simple moving average) as key pivot points. A clean break above these levels could trigger a push towards strong resistance near 99.00 (round number), and above 99.46 (100-day simple moving average). Initial support lies at the psychological level of 98.00, followed by the lower line of the ascending channel around 97.70. A further break below this level would confirm the bearish bias and exert downward pressure on the US dollar index, potentially targeting the three-year low of 96.38 set on July 1.
Consider shorting the US Dollar Index at 98.20 today, with a stop loss at 98.30 and a target of 97.70 or 97.60.
WTI Spot Crude Oil
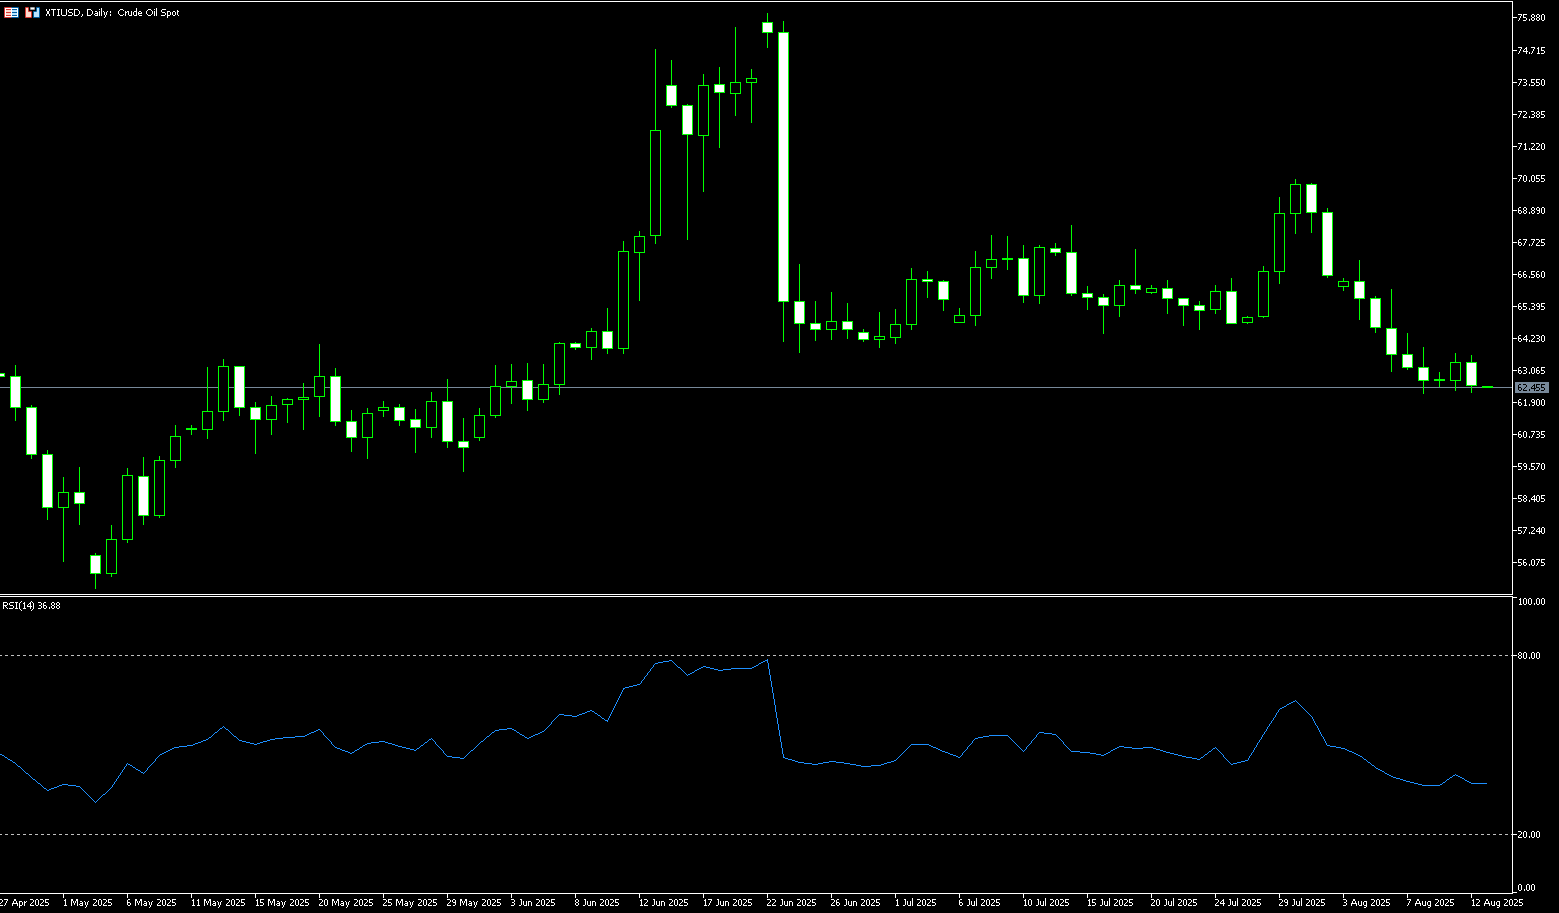
WTI crude oil fell to $62.50 per barrel on Tuesday, nearing the two-month low of $62.20 reached last week, as President Trump extended the US-China tariff truce for 90 days. Investors awaited US-Russia talks on Ukraine. Trump downplayed hopes of a breakthrough, calling the meeting an opportunity to "explore" peace prospects, while Ukrainian President Volodymyr Zelensky rejected any negotiations on territorial cession. An agreement could help ease risks to Russian oil supplies, but uncertainty remains. OPEC forecasts a tighter oil market in 2026 due to stronger demand and slower non-OPEC production growth. Focus shifts to monthly reports from the US Department of Energy and the International Energy Agency for clues on market balance. Meanwhile, US inflation data reinforced expectations that the Federal Reserve may soon cut interest rates.
The daily chart shows that WTI crude oil is developing bearish momentum below long-term resistance at $70.00 (a psychological level) and $70.02 (the July 30 high). Prices have broken out of a symmetrical triangle pattern, establishing negative price action. A decisive break below the psychological support level of $60.00 would confirm the start of the next bearish trend. On a broader, longer-term timeframe, oil prices remain within a descending channel, suggesting continued volatility. This short-term price action reflects the ongoing tug-of-war between bullish momentum and bearish pressure in the market as prices break out of the symmetrical triangle. Crude oil's latest decline is currently consolidating between $62.00 and $62.20. If these levels are broken, key support levels will be $61.60 (the June 4 low). A further test of $60.00 (the psychological level) is possible. If $62.60 holds and WTI climbs back to $64.42 (the 100-day moving average), the market could see a resurgence. A break below this level could lead to $65.76 (50.0% Fibonacci retracement).
Consider going long on crude oil at $62.30 today. Stop-loss: $62.10, target: $64.00, $64.30.
Spot Gold
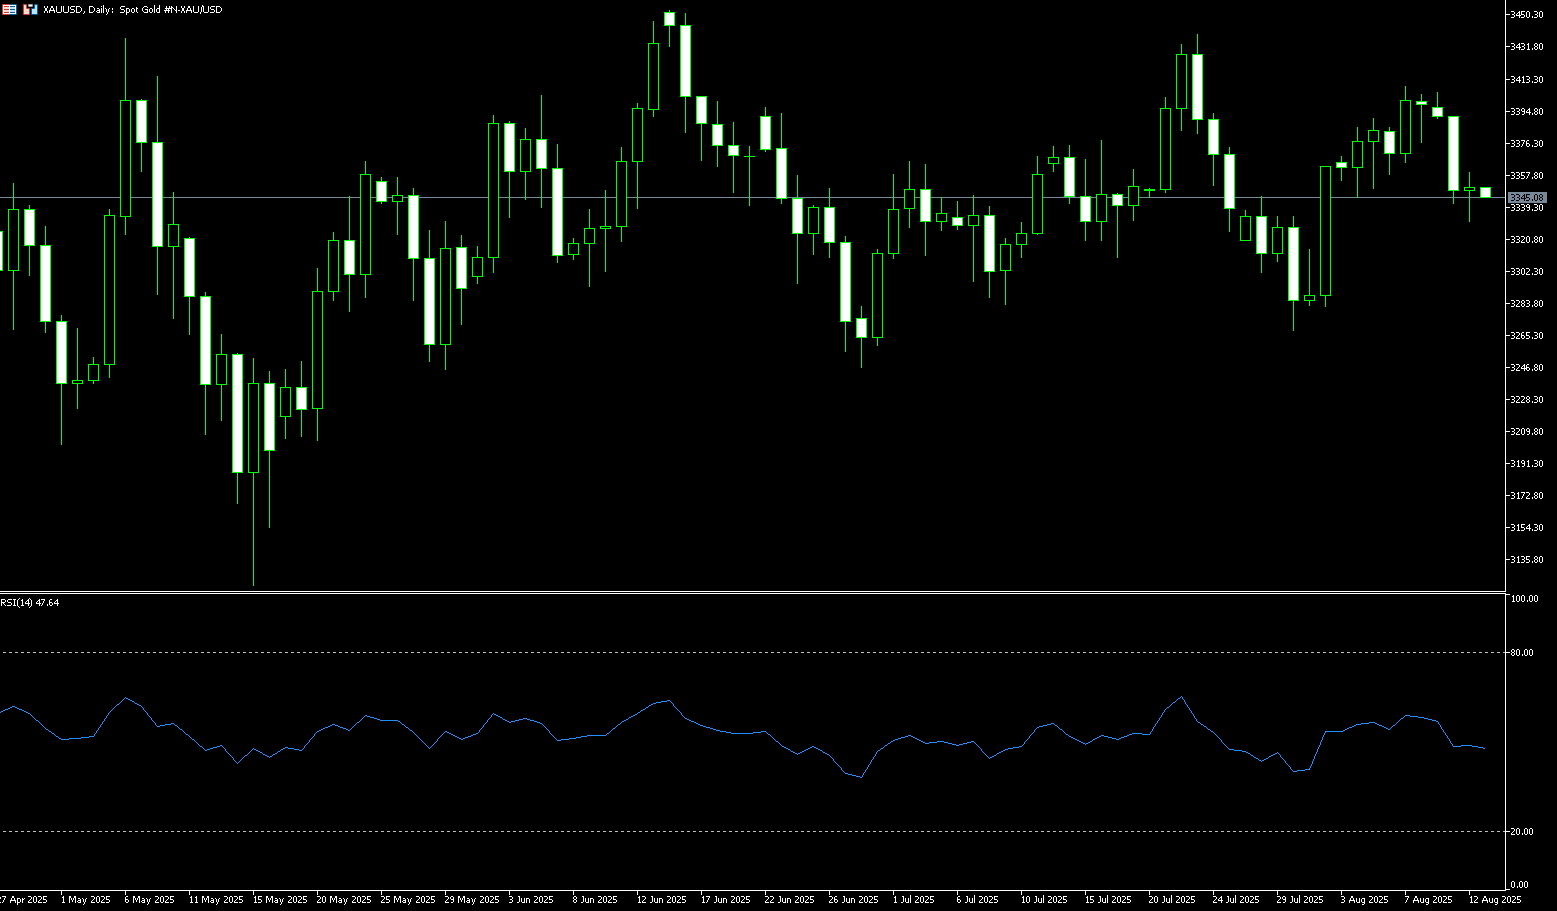
Spot gold is hovering around $3,350 per ounce as traders digest the latest US CPI report, which reinforces expectations of a Federal Reserve rate cut next month. Annual inflation remained at 2.7% in July, below the forecast of 2.8%, while core inflation accelerated to 3.1%, exceeding expectations. The data suggests that tariff-related inflationary pressures remain contained, giving the Fed room to cut interest rates by 25 basis points in September. The probability of a rate cut was 88% last night and has now risen to nearly 93%. Meanwhile, the US President posted on social media, "Gold will not be subject to tariffs!" but provided no further details. Last week, the Financial Times reported that U.S. Customs and Border Protection (CBP) ruled that one-kilogram and 100-ounce gold bars should be classified as taxable, contradicting industry expectations. This news sent New York gold futures prices to a record high and widened the London-New York premium.
Technically, gold prices began the week under pressure, continuing last week's failure to break through the psychologically important $3,400 level. On the daily chart, gold is facing selling pressure at the uptrend line of an ascending triangle pattern. Although it briefly broke below this trendline in late July, the lack of follow-through has kept the overall bullish structure intact. Currently, the price is finding support near the 50-day simple moving average, at $3,350. A break below this level could lead to further testing of the psychologically important $3,300 level and the 100-day simple moving average at $3,295.70. The relative strength index (RSI) has retreated to the neutral level of 50, indicating a lack of strong directional momentum. The Moving Average Convergence-Divergence (MACD) indicator maintains a slightly bullish bias. Looking to the upside, $3,400 remains the first resistance level for buyers, a break of which could open the way for a move towards $3,450 and a retest of the all-time high of $3,500.
Consider going long on gold at $3,343 today, with a stop-loss at $3,340 and targets at $3,365 or $3,370.
AUD/USD
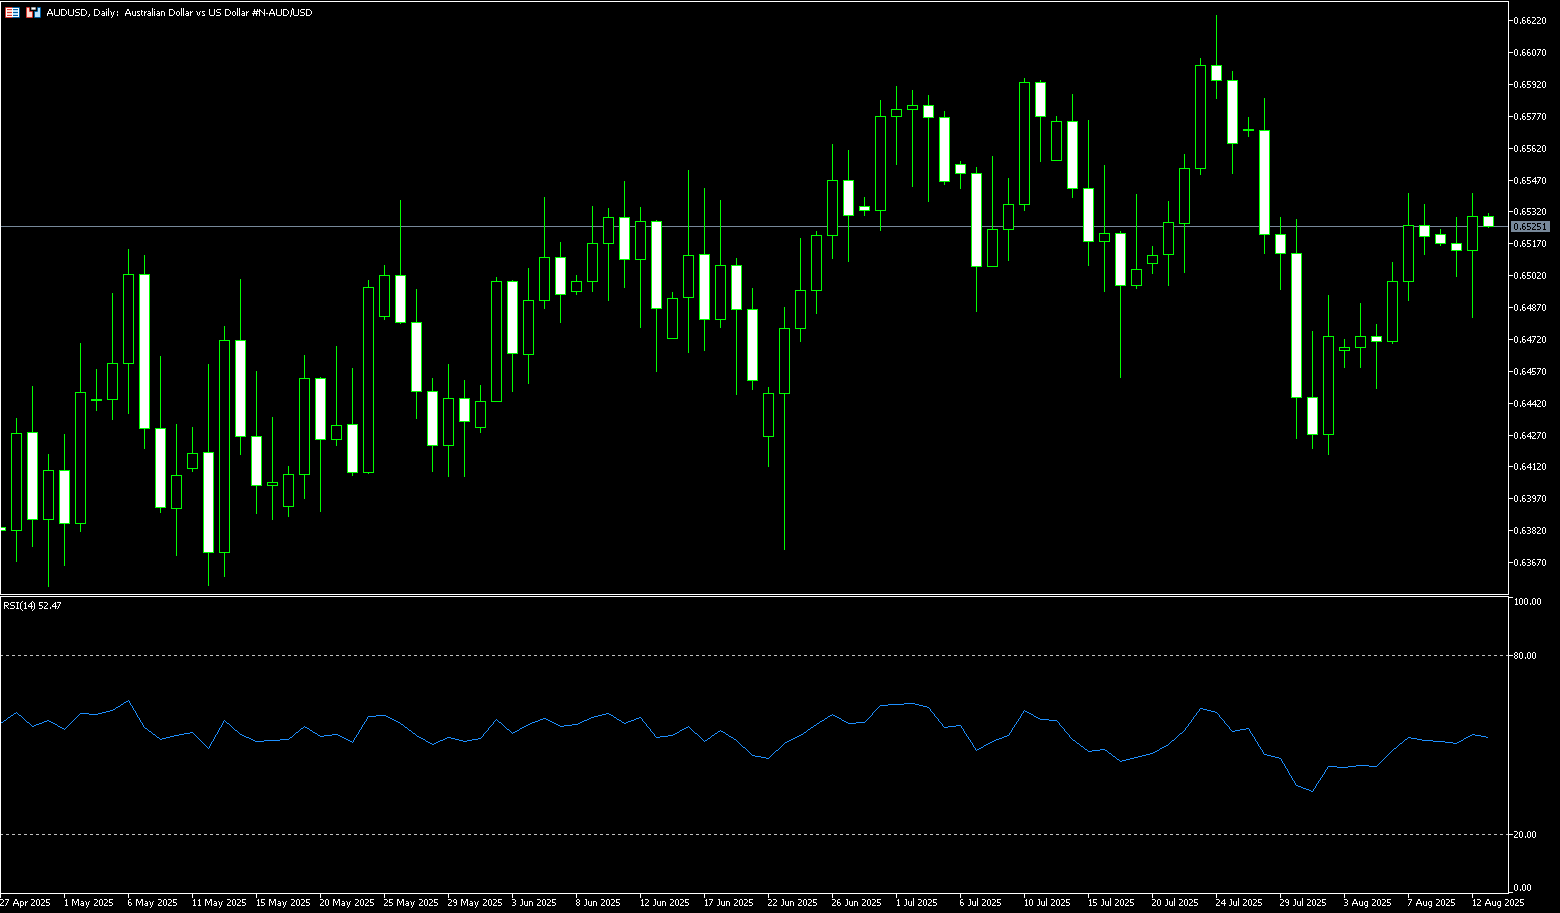
On Tuesday, the Reserve Bank of Australia (RBA) cut its benchmark interest rate by 25 basis points (bps) to 3.6%, as expected. Following the aforementioned comments, AUD/USD remained consolidating above $0.6500, following the previous day's decline as market sentiment shifted to cautious optimism, driven by the extension of the US-China trade truce and anticipation ahead of the Reserve Bank of Australia's policy decision. The 90-day extension of the US-China trade truce, intended to ease tensions and allow for continued negotiations, is seen as a positive move to avoid further escalation in the ongoing trade dispute. The Trump administration agreed to postpone the implementation of broad tariffs on China, Australia's close trading partner, for 90 days, just hours before the previous agreement between the world's two largest economies was set to expire. In response, China's Ministry of Commerce announced it would suspend additional tariffs on US goods for the same period, following Trump's executive order extending the tariff truce.
The Australian dollar traded around 0.6520 against the US dollar on Tuesday. Technical analysis on the daily chart suggests a weakening bullish bias as the pair tested the lower line of the ascending channel. The 14-day relative strength index (RSI) is above 50, indicating a neutral market bias. Further movement will indicate a clear directional trend. However, the pair remains above the 9-day exponential moving average of 0.6491, suggesting strong short-term momentum. On the upside, the pair could explore the upper line of the ascending channel at 0.6570 and the 0.6576 area, the 76.4% Fibonacci retracement level from 0.6625 to 0.6420. A successful break above this level could strengthen the bullish bias and support the pair's exploration of the psychologically important area around 0.6600. Meanwhile, AUD/USD is testing immediate support at its 9-day exponential moving average at 0.6491, which aligns with the lower line of the ascending channel at 0.6494. A break below this critical support area would weaken short- and medium-term price momentum and exert downward pressure on the pair, potentially testing last week's low of 0.6449, followed by the 0.6400 level.
Consider a long position on the Australian dollar at 0.6520 today, with a stop-loss at 0.6510 and targets at 0.6560 or 0.6570.
GBP/USD
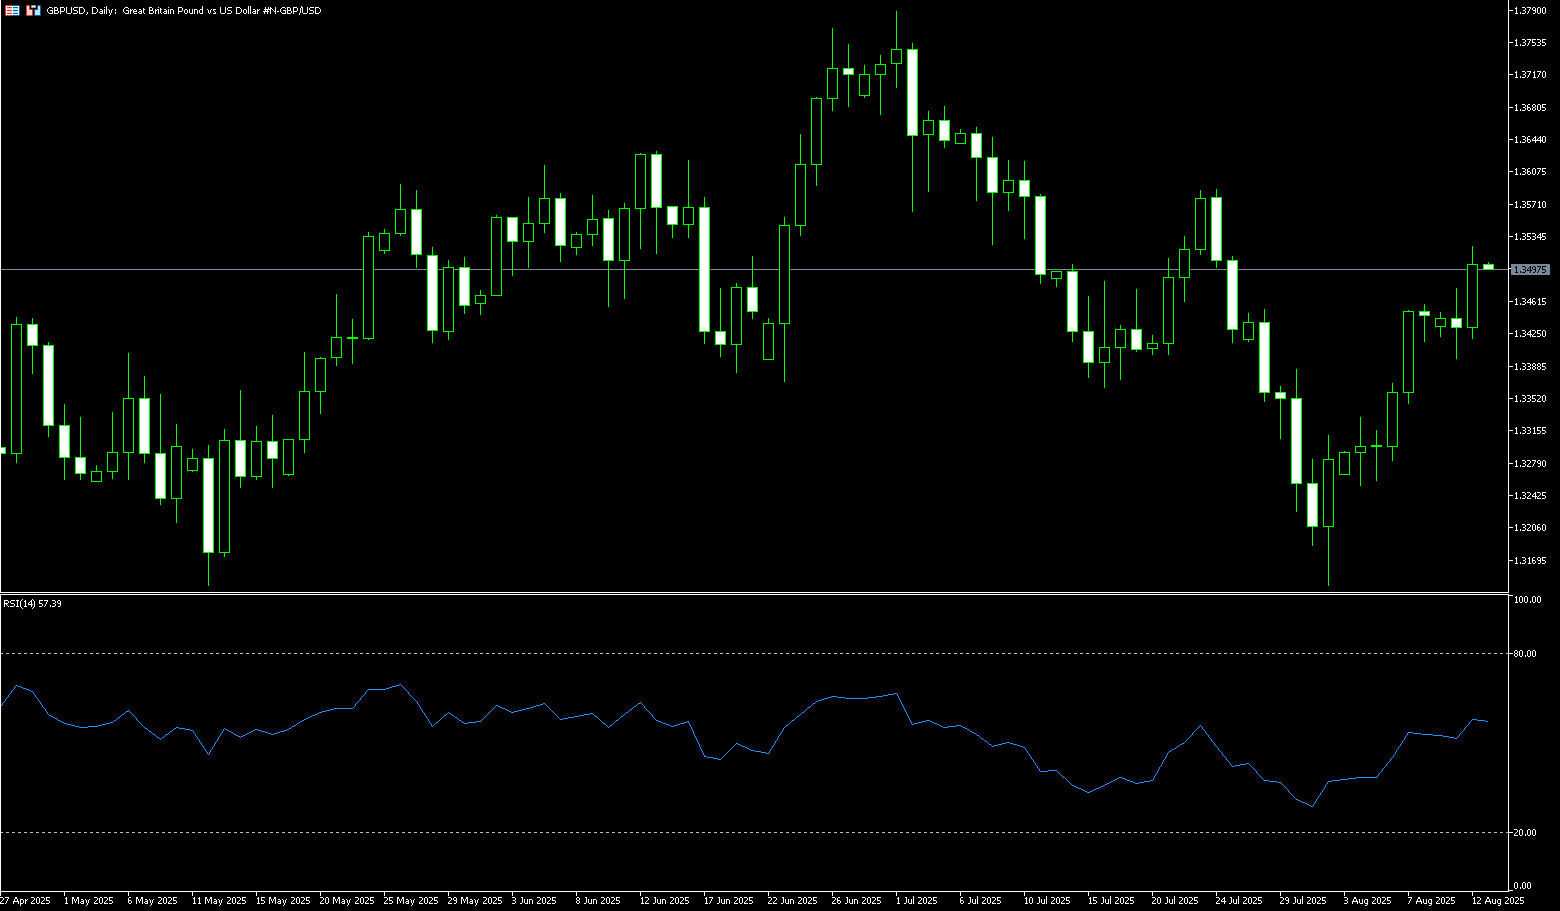
The British pound strengthened further against the US dollar on Tuesday, with GBP/USD trading higher following the release of mixed UK labor market data and the latest US inflation figures. Although signs of slowing UK job growth were offset by strong wage growth, a weaker dollar following the CPI report helped support the currency pair, as traders raised expectations that the Federal Reserve would resume accommodative monetary policy as soon as September. GBP/USD traded near the psychological level of 1.3485, rising on the release of US inflation data, extending gains from the European session. Meanwhile, the US dollar index came under pressure, hovering near a two-week low of around 98.05. Last Thursday, the Bank of England cut its bank rate by 25 basis points to 4%. Markets are divided on the probability of a December rate cut, with a 76% probability. Forecasts suggest the unemployment rate will remain at 4.7%, while preliminary GDP figures are expected to slow sharply to 0.1% in the second quarter, down from 0.7% in the first quarter. Softer data could increase the likelihood of another rate cut this year.
The British pound traded steadily against the US dollar on Tuesday, around 1.3480. The pair remained above its 20-day simple moving average, around 1.3398, indicating a short-term upward bias. The 14-day Relative Strength Index (RSI) technical indicator has been above 50.00 for several trading days this week, suggesting a bullish reversal attempt. The British pound continued its upward trend against the US dollar this week, approaching its highest level in two weeks at 1.3480. Currently, the exchange rate appears capped below the 1.3500 level and the 50-day simple moving average at 1.3502. If broken by bulls, the next key resistance levels are the July 23 high near 1.3585 and the psychologically important 1.3600 level. Looking down, initial support lies at the 1.3400 level and the 20-day simple moving average at 1.3398, followed by the 9-day simple moving average at 1.3357.
Consider a long position on the British pound at 1.3480 today, with a stop loss of 1.3470 and targets of 1.3540 and 1.3550.
USD/JPY
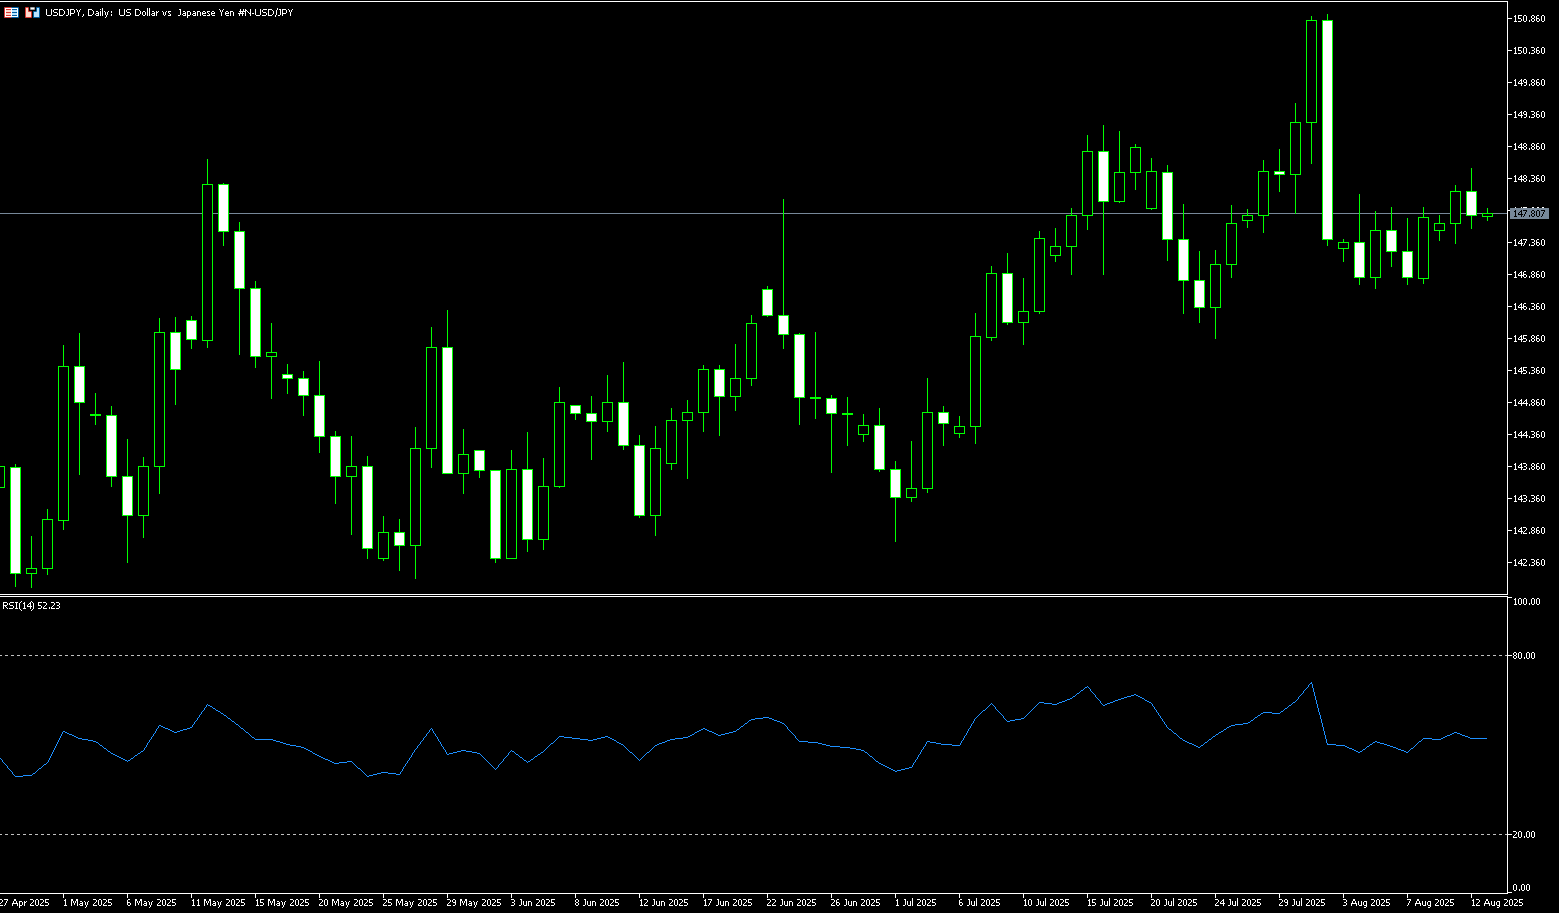
The Japanese yen fell against the US dollar for the third consecutive day during Tuesday's Asian trading session, sliding to a 1.5-week low. Amidst political uncertainty, the potential negative impact of increased US tariffs on the domestic economy suggests further delays in the Bank of Japan's policy normalization. This, combined with generally positive sentiment in the stock market, continues to weaken the safe-haven yen. Nevertheless, the Bank of Japan's upward revision of its inflation forecast in July opens the door to an interest rate hike before the end of the year. Conversely, the likelihood of a Federal Reserve rate cut surged following the weaker-than-expected July employment report released earlier this month. This, in turn, has limited further appreciation of the US dollar and helped limit losses in the low-yielding yen. Traders may also opt to await the release of US consumer inflation data, which could help limit volatility in USD/JPY.
On the daily chart, a break above the 148.00 round-figure mark could be seen as a key trigger for USD/JPY. Furthermore, slightly positive oscillators suggest that the path of least resistance for the spot price is to the upside. Further follow-through buying in the 148.45-148.50 area would confirm the positive outlook and push the pair towards 149.00, the 23.6% Fibonacci retracement level. On the other hand, the 147.80-147.75 area could provide immediate support for USD/JPY. Any further declines could be seen as buying opportunities around the 147.00 round-figure mark, with the potential to remain limited around the 146.80 convergence point, formed by the 200-period simple moving average and the 50% Fibonacci retracement level on the 4-hour chart. However, a decisive break below the latter could trigger some technical selling and drag the spot price below 146.00.
Consider shorting the US dollar at 148.00 today. Stop-loss: 148.25, target: 147.20
EUR/USD
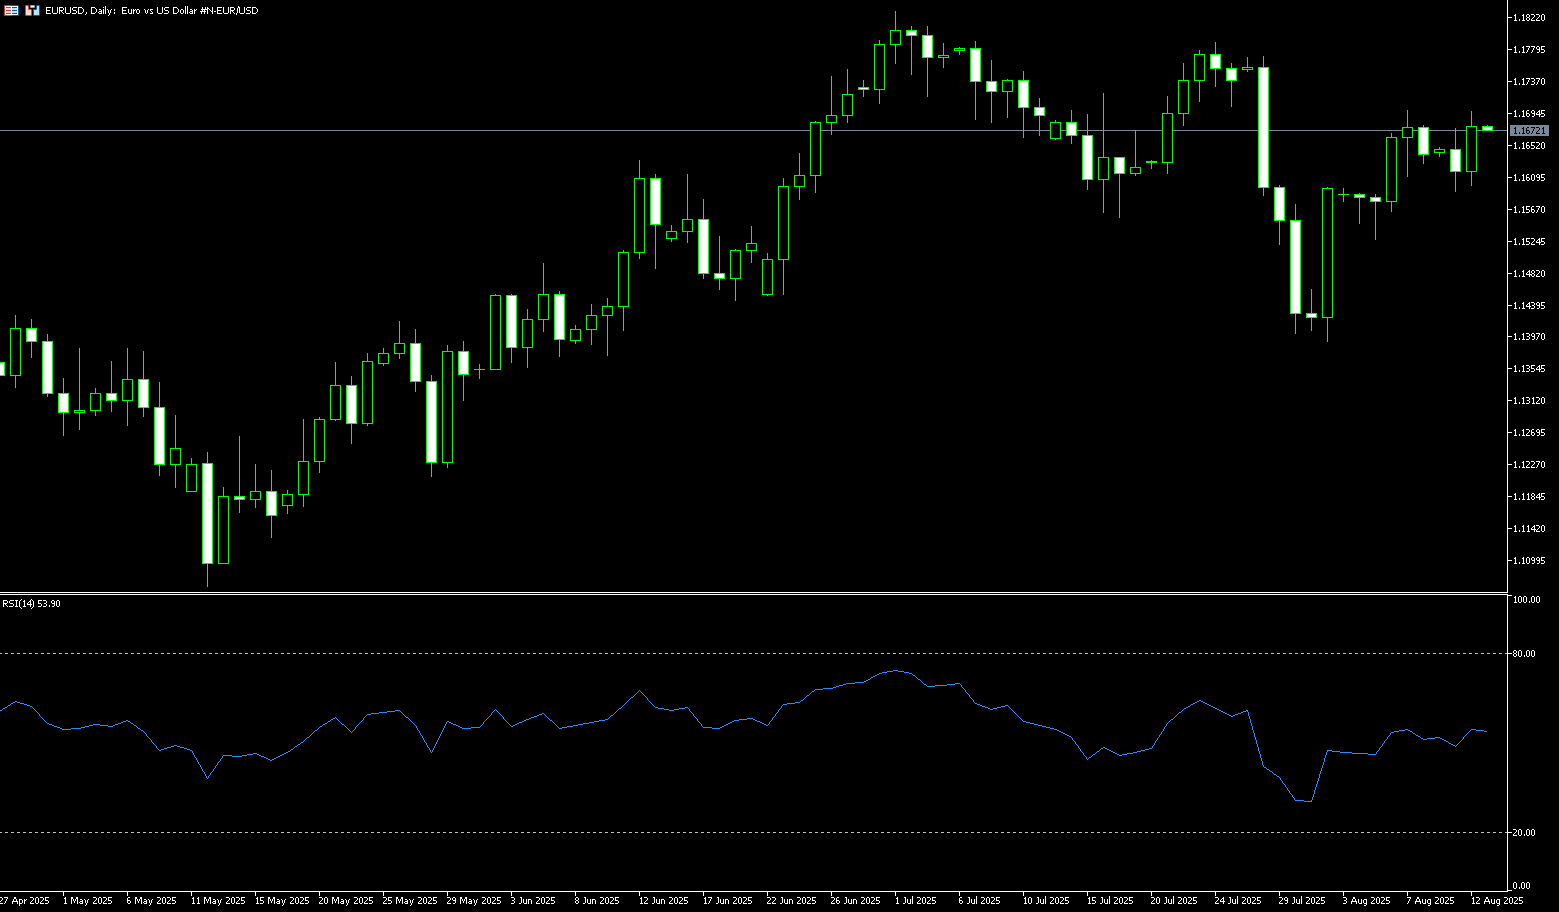
EUR/USD recovered slightly after two consecutive days of losses, trading around 1.1670 on Tuesday. The euro could appreciate further as market sentiment improves ahead of the upcoming US-Russia meeting. US President Donald Trump and Russian President Vladimir Putin will meet in Alaska on August 15 to seek a solution to the conflict in Ukraine. However, Ukrainian President Volodymyr Zelensky is reportedly unlikely to attend. The European Central Bank ended its latest easing cycle in July, cutting interest rates eight times over the past year, bringing borrowing costs to their lowest level since November 2022 to support slowing eurozone economic growth. However, some market participants still expect another round of ECB rate cuts before the end of the year. Markets currently price in an 84% probability of a rate cut at the Federal Reserve's September meeting, down from 90% a week ago.
The daily chart shows that EUR/USD's upward momentum appears to be capped by the 1.1700 level, with continued bearish activity, although the pair remains above 1.1600. However, the 14-day Relative Strength Index (RSI) suggests that buyers appear to be losing momentum. The index is now at a neutral level of 50, but could potentially turn bearish. This means that sellers will need to exert all their strength to push the pair below 1.1600. If successful, the next support level will be the 65-day simple moving average at 1.1540. A break above this level would expose the 1.1500 round-figure mark. Conversely, if EUR/USD holds above 1.1600, traders will focus on 1.1698 (the high of August 7) and 1.1700 (the round-figure mark). A break below this level would target 1.1789 (the high of July 24).
Today, you can consider going long on EUR at 1.1662, stop loss: 1.1650, target: 1.1720; 1.1730
Disclaimer: The information contained herein (1) is proprietary to BCR and/or its content providers; (2) may not be copied or distributed; (3) is not warranted to be accurate, complete or timely; and, (4) does not constitute advice or a recommendation by BCR or its content providers in respect of the investment in financial instruments. Neither BCR or its content providers are responsible for any damages or losses arising from any use of this information. Past performance is no guarantee of future results.
More Coverage


Risk Disclosure:Derivatives are traded over-the-counter on margin, which means they carry a high level of risk and there is a possibility you could lose all of your investment. These products are not suitable for all investors. Please ensure you fully understand the risks and carefully consider your financial situation and trading experience before trading. Seek independent financial advice if necessary before opening an account with BCR.

 English
 简体中文
简体中文
 繁體中文
繁體中文
 Bahasa
Melayu
Bahasa
Melayu
 Tiếng
Việt
Tiếng
Việt
 ไทย
ไทย
 日本語
日本語
 한국어
한국어
 ភាសាខ្មែរ
 español