


0
US Dollar Index
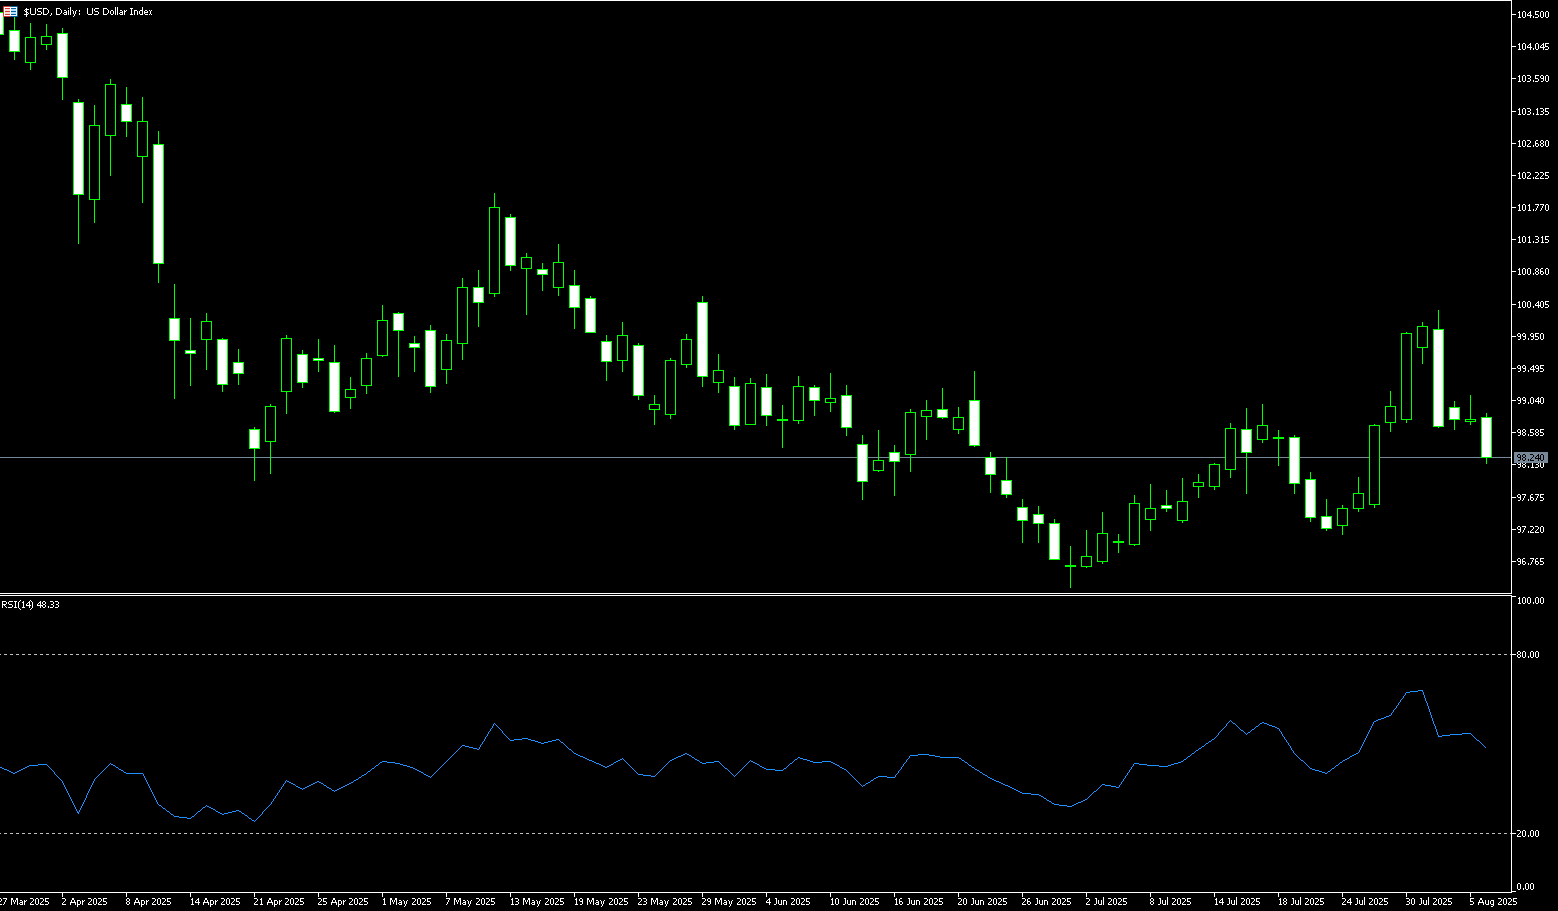
The US dollar index fell for the fourth consecutive session on Wednesday, dropping to 98.25, as traders awaited updates on potential Federal Reserve leadership changes. President Trump said on Tuesday he would nominate a candidate to replace outgoing Federal Reserve Governor Adrienne Kugler by the end of the week and revealed he had narrowed the list to four finalists to succeed Fed Chair Jerome Powell. Market expectations for a September rate cut surged to approximately 90% following a series of weak economic data. The latest ISM report showed an unexpected stagnation in the services sector, accompanied by rising price pressures. Adding to the dovish outlook, last week's jobs report showed the US economy added only 73,000 payrolls in July, with data for the previous two months also seeing significant downward revisions, indicating a significant slowdown in the labor market. In response, President Trump fired Bureau of Labor Statistics Director Erica McEntuff. The dollar was mostly lower against the euro.
On the 4-hour chart, the US dollar index remained above its rising trend line, maintaining a series of higher highs and lower lows since July 23. After a sharp decline from the high of 100.25 reached earlier this month, the index has stabilized above the 6th low of the month (98.13) and the 98.00 mark, which currently serve as dynamic support. This suggests that buyers still have support at key technical levels. However, horizontal resistance at the 65-hour moving average (98.53), the 4-hour Bollinger Band (98.99), and last week's high at 99.07 has limited upside potential, with multiple attempts to break through it failing. If the US dollar index breaks out and closes above this area, a retest of the 100-day simple moving average (99.64) could ease short-term downside pressure. Conversely, a break below 98.13-98.00 could trigger a deeper correction to 97.49 (the low of July 28) and around 97.00.
Consider shorting the US Dollar Index at 98.38 today, with a stop loss at 98.50 and a target of 98.00 or 97.85.
WTI Spot Crude Oil
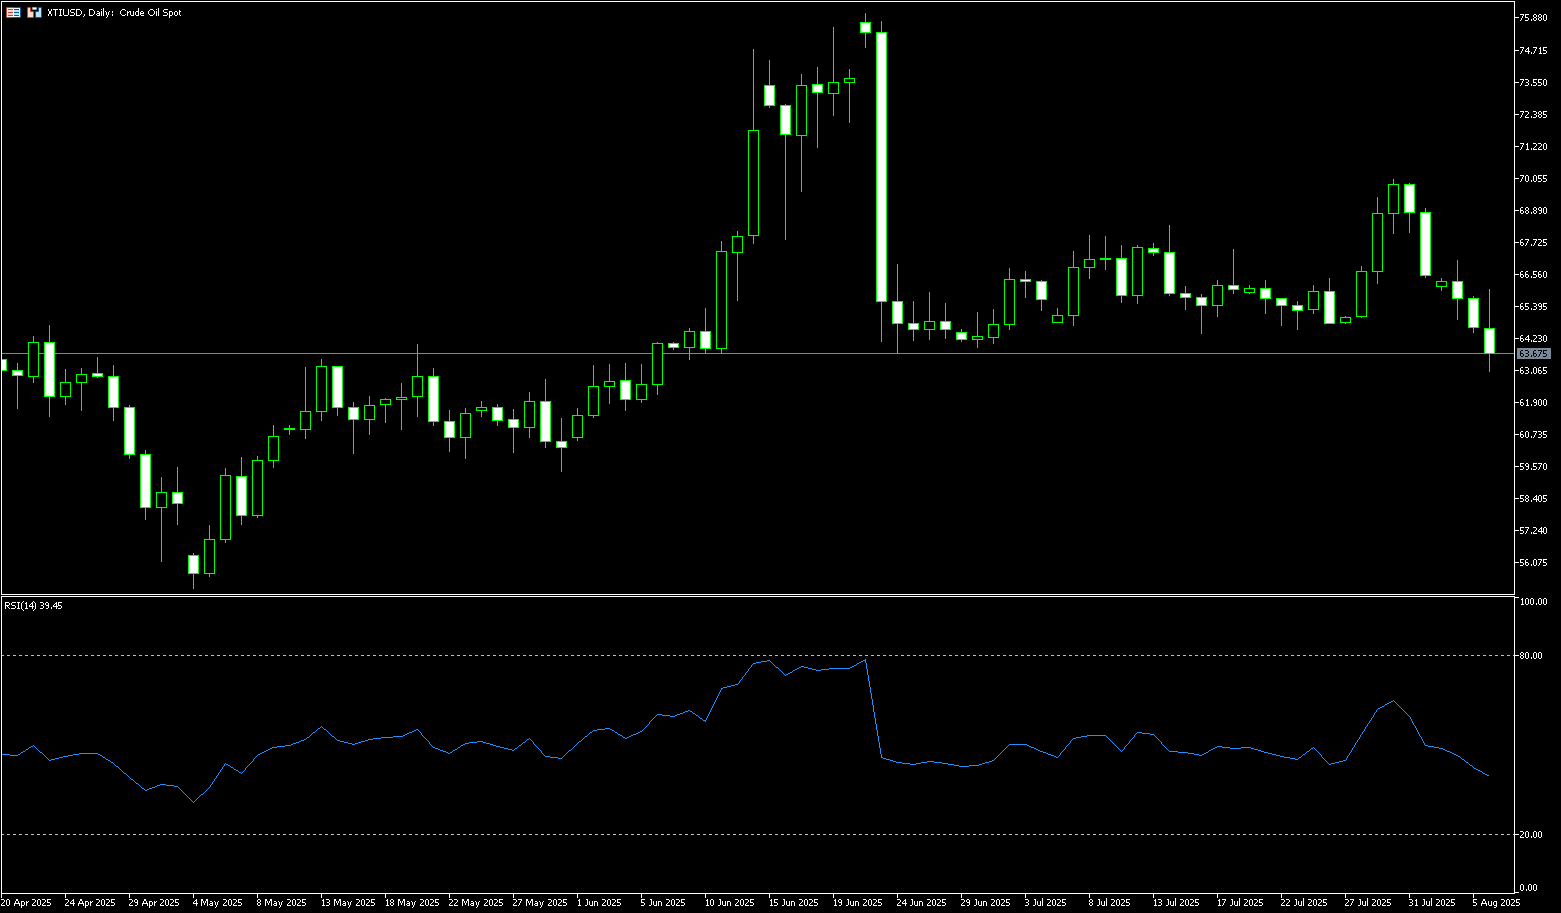
WTI crude oil reversed earlier gains, falling 1.50% on Wednesday to close at $63.60 per barrel, marking its fifth consecutive day of decline and a new six-week low. Prices initially rose on supply concerns stemming from President Trump's executive order imposing a 25% tariff on Indian goods, targeting Indian imports of Russian crude oil. A larger-than-expected 3 million barrel drop in US crude oil inventories also provided temporary support. However, US Secretary of State Marco Rubio's comments about potential sanctions against Russia, which could be announced later in the day, fizzled out the gains and added uncertainty to the market. Market sentiment was further dampened by expectations of increased supply from OPEC+ members. Traders now await clarity on the scope and timing of sanctions or tariffs, as well as their potential impact on global supply. WTI crude oil's recent bullish momentum on the daily chart may have faded, as the US crude oil barrel struggled to find footing after falling nearly 10% from its near-month-high of $70.02 in late July to a low of $63.02. WTI prices have fallen below both the 50-day simple moving average (SMA) of $66.33 and the Bollinger Band's middle axis of $66.30, accelerating the recent decline as US barrel prices declined for the fourth consecutive day. WTI prices also fell below key support levels at $64.05 (89-day moving average) and $64.00 (round-number mark). Next support lies at $63.00 (round-number mark) and $62.20 (June 6 low). On the upside, the 200-day moving average of $67.63 is a key resistance level, which, if re-established, could increase the potential for a rebound. There is still potential for further gains, with close attention paid to the $69.10 support level and the $70.00 psychological level.
Consider a long position in crude oil at $63.40 today. Stop-loss: $63.20, target: $65.00, $65.50.
Spot Gold
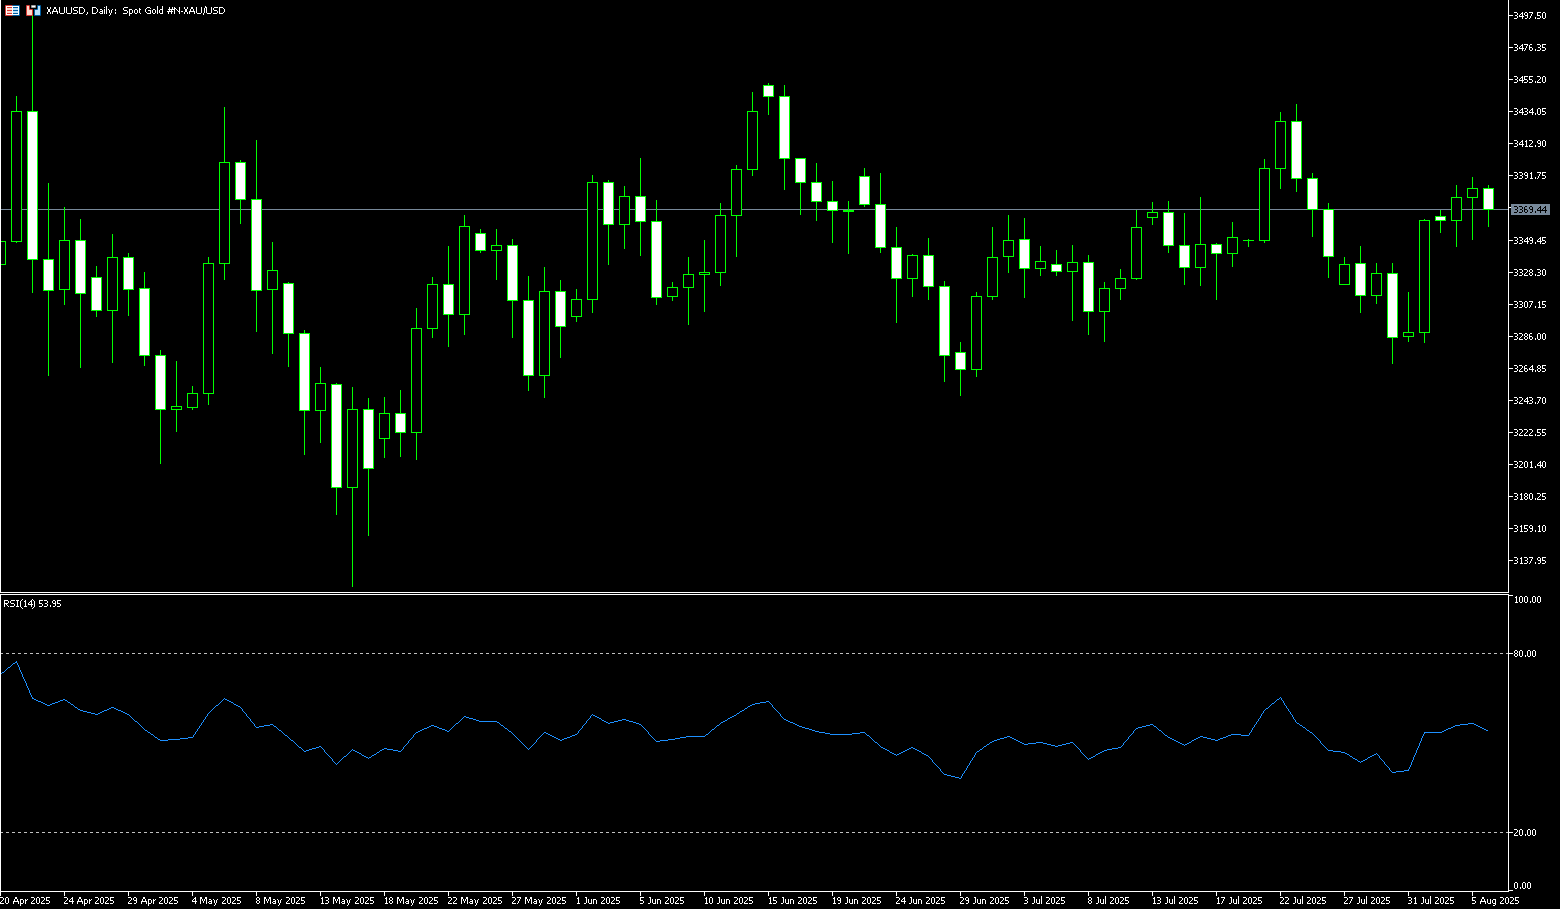
Gold prices fell to a new daily low in the first half of the European session and now appear to have snapped a four-day winning streak, reaching a near two-week high reached the previous day. Risk-on sentiment, as evidenced by the generally positive tone in the stock market, is seen as a key factor driving outflows from the safe-haven precious metal. Nevertheless, a series of supportive factors could help limit losses for the commodity and encourage caution among bearish traders. Last Friday's weaker-than-expected US non-farm payroll report, coupled with Tuesday's disappointing ISM services purchasing managers' index (PMI), heightened concerns about the health of the world's largest economy. This, in turn, reaffirmed market bets that the Federal Reserve will resume its rate-cutting cycle in September, putting dollar bulls on the defensive and positive for non-yielding gold. Trade-related uncertainty could also provide support.
Last week, after breaking out from below an ascending triangle pattern and briefly hitting a one-month low of $3,268, gold found support above the 100-day simple moving average at $3,282 and the lower Bollinger Band at $3,278 (daily chart), suggesting continued bearishness. Currently, gold is trading slightly above the 50-day simple moving average at $3,346.50 and the middle Bollinger Band at $3,350.50, providing immediate support, followed by the psychological level of $3,300. Further declines could target the next target near the simple moving average at $3,282. On the upside, if bulls can reclaim the broken bottom of the triangle and decisively push above $3,380 and $3,400, a move towards $3,439 (July 23 high) is possible, potentially revisiting the all-time high of $3,500.
Consider going long on gold at 3,365 today, with a stop-loss at 3,360 and targets at 3,385 and 3,390.
AUD/USD
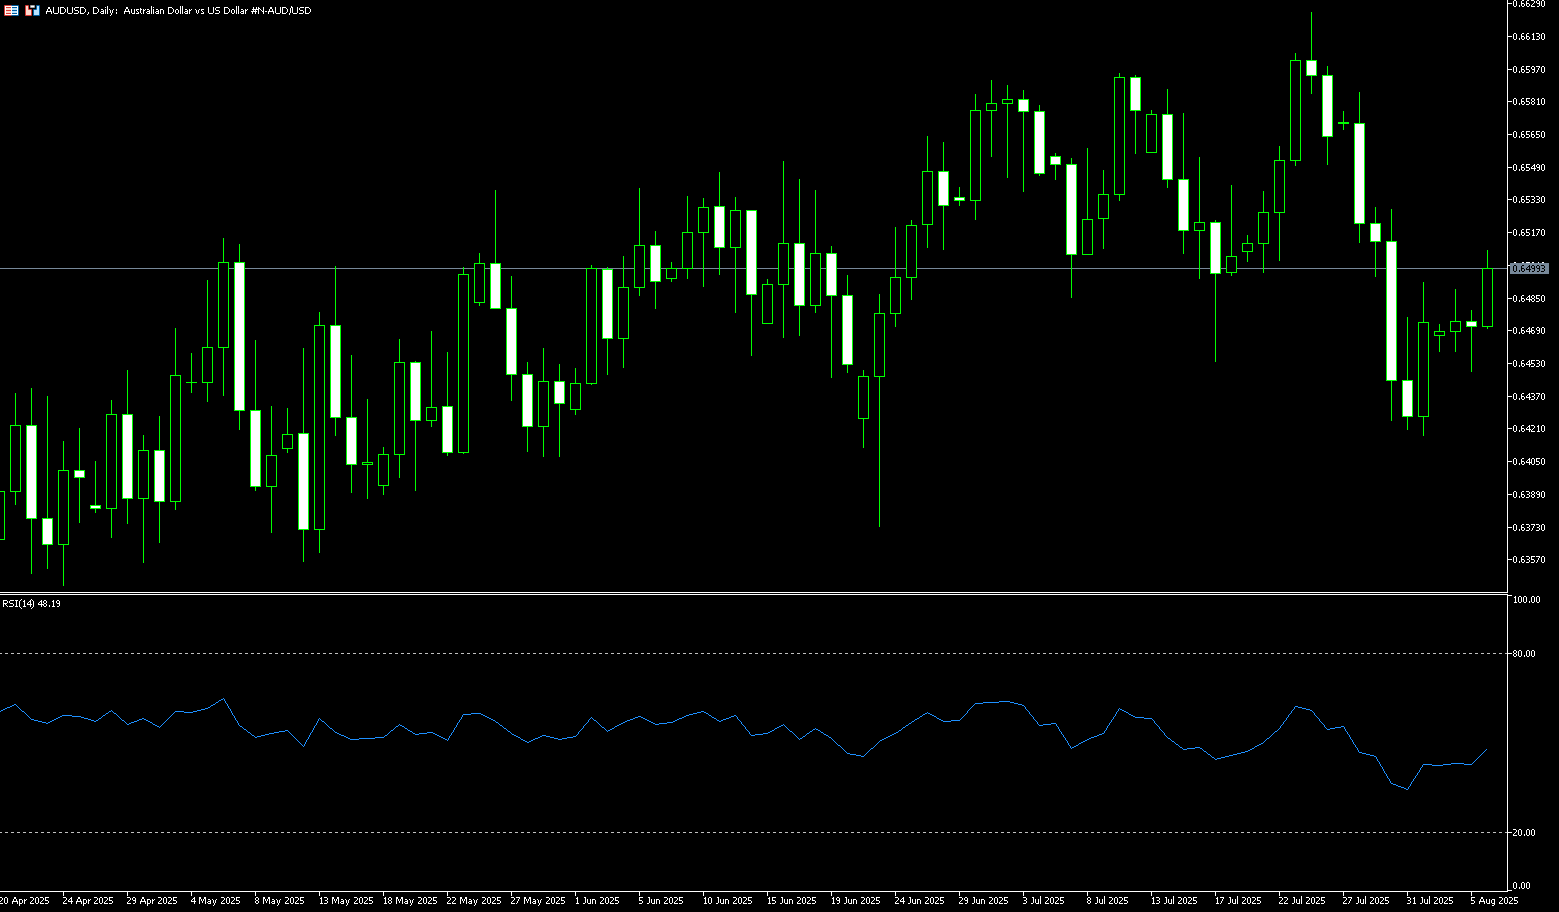
The Australian dollar continued its upward trend for a second consecutive day following the release of domestic economic data on Wednesday. It appreciated to a high of around $0.6508, bolstered by rising expectations of a September rate cut by the Federal Reserve, which bolstered risk appetite. Australia's Ai Group Manufacturing PMI rose 4.9 points to -23.9 in July, indicating a slight improvement but still pointing to a deep contraction in the sector. Meanwhile, the Ai Group Australian Industry Index, a key indicator of private sector activity, rose 5.8 points to -3.2, its highest level in three years, continuing the gradual recovery trend seen since mid-2024. With expectations that the Reserve Bank of Australia (RBA) will cut interest rates by 25 basis points next week, bringing the cash rate to 3.60%, the Australian dollar may face pressure.
AUD/USD traded just above 0.6500 on Wednesday. Technical analysis on the daily chart suggests a bearish bias, with the 14-day relative strength index (RSI) remaining below the 50-level. The pair is also trading below its 50-day simple moving average at 0.6512, suggesting weakening short-term momentum. On the downside, key support lies at the 100-day simple moving average low of 0.6431. A break below this level could exert downward pressure on the pair, potentially testing the 0.6400 round-number mark and the three-month low of 0.6372 recorded on June 23. On the upside, initial resistance lies at the 50-day simple moving average at 0.6512, coinciding with the psychological market level of 0.6500. A break above these levels could strengthen short- and medium-term price momentum and support the pair's move towards 0.6576 (the 76.4% Fibonacci retracement level from 0.6625 to 0.6420), as well as the 0.6600 level.
Consider a long position on the Australian dollar at 0.6490 today, with a stop loss of 0.6480 and targets of 0.6540 and 0.6550.
GBP/USD
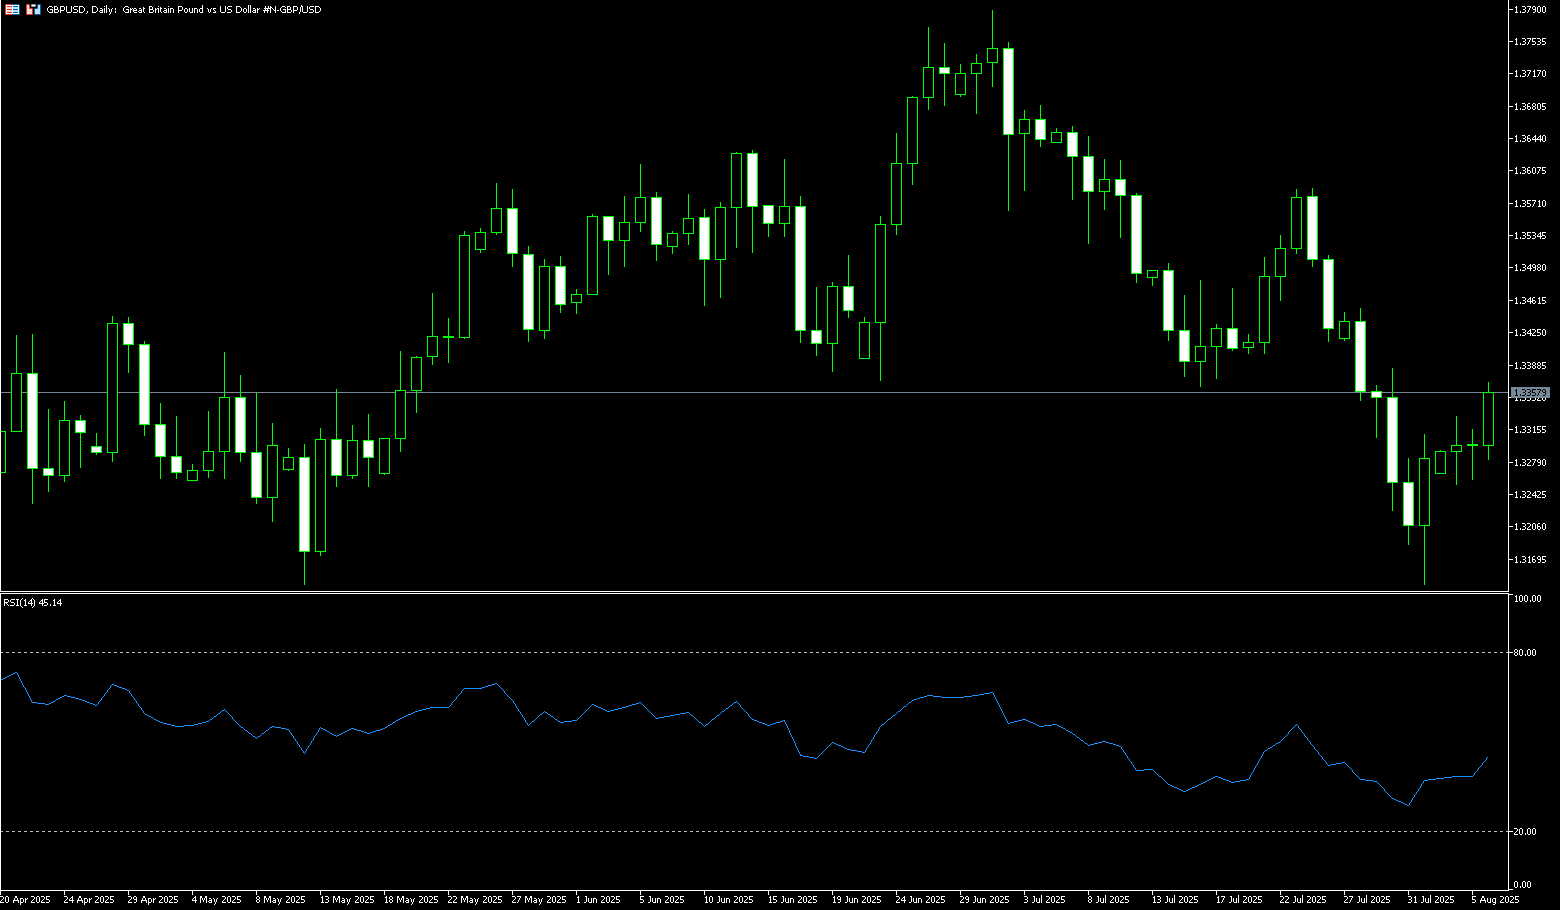
GBP/USD rose steadily during the North American trading session, as traders digested the recent non-farm payroll data and weekend developments ahead of the Bank of England meeting, which opened up an opportunity for US President Trump's nomination to the Federal Reserve Board. The pair traded at a high of 1.3368. The British pound remained largely stable against major currencies on Wednesday, with investors turning their attention to the Bank of England's monetary policy announcement on Thursday. Investors expect the Bank of England to cut interest rates by 25 basis points (bps) to 4%. This would be the fifth rate cut by the Bank of England in its current monetary expansion cycle, which began in August 2024. Market participants will closely monitor the monetary policy statement and Bank of England Governor Andrew Bailey's press conference for clues about the central bank's likely monetary policy actions for the remainder of the year. In its June monetary policy announcement, the Bank of England outlined a "gradual and cautious" monetary policy expansion. Investors will also closely monitor the Bank of England's outlook for inflation and the labor market. Inflationary pressures in the UK have risen significantly due to rising energy and food costs.
The British pound (GBP) maintained its gains from the weekend in early trading, consolidating around 1.3300, having previously found strong technical support near the 120-day simple moving average at 1.3261. A shift in US dollar flows helped halt the pound's decline, but the burden now lies on whether GBP bulls can hold their ground ahead of the Bank of England's next interest rate decision. On the other hand, the outlook for the currency pair remains bearish, as a breakdown of the head and shoulders pattern remains valid, with the 20-day exponential moving average sloping down near 1.3398. The neckline of the head and shoulders pattern is located near 1.3360. The 14-day relative strength index (RSI) is fluctuating around 40.00, indicating that bearish momentum persists. Looking down, the 120-day simple moving average at 1.3261 presents initial support, while the 1.3200 level will serve as a key support range. Looking up, the neckline of the head-and-shoulders pattern at 1.3360 and the July 30 high near 1.3385 will act as key resistance. A break below this level could target the 1.3400 round-figure mark.
Consider a long position on the British pound at 1.3345 today, with a stop-loss at 1.3335 and a target at 1.3395 or 1.3400.
USD/JPY
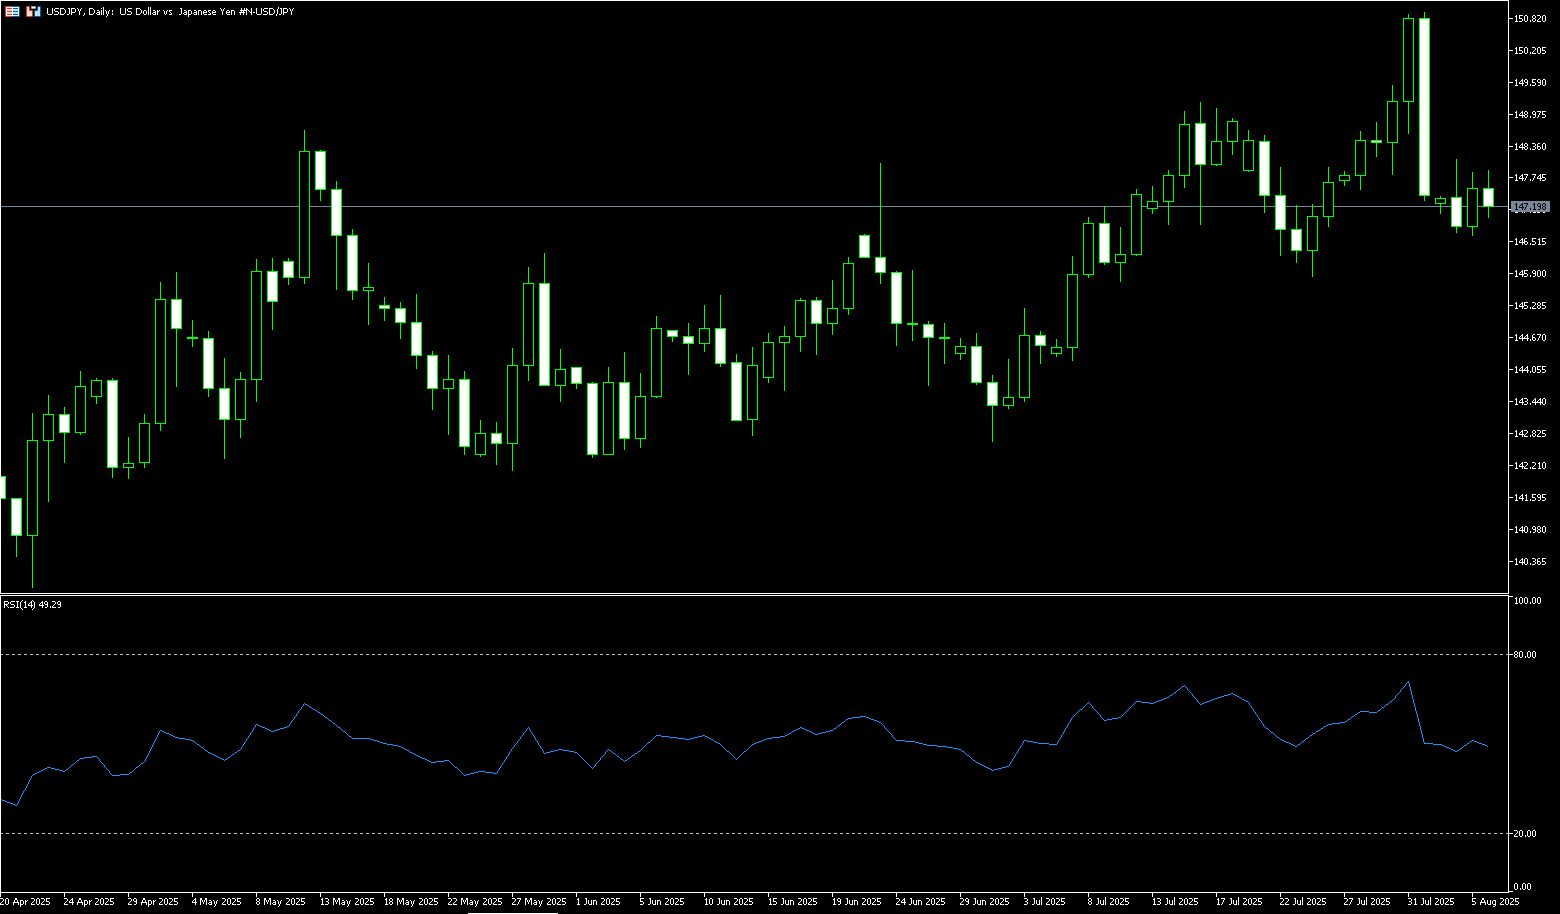
The yen weakened to around 147.50 against the dollar on Wednesday, extending its decline from the previous session as disappointing wage data reignited economic concerns. Real wages in Japan fell for the sixth consecutive month in June, and inflation continued to outpace wage growth, a trend that complicates the Bank of Japan's path to further tightening policy. The data cast doubt on the outlook for near-term rate hikes, particularly as the Bank of Japan contends with weak wage growth momentum, persistent inflation, and global trade uncertainty. The minutes of the Bank of Japan's June meeting indicated that policymakers remain willing to tighten policy further if trade tensions ease. Separately, Japanese Ministry of Finance officials called for policy flexibility, particularly in bond purchases, to ensure market stability. The Bank of Japan is unlikely to raise interest rates beyond current market pricing, limiting the yen's gains. USD/JPY is expected to remain range-bound between 142.00 and 150.00 over the next few months.
The USD/JPY pair's resilience below the 50% retracement of the rally from the July low and subsequent recovery favor USD/JPY bulls. Furthermore, oscillators on the daily chart are beginning to gain positive traction again, supporting the possibility of further gains. That said, a further move above the 148.00 round-figure mark could face some resistance around 148.45-148.50. A sustained break above the latter would indicate that the spot price has formed a short-term bottom and pave the way for further strength, targeting the 149.00 level. On the other hand, the Asian session low around 147.45 now appears to be providing immediate support for USD/JPY. Any further decline could be seen as a buying opportunity around the 147.00 round-figure mark. However, if some sustained selling occurs below 147.00, the spot price could face the risk of accelerating its decline towards the 146.00 round-figure mark. This downward trajectory could extend further, ultimately dragging the spot price to the 145.68 (100-day moving average) risk level.
Consider shorting the USD at 147.65 today. Stop-loss: 147.90 Target: 146.80 146.60
EUR/USD
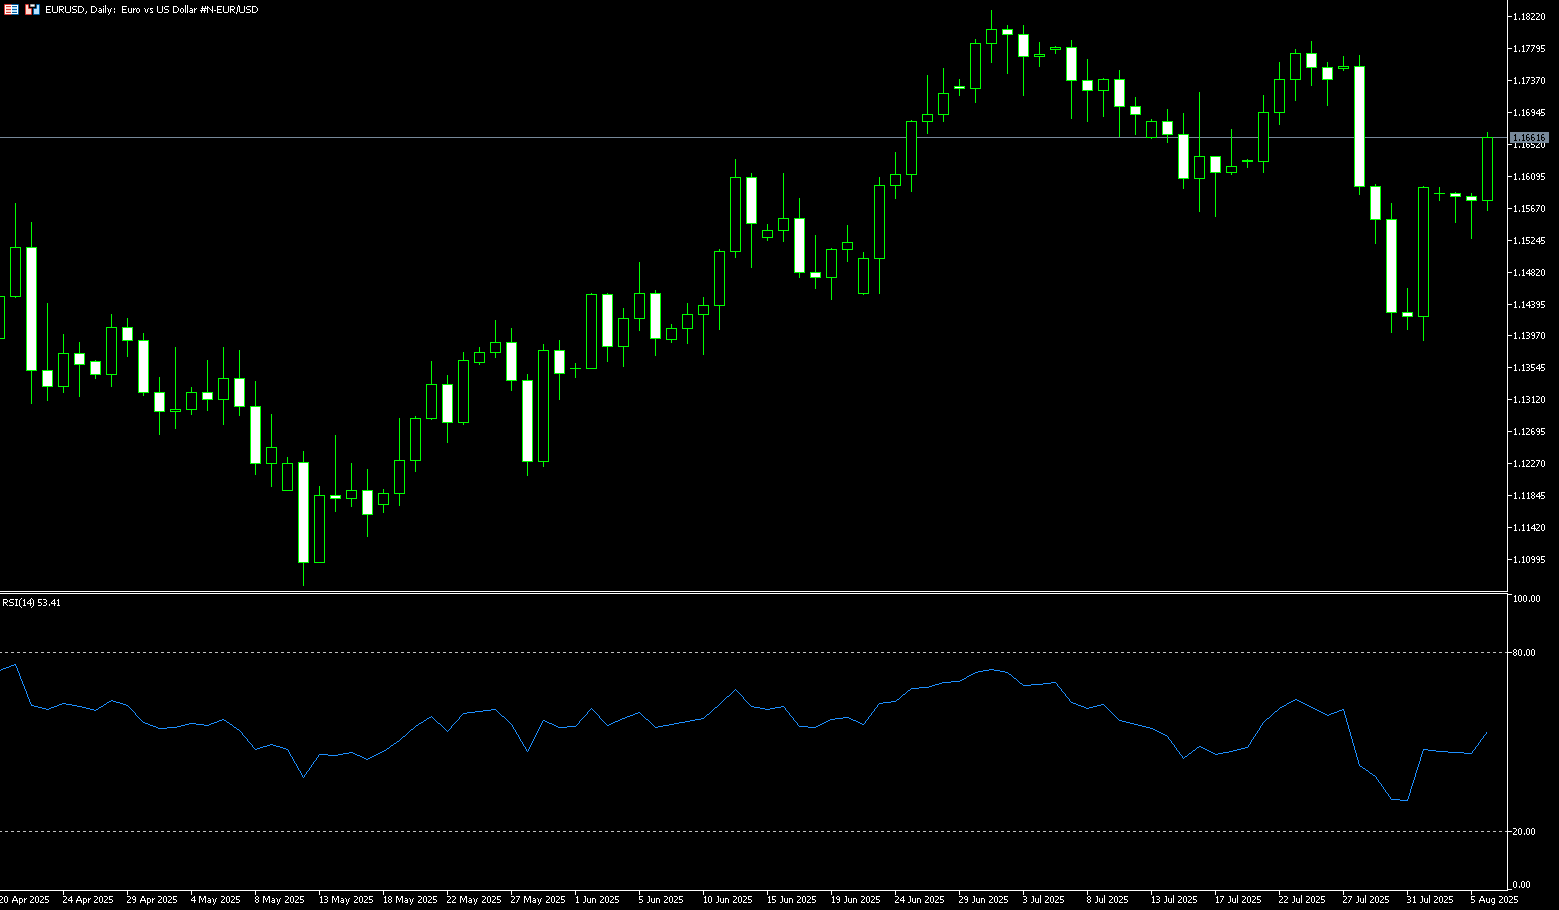
On Wednesday, the euro/dollar pair traded with a positive bias, extending its upward trend and breaking through the 1.1600 level, reaching its highest level in over a week. The pair traded around 1.1650 during the U.S. trading session. Major currency pairs are consolidating due to the volatility of the U.S. dollar, as investors await the announcement of the Federal Reserve Chair and the successor to Governor Adrienne Kugler, who resigned last week. On Tuesday, US President Donald Trump announced that he would appoint a successor to the Federal Reserve Chair and Kugler by the end of the week, confirming his four choices, including White House economic advisor Kevin Hassett, former Fed Governor Kevin Warsh, and two others. In the Eurozone, investors await June retail sales data, a key indicator of consumer spending.
The daily chart shows that EUR/USD continues to consolidate above the 1.1600 level, suggesting potential for improving upward momentum. The 14-day relative strength index (RSI) remains in bullish territory (most recently seen at 53.50) and is approaching its neutral line, suggesting some buying interest. A clear break above the 1.1600 round number, which would place it above the Bollinger Band's central axis at 1.1625, followed by the 1.1700 round number, could open the door to a test of resistance in the 1.1750-1.1800 range. Conversely, a break below the 60-day simple moving average at 1.1542 could extend further losses to the 1.1500 round-figure mark.
Today, consider a long EUR at 1.1645, with a stop loss at 1.1630 and a target at 1.1695 or 1.1700.
Disclaimer: The information contained herein (1) is proprietary to BCR and/or its content providers; (2) may not be copied or distributed; (3) is not warranted to be accurate, complete or timely; and, (4) does not constitute advice or a recommendation by BCR or its content providers in respect of the investment in financial instruments. Neither BCR or its content providers are responsible for any damages or losses arising from any use of this information. Past performance is no guarantee of future results.
More Coverage


Risk Disclosure:Derivatives are traded over-the-counter on margin, which means they carry a high level of risk and there is a possibility you could lose all of your investment. These products are not suitable for all investors. Please ensure you fully understand the risks and carefully consider your financial situation and trading experience before trading. Seek independent financial advice if necessary before opening an account with BCR.

 English
 简体中文
简体中文
 繁體中文
繁體中文
 Bahasa
Melayu
Bahasa
Melayu
 Tiếng
Việt
Tiếng
Việt
 ไทย
ไทย
 日本語
日本語
 한국어
한국어
 ភាសាខ្មែរ
 español