0
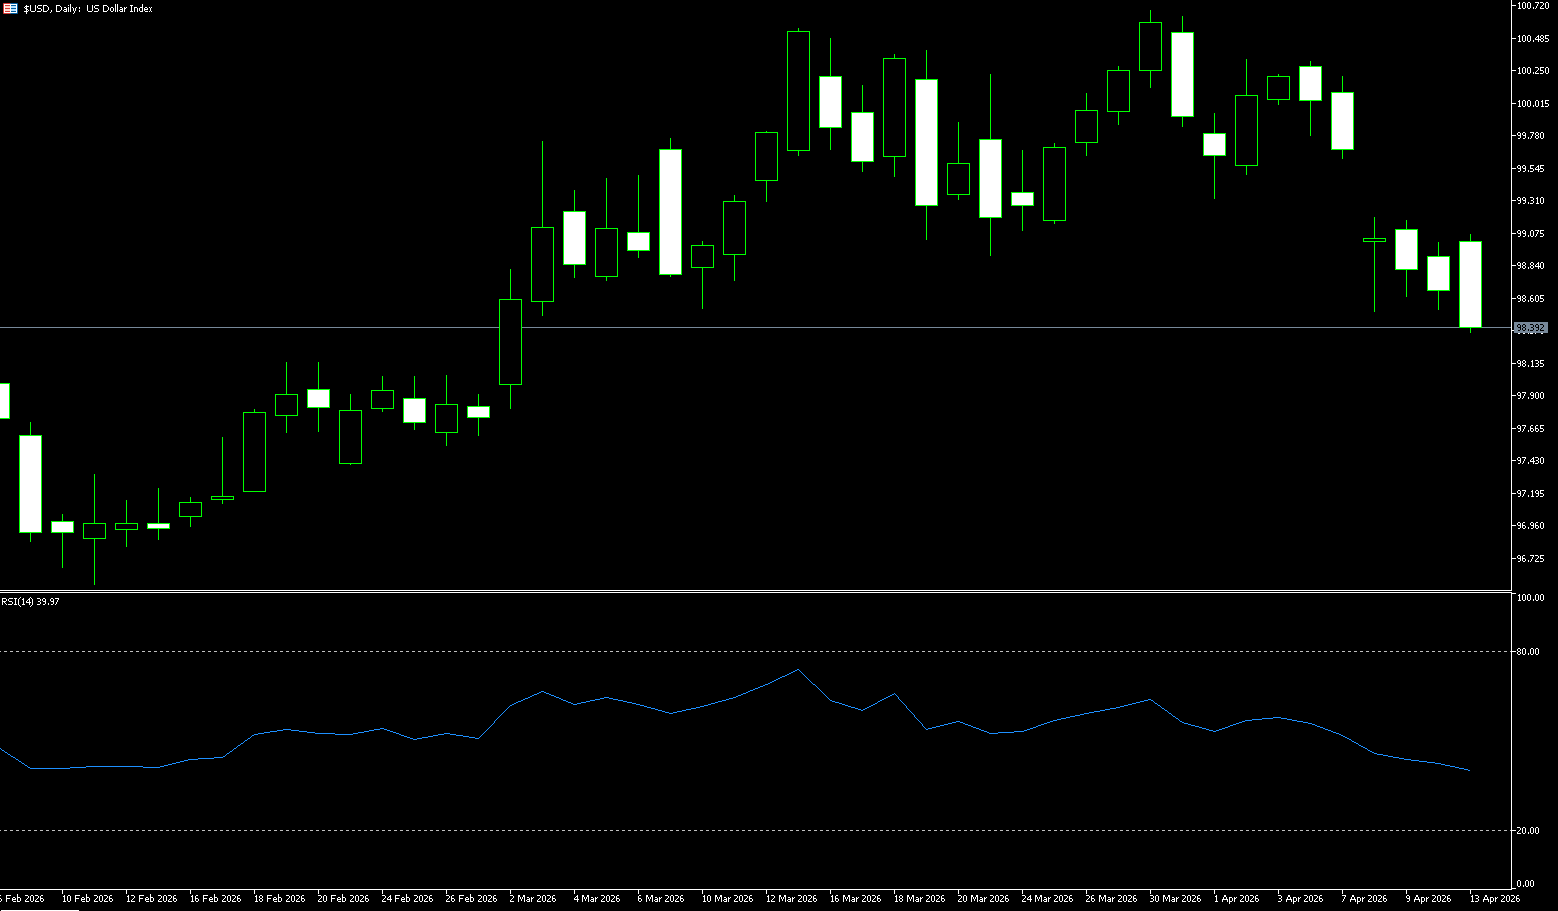
US Dollar Index
The US dollar index fluctuated below 98.50 on Monday, partially recovering last week's losses after President Trump announced a blockade of the Strait of Hormuz following the failure of weekend peace talks between the US and Iran. Last week was a poor one for the dollar, with the dollar index falling back to near its multi-week low of 98.50, an area that also coincides with its key 200-day simple moving average {98.52}. The selling pressure on the dollar was entirely driven by easing tensions in the Middle East, particularly after the US and Iran reached a two-week ceasefire agreement on Tuesday evening. While uncertainty appears to have subsided, some questions remain, such as whether Lebanon is included in the ceasefire and the reopening of the Strait of Hormuz—a vital waterway for oil shipments. The dollar's strong pullback roughly followed a similar decline in US Treasury yields, particularly short- and medium-term yields, reflecting the characteristic of fluctuating news surrounding geopolitical developments.
The speculative positioning story for the dollar remains one of gradual rebuilding, rather than a radical shift. Positions have stabilized, recently remaining between approximately 3.6K and 3.7K contracts. While the overall position change appears modest, the underlying dynamics are more positive. The US dollar continues to strengthen, with the index climbing towards the 99.00 area and open interest increasing significantly, reaching a new high for this period. This combination suggests the entry of new long positions, not just short covering. This implies that from a positioning perspective, the dollar still has room to rise. Given that the current trend has not yet peaked and may continue, the risk of trader fatigue is low. This also supports the view that the dollar's value may continue to decline, especially if the overall economic situation remains stable. The dollar index has fallen to around 98.60; a decisive break below the key support level of 98.52 (200-day simple moving average) would shift the technical outlook from neutral-bullish to neutral-bearish towards the 98.00 level (psychological level), with resistance concentrated at the 99.31 (34-day simple moving average) and 99.69 (last Wednesday's high).
Today, consider shorting the US Dollar Index at 98.50, with a stop-loss at 98.60 and targets at 98.10 and 98.00.
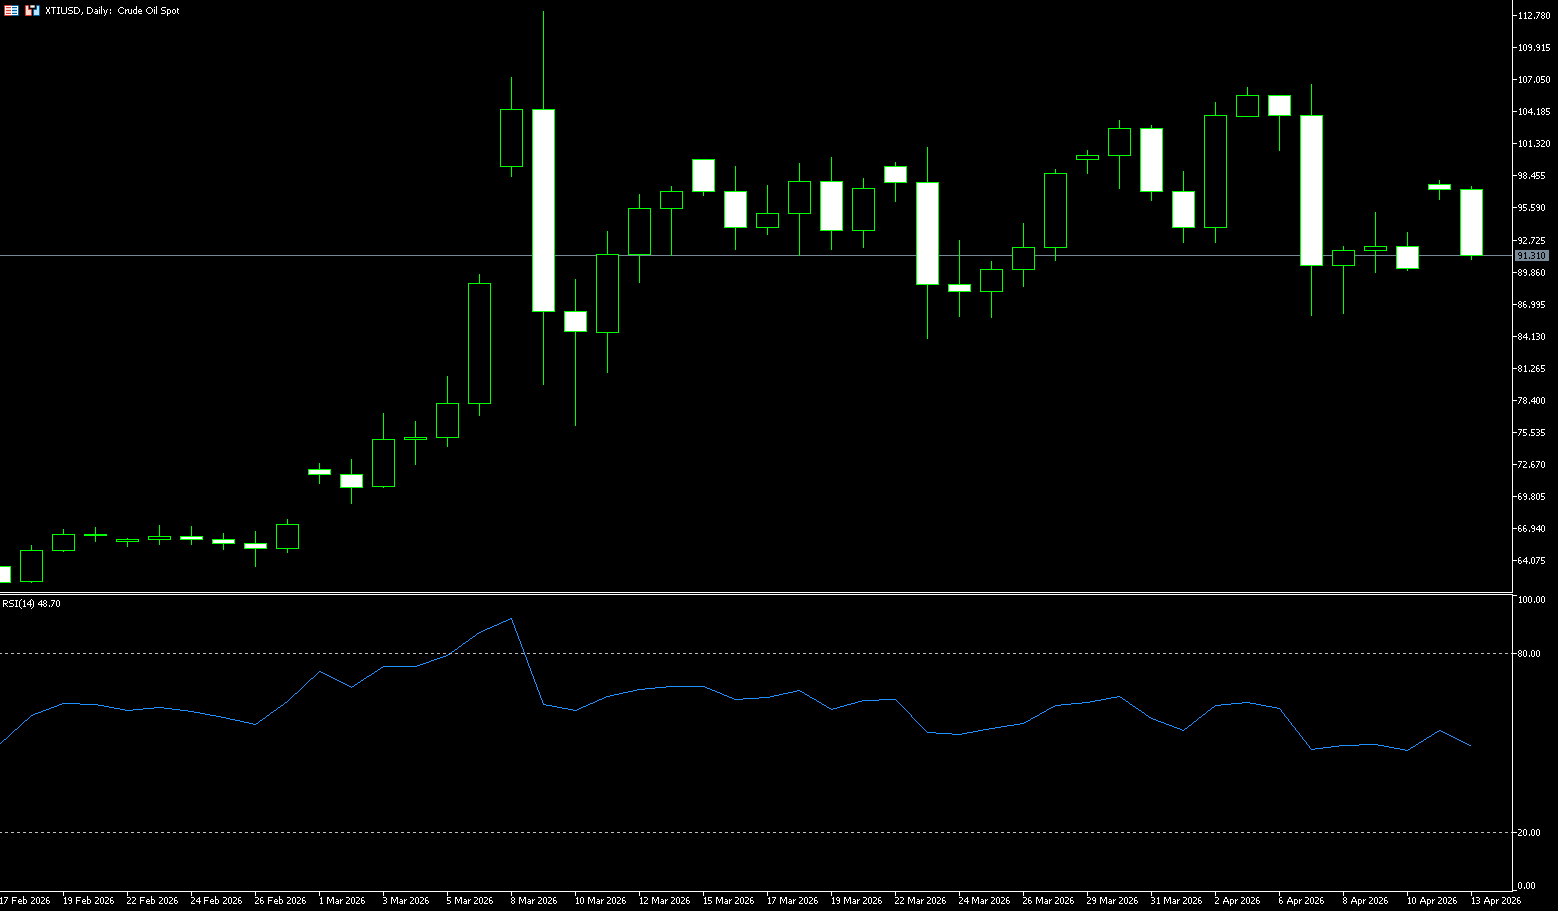
WTI Crude Oil
WTI crude oil rose less than 2% on Monday afternoon, nearing $92.70 per barrel, paring earlier gains of up to 9%, as investors hoped for a final agreement between the US and Iran. Despite the US failing to reach an agreement with Iran over the weekend, prompting President Trump to announce a blockade of Iranian oil shipments, Trump subsequently stated that Iran had reached out and hoped to resume negotiations. Meanwhile, an OPEC+ report showed that cartels' production fell by 7.9 million barrels per day in March due to the closure of the Strait of Hormuz. Furthermore, Saudi Arabia stated that it had restored full capacity for shipments to the Red Sea via its East-West pipeline, as well as production from the Manifa oil field. Since the escalation of the conflict in late February, European natural gas prices have risen by more than 50%. Oil prices also jumped, with US crude rising nearly 10% at one point, breaking through the $97 per barrel mark, reaching a high of $97.70. This energy shock quickly spread to the inflationary realm. The US Consumer Price Index (CPI) rose by the highest month-on-month increase in nearly four years in March, further amplifying the combined effects of the war-driven oil price surge and tariffs.
The current crude oil market is in a typical "news-driven" phase. WTI mainly reflects US domestic supply and demand, while Brent more directly reflects global trade flows and geopolitical risks. Currently, the global risk premium is primarily reflected in the Brent system, rather than being fully transmitted to WTI. Technically, WTI is currently in a typical consolidation phase. The Bollinger Bands are narrowing significantly, indicating that volatility has fallen to a low point; the MACD indicator is close to the zero line, trend momentum is weakening, and the market has entered a window of "waiting for a directional choice." The $100 level constitutes an important psychological and technical resistance level. Historical experience shows that this position has repeatedly become a key area where bulls have failed to break through, and a large number of institutional orders and algorithmic trading strategies are concentrated around this area, strengthening its resistance attribute. If the price breaks through $102 decisively, accompanied by increased trading volume and strengthening momentum indicators, the upward breakout is likely confirmed, opening up further upside potential with a target range of $110 to $120. Conversely, if oil prices fall, support levels to watch are around $92 (corresponding to the 50% Fibonacci retracement of the previous upward move) and around $85 (the 61.8% Fibonacci retracement). These levels have been repeatedly validated as effective support areas in historical cycles and possess strong technical reference value.
Today, consider going long on crude oil at 92.55, with a stop loss at 92.40 and targets at 94.00 and 95.00.
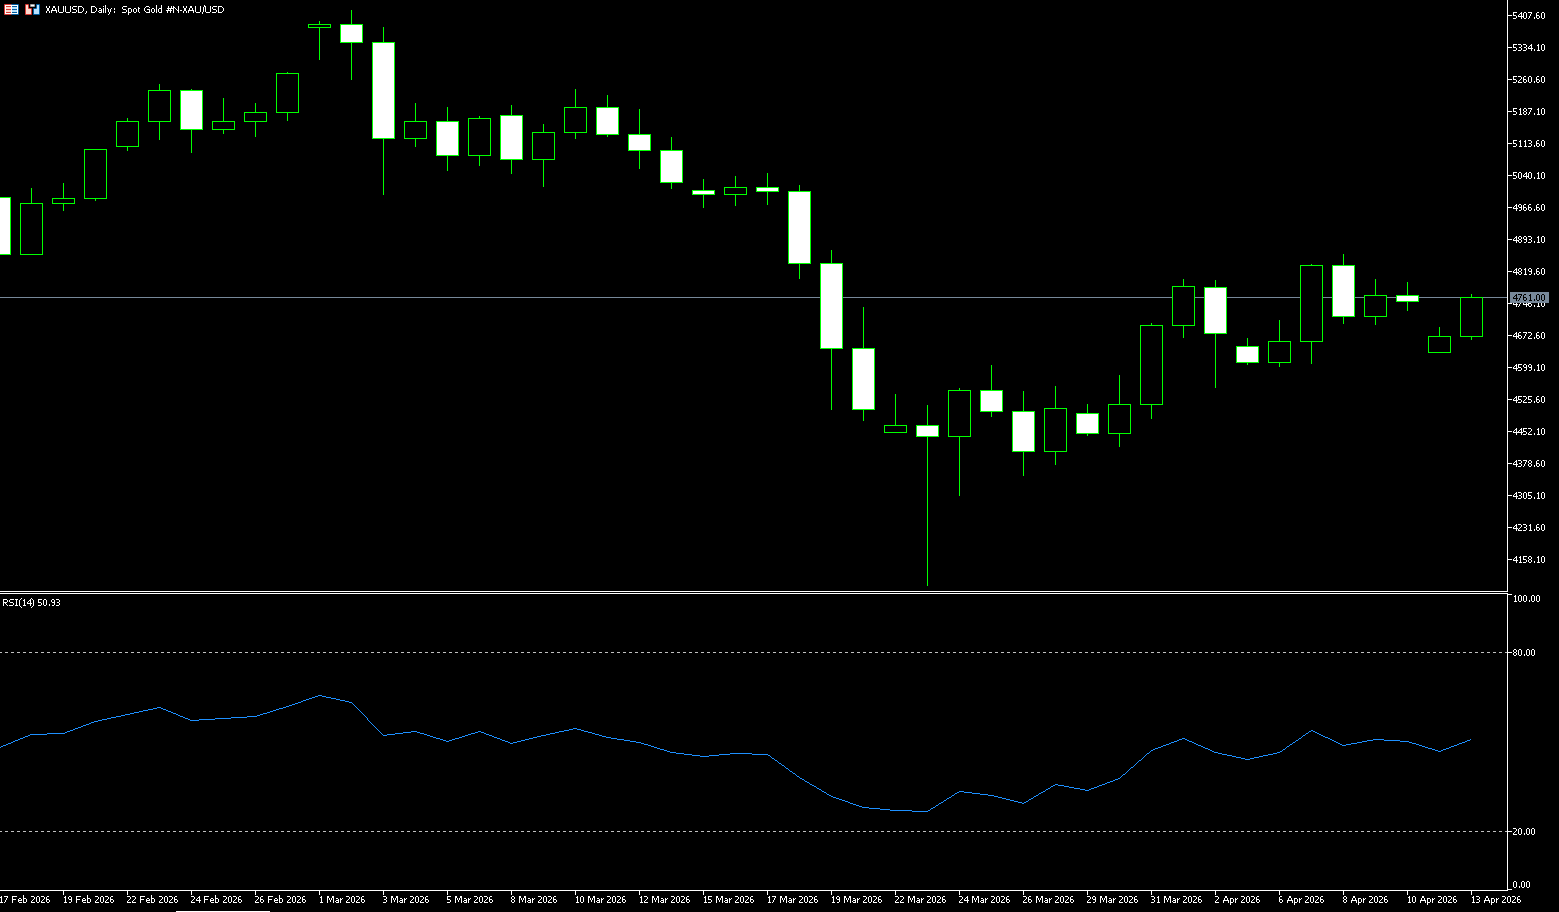
Spot Gold
On Monday (April 13th, Beijing time), spot gold opened down more than 2% in early European trading, trading around $4,740 per ounce. Talks between the US and Iran on Saturday failed to reach any agreement, mainly due to setbacks on three key issues: the reopening of the Strait of Hormuz, uranium enrichment, and the unfreezing of Iranian overseas assets. Following the setbacks, both sides reiterated their hardline stances, with the US announcing a blockade of Iranian ports starting on the 13th, and Trump considering limited strikes against Iran. Last week, the US and Iran reached a brief ceasefire agreement, which initially eased market concerns about an escalation of the Middle East conflict. Gold prices subsequently rebounded 1.56%, closing near $4,749. However, intensive talks held in Pakistan over the weekend failed to translate the ceasefire into lasting peace. The negotiations lasted 21 hours, with an atmosphere of mutual distrust permeating the entire process. As Vance left Islamabad, he bluntly stated that this was "more detrimental" to Iran, while Iranian Parliament Speaker Ghalibaf responded strongly, saying that the US must win Iran's trust, otherwise "there is no way out."
From a technical perspective, gold prices are expected to maintain a neutral to slightly bearish stance, as they continue to be capped below the 200-period simple moving average on the 4-hour chart. This resistance level coincides with the 61.8% Fibonacci retracement of the March decline and should be a key turning point. Meanwhile, the 14-hour Relative Strength Index (RSI) is around 46, suggesting moderate potential demand after the recent pullback. Nevertheless, the Moving Average Convergence Divergence (MACD) indicator has slipped slightly into negative territory, indicating weakening upward momentum and reinforcing the strong resistance at the 200-period simple moving average at $4,868. Following closely is the 61.8% Fibonacci retracement at $4,908.40. A clear break above this resistance zone would pave the way for a further push towards the psychological level of $5,000. On the downside, short-term support lies at $4,671.50 (Monday's low). A break below this level would expose stronger structural support at the next Fibonacci support levels of $4,595.00 and $4,600.00 (psychological level).
Consider going long on spot gold today at $4,736, with a stop-loss at $4,730 and targets of $4,790 and $4,800.
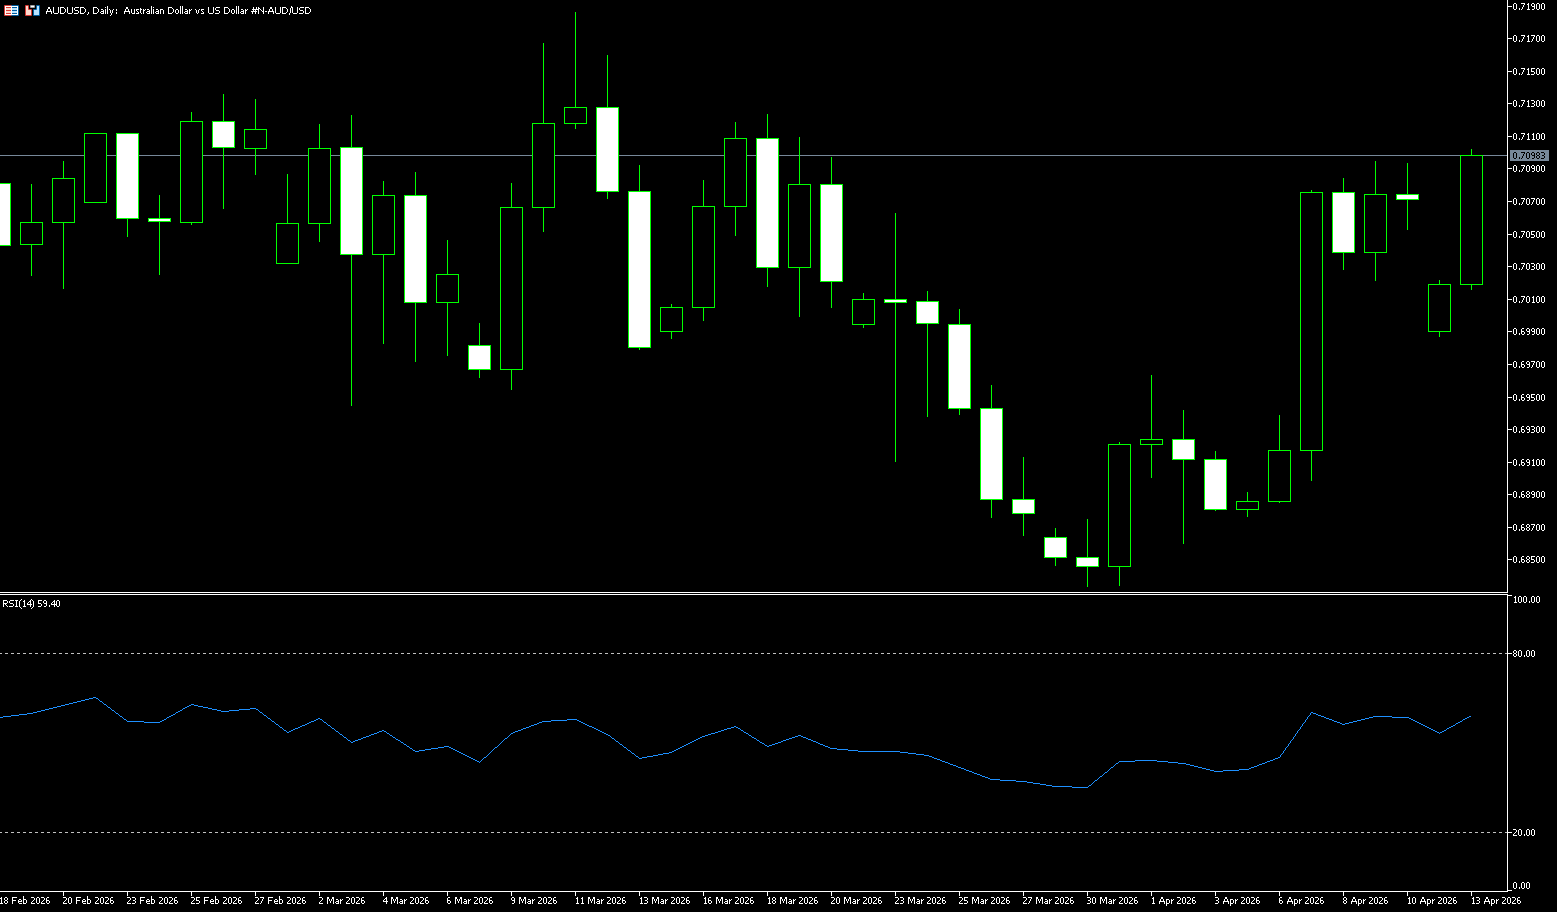
AUD/USD
The AUD/USD pair experienced a sharp reversal on Monday, rebounding after a lower open at the start of the week as investors reassessed the evolving geopolitical situation in the Middle East and the prospect of a US-Iran deal. Hopes for a deal improved market sentiment, boosting the risk-sensitive Australian dollar and putting pressure on the US dollar, driving the rebound. The AUD/USD pair is trading around 0.7089, having rebounded from an intraday low near 0.6990. Meanwhile, the US dollar index, which tracks the dollar's value against six major currencies, traded around 98.40, retreating from an intraday high near 99.00. Looking ahead, traders will be closely watching developments in Middle East geopolitics, particularly any signs of de-escalation and signals of a potential reopening of the Strait of Hormuz, as persistently high oil prices continue to exacerbate inflation concerns and complicate the monetary policy outlook for major central banks. Given Australia's close economic ties with China, traders will also be closely watching Tuesday's Chinese trade balance data, making the Australian dollar particularly sensitive to the dynamics of the world's second-largest economy.
From a technical perspective, the AUD/USD pair rebounded from converging support levels, including the psychological level of 0.7000 and the 38.2% Fibonacci retracement of the late March lows, indicating that buyers are defending the 0.7000 area. Meanwhile, the 14-day Relative Strength Index (RSI) has rebounded from oversold territory to the high 50-55 range, and the Moving Average Convergence/Divergence (MACD), while still in negative territory, is trending sideways, indicating weakening bearish momentum but not yet a reversal. If the price continues to hold above 0.7000, it is likely to test last week's high of 0.7095, followed by 0.7161 (the March 12 high); initial support lies at 0.7000. A decisive break below this area would open the door to a deeper move towards 0.6966 (the 70-day simple moving average), and if selling pressure persists, the 0.6900 level will become a lower structural support.
Consider going long on the Australian dollar at 0.7080 today, with a stop loss at 0.7070 and targets at 0.7150 and 0.7160.
GBP/USD
The GBP/USD pair ended its five-day winning streak, gapping down to around 1.3390 during the Asian session on Monday before rebounding to around 1.35 during the European/American session. This risk-sensitive pair faces renewed risk aversion following the failure of US-Iran peace talks. Safe-haven demand pushed the US dollar stronger against major currencies after the Vice President confirmed that 21 hours of negotiations in Islamabad had failed to reach an agreement. US President Trump stated that Washington would begin blocking all ships entering and leaving the Strait of Hormuz, and US Central Command confirmed that it would begin operations targeting maritime traffic to and from Iranian ports starting at 10:00 AM ET on Monday. Meanwhile, the pound rose against the dollar, supported by optimism regarding potential progress on the Russia-Ukraine peace agreement. However, both sides accused each other of violating the 32-hour Orthodox Easter ceasefire agreement, with over 1,000 drone and artillery attacks reported shortly after the ceasefire began.
The pound is biased to be bullish against the dollar in the short term, as the pair holds above the 38.2% Fibonacci retracement level of its January-March decline. The spot price is currently testing the 200-day simple moving average at 1.3412, indicating buying interest on dips near this long-term reference point. Momentum has improved, with the MACD indicator crossing above its signal line and rising back towards zero, while the 14-day Relative Strength Index (RSI) is at 52.90, indicating moderate bullish momentum and not overbought conditions. Further upside may face immediate resistance at the 50% Fibonacci retracement level of 1.3505. A daily close above this resistance would strengthen the bullish tone and open up space for a move towards the 61.8% Fibonacci retracement level of 1.3588. Initial support is at 1.3356 (34-day simple moving average). A break below this level would expose the 23.6% Fibonacci retracement level at 1.3319, and the psychological level of 1.3300 as the next support.
Consider going long on GBP at 1.3488 today, with a stop loss at 1.3475 and targets at 1.3540 and 1.3550.

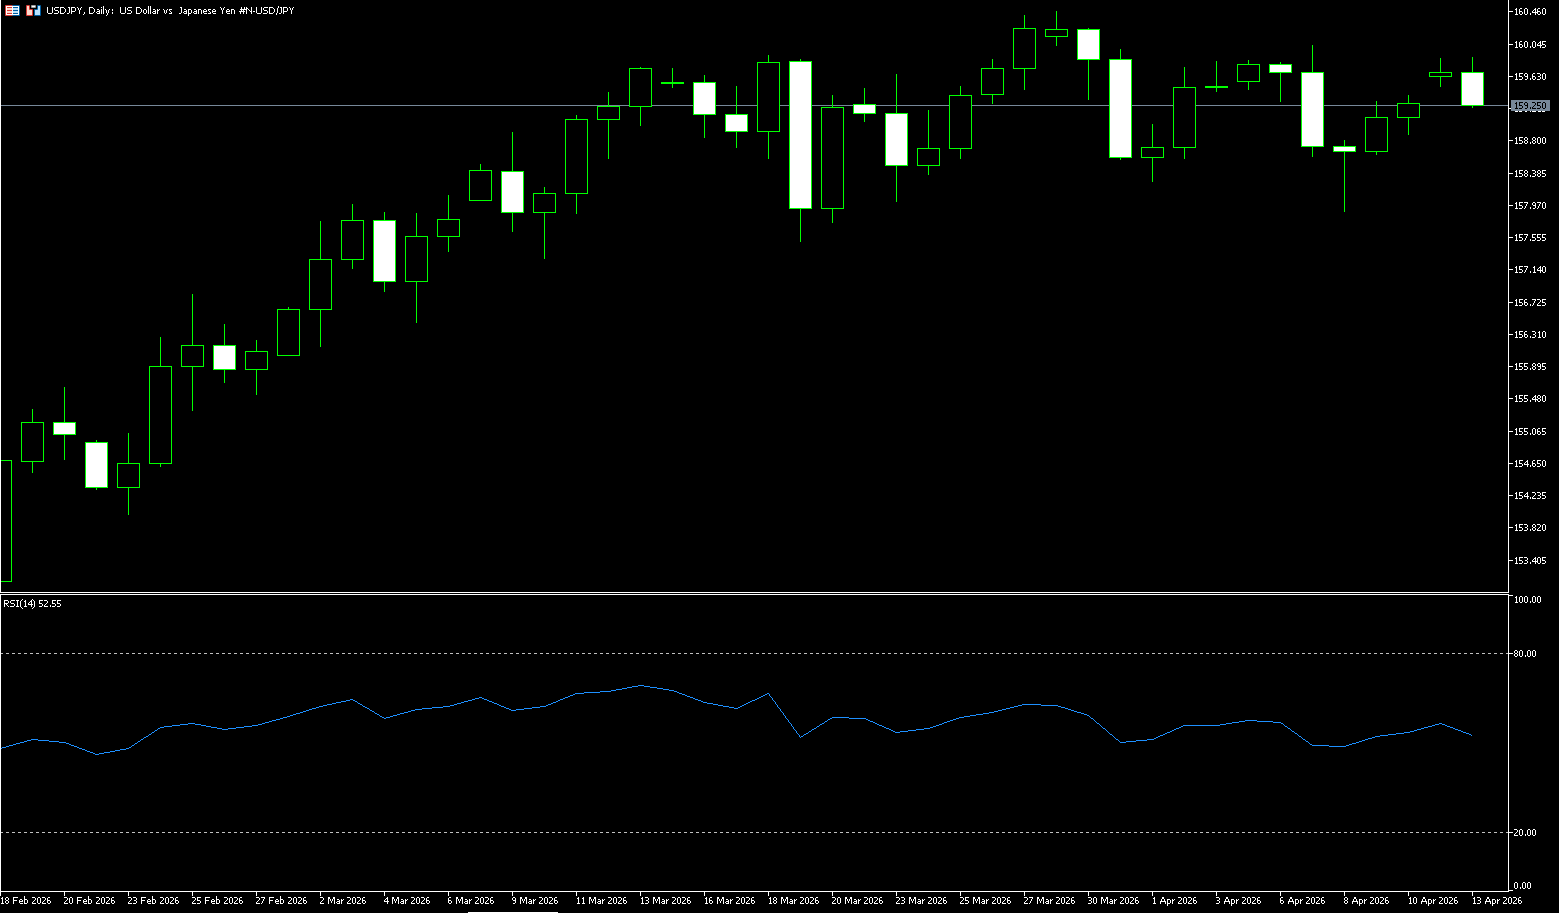
USD/JPY
USD/JPY rose for the third consecutive day, trading around 159.30 on Monday. The pair rose as the dollar strengthened due to safe-haven demand following Vice President Vance's confirmation that the 21-hour talks between the US and Iran in Islamabad failed to reach an agreement. US President Trump stated that the US would begin "blocking" all ships entering and leaving the Strait of Hormuz. US Central Command stated that troops would begin blocking all maritime traffic to and from Iranian ports at 10:00 AM ET (14:00 GMT) on Monday. Iranian Parliament Speaker Mohammad Bagher Ghalibaf stated that despite “constructive initiatives,” the United States failed to win the trust of the Iranian delegation, leaving the decision to Washington. The Iranian Revolutionary Guard Corps (IRGC) warned that any warship approaching the Strait of Hormuz would violate the ceasefire agreement and face a decisive response. Traders await the Bank of Japan's April 27-28 meeting, where policymakers will assess whether rising global energy and commodity prices necessitate an interest rate hike. The Sakura report showed that board members weighed upside risks to inflation against downside risks to economic growth following the April 6 branch manager meeting. All nine regions reported their economies as “moderately recovering,” “recovering,” or “moderately recovering.”
The USD/JPY exchange rate extended its modest rebound from below 158.00 last week (a near three-week low), rising slightly below the 160.00 level and supported by multiple factors. The yen was pressured by economic concerns stemming from the Middle East conflict, coupled with a slight strengthening of the US dollar, which propelled the pair. From a technical perspective, spot prices have shown some resilience below the support level of 158.25-158.20, and subsequent upward movements are favorable for bullish traders. On the upside, 160 (a psychological level) and 160.46 (this year's high) could be considered. However, the Relative Strength Index (RSI) near 50.0 indicates neutral momentum after the rebound from oversold territory, while the Moving Average Convergence Divergence (MACD) hovering below zero suggests that downward pressure remains relatively weak but is trending towards stabilization. On the downside, the 159.20 (25-day moving average) and 159.00 (psychological level) area represent key levels that buyers expect to hold to maintain the current constructive structure within this timeframe. A sustained break below these levels would weaken bullish sentiment and expose deeper potential for a correction to the 158.00 level.
Consider shorting the US dollar today at 159.50, with a stop-loss at 159.70 and a target of 158.60. 158.40
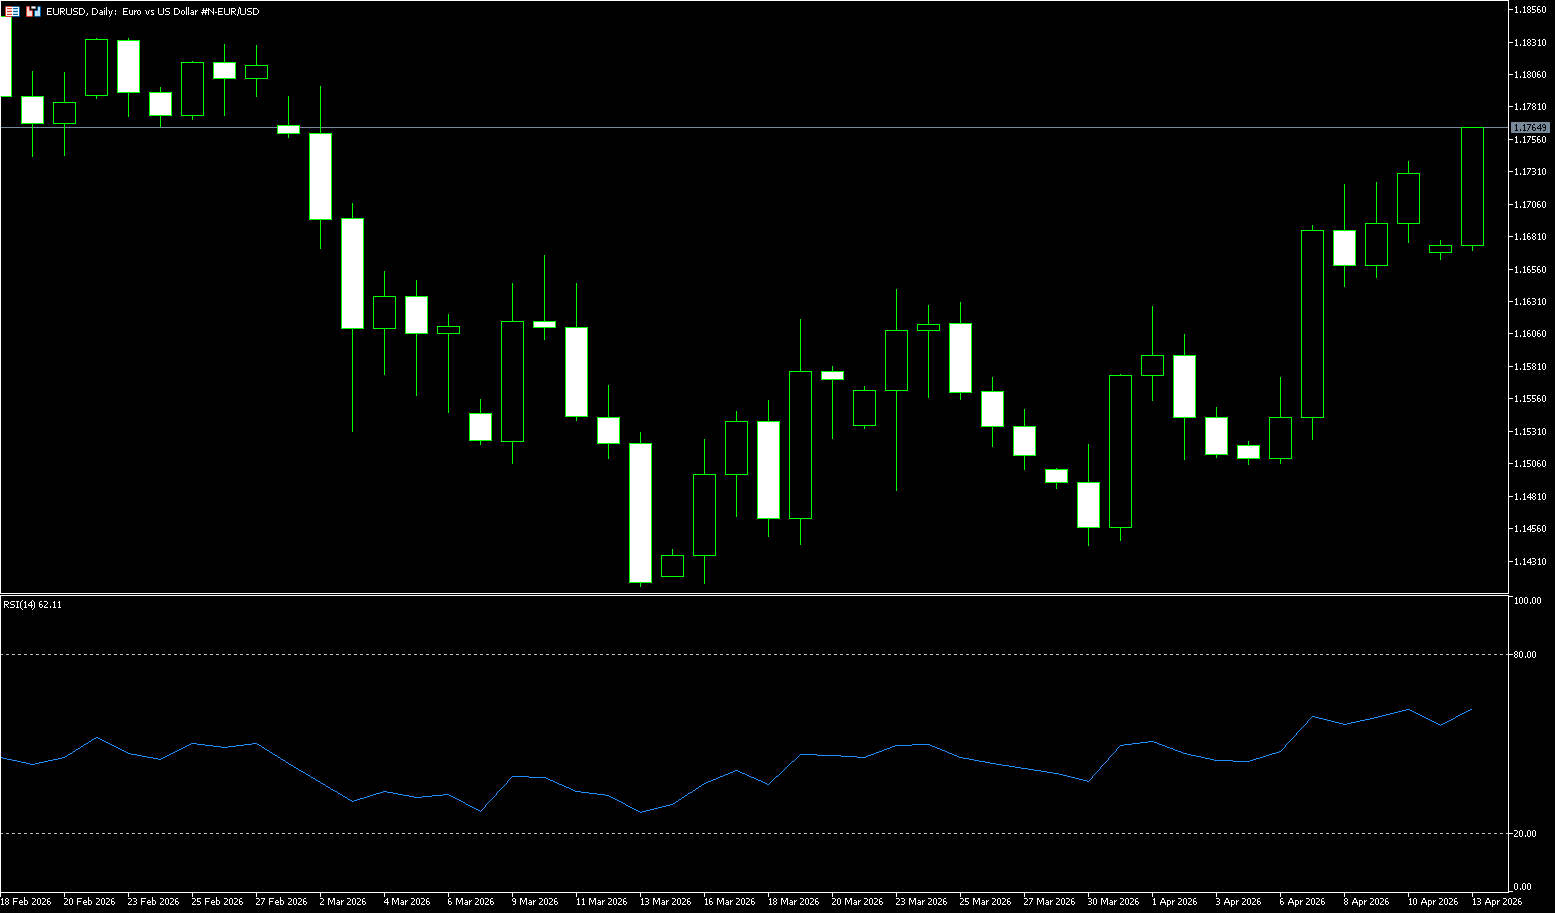
EUR/USD
The euro/dollar weakened due to risk aversion, likely attributed to the failure of US-Iran peace talks. The pair traded around 1.1680 during the European session, opening lower on Monday. US Vice President Vance stated that Washington and Tehran failed to reach a peace agreement after 21 hours of negotiations in Islamabad. Vance also noted that the negotiations had not yet produced a mutually acceptable agreement, emphasizing the need for solid guarantees that Iran would not pursue nuclear weapons. Meanwhile, US President Trump announced that the US would begin "blockading" all ships entering and leaving the Strait of Hormuz. US forces will begin blocking all maritime traffic to and from Iranian ports at 10:00 AM Eastern Time on Monday. Iranian Parliament Speaker Mohammad Bagher Ghalibaf warned that any warship approaching the Strait of Hormuz would violate the ceasefire agreement and face a decisive response.
From a technical perspective, the overnight break above the 1.1670 confluence zone—comprising the 200-day simple moving average (1.1672) and the 38.2% Fibonacci retracement level of the January-March decline—is favorable for EUR/USD bulls. Furthermore, momentum indicators support a constructive move, with the 14-day Relative Strength Index (RSI) hovering around 56.54, not yet overbought, and the Moving Average Convergence Divergence (MACD) in positive territory. Initial attention should be paid to the 50.0% Fibonacci retracement level around 1.1742 and 1.1740 (last week's high); a decisive break below these levels would target 1.1800 (a psychological level). On the downside, short-term support lies at the 200-day simple moving average at 1.1672 and the nearby 38.2% Fibonacci retracement level at 1.1665, with a deeper pullback targeting the 1.1600 (psychological level).
Consider going long on the Euro today at 1.1743, with a stop-loss at 1.1730 and targets at 1.1790 and 1.1800.
Disclaimer: The information contained herein (1) is proprietary to BCR and/or its content providers; (2) may not be copied or distributed; (3) is not warranted to be accurate, complete or timely; and, (4) does not constitute advice or a recommendation by BCR or its content providers in respect of the investment in financial instruments. Neither BCR or its content providers are responsible for any damages or losses arising from any use of this information. Past performance is no guarantee of future results.
More Coverage


Risk Disclosure:Derivatives are traded over-the-counter on margin, which means they carry a high level of risk and there is a possibility you could lose all of your investment. These products are not suitable for all investors. Please ensure you fully understand the risks and carefully consider your financial situation and trading experience before trading. Seek independent financial advice if necessary before opening an account with BCR.
BCR Co Pty Ltd (Company No. 1975046) is a company incorporated under the laws of the British Virgin Islands, with its registered office at Trident Chambers, Wickham’s Cay 1, Road Town, Tortola, British Virgin Islands, and is licensed and regulated by the British Virgin Islands Financial Services Commission under License No. SIBA/L/19/1122.
Open Bridge Limited (Company No. 16701394) is a company incorporated under the Companies Act 2006 and registered in England and Wales, with its registered address at Kemp House, 160 City Road, London, City Road, London, England, EC1V 2NX. This entity acts solely as a payment processor and does not provide any trading or investment services.

 English
 简体中文
简体中文
 繁體中文
繁體中文
 Bahasa
Melayu
Bahasa
Melayu
 Tiếng
Việt
Tiếng
Việt
 ไทย
ไทย
 日本語
日本語
 한국어
한국어
 ភាសាខ្មែរ
 español