


0
US Dollar Index
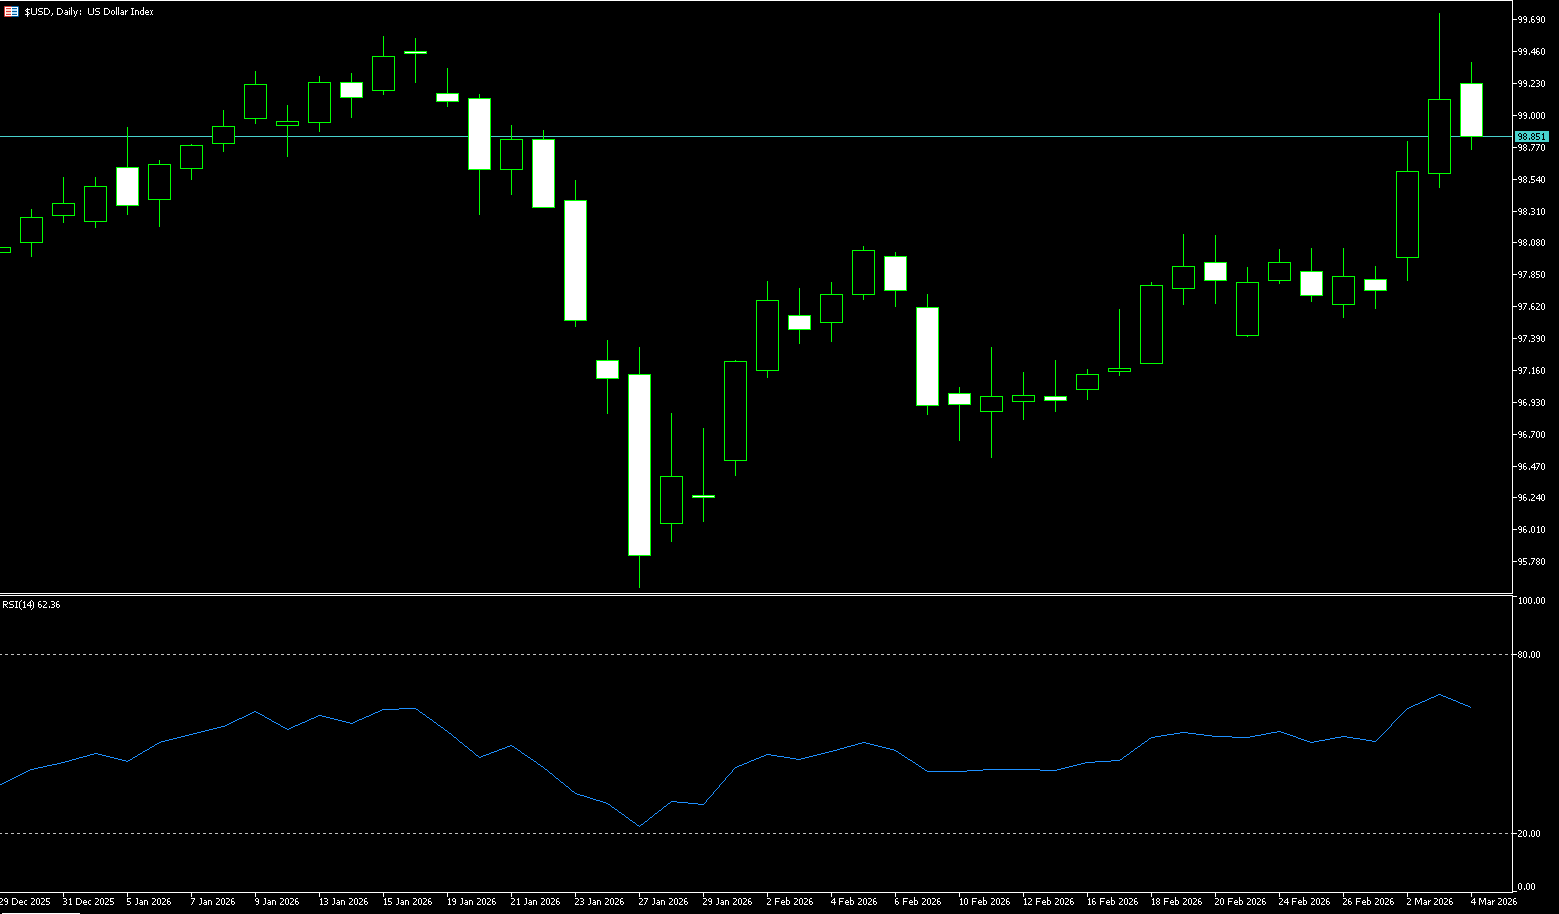
The US dollar index remained below 99 on Wednesday, after two days of sharp rebounds, as concerns about a potential continuation of the Middle East conflict drove up energy prices, exacerbating inflation fears. Traders lowered their expectations for a Federal Reserve rate cut, now anticipating the next cut in September rather than July, although two 25-basis-point cuts are still expected this year. The dollar was also supported by safe-haven demand as the US-Israel conflict entered its fifth day, following Israel's attack on a building at a religious leaders' meeting on Tuesday to elect a new supreme leader. US President Donald Trump expressed concern that such attacks could lead to a new Iranian leadership as unsettling as the previous regime, highlighting the uncertainty of the conflict. The dollar generally strengthened, gaining the most against the euro and the Australian and New Zealand dollars so far this week.
From a fundamental perspective, if high oil prices increase the probability of the Federal Reserve holding rates steady or even raising them in June, the dollar will continue to strengthen. From a technical perspective, as long as the US dollar index holds above the 50-day (97.94) and 200-day (98.34) moving averages, it will maintain a bullish trend. Looking at the daily chart, the main trend for the US dollar index is upward. This recent rapid rise over the past two days began at the start of the week with a break above the 50-day moving average, followed by a further increase after breaking above the 200-day moving average. These moving averages have now become support levels. Furthermore, after breaking through the previous swing high of 98.078, this indicator confirms a bullish trend. The next targets are the swing highs of Tuesday: 99.68 and 100.00 (a psychological level). On the downside, watch the 98.50 (89-day moving average) and 98.38 (5-day moving average) areas.
Today, consider going long on the US Dollar Index around 98.70; Stop loss: 98.60, Target: 99.20; 99.30
WTI Crude Oil
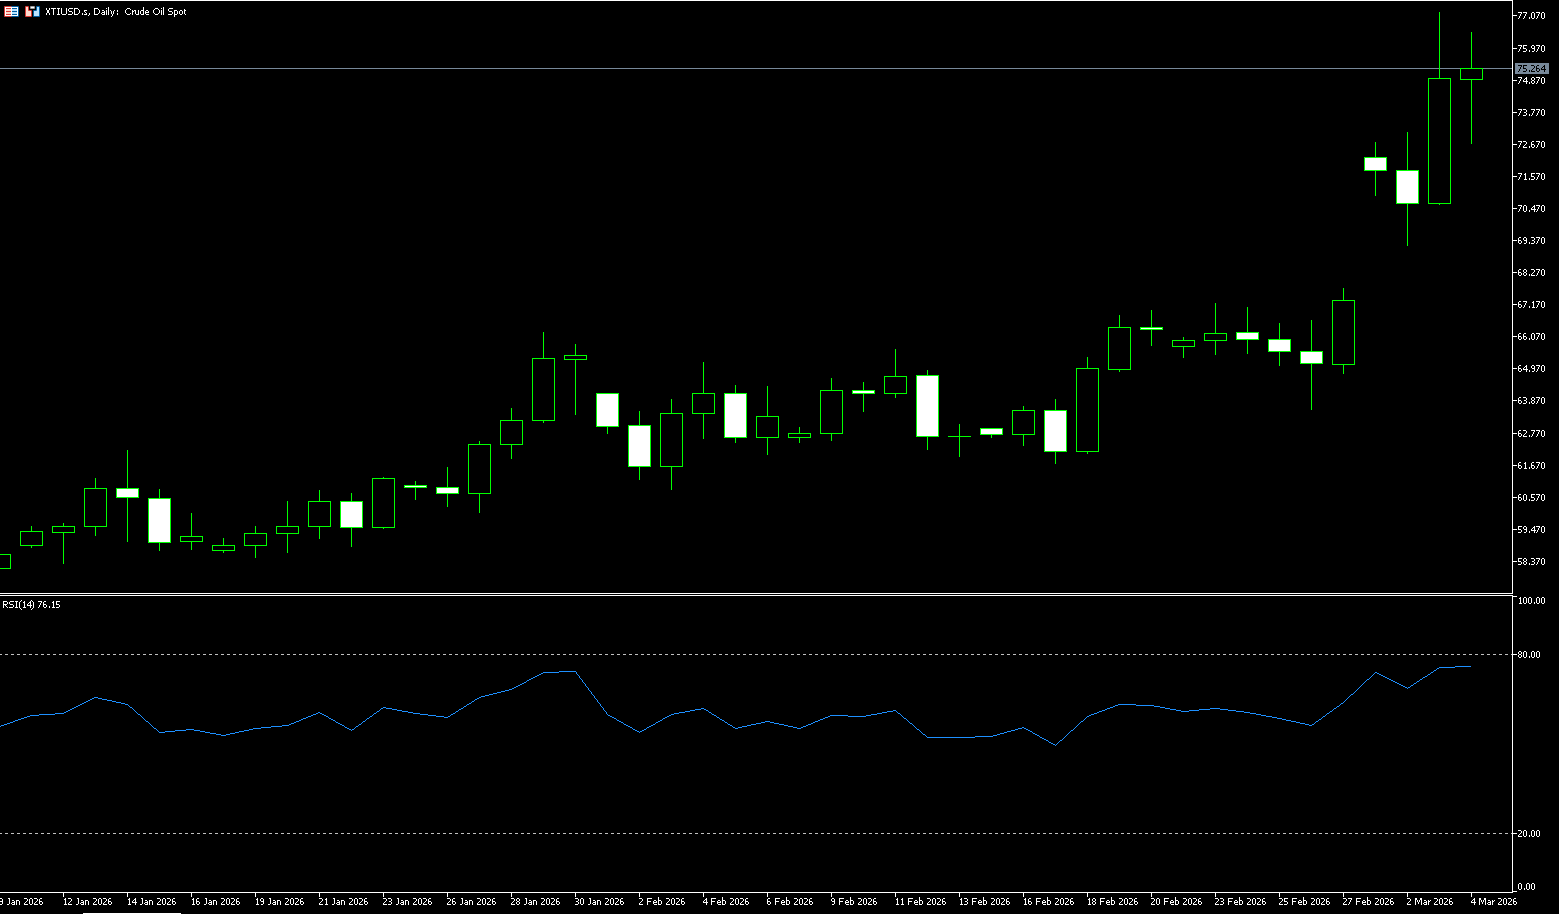
WTI crude oil traded around $73.60 per barrel on Wednesday. Oil prices rose more than 3% on Tuesday as tensions escalated in the Middle East. Israeli and US forces launched heavy strikes against multiple targets in Iran, triggering retaliatory attacks by Iran in the Persian Gulf, and the conflict has spread to Lebanon. Affected by war fears and attacks on energy facilities, crude oil prices rose sharply as traders began pricing in the risks in the Strait of Hormuz and the supply shock from production shutdowns. The scope and intensity of the conflict continue to expand: Israel launched attacks on neighboring Lebanon, while Iran bombed energy facilities in Gulf countries and oil tankers in the Strait of Hormuz. The Strait of Hormuz is crucial, as approximately 20% of the world's oil and liquefied natural gas (LNG) supply passes through it. The responses of the attacked countries further pushed up oil prices. Reports indicate that Qatar has shut down LNG production, and Saudi Arabia has suspended operations at its largest refinery. Furthermore, some Israeli gas fields have ceased production, and according to Reuters, oil production in the Iraqi Kurdish region has "almost completely stopped."
Looking at the crude oil price chart, prices surged by over 10% in the first ten days of this week, coupled with a 3% increase at the end of last week, demonstrating a strong upward trend in the short term. If the Middle East conflict continues to escalate, and tanker shipping in the Strait of Hormuz is restricted for several weeks, crude oil prices could easily break through $100 per barrel, and may even reach higher levels. Regarding whether the US president will reintroduce "TACO" (targeted economic or energy support policies) should the market experience a sharp decline, investors seem to still hold expectations. However, it should be noted that compared to previous regional conflicts, the current Middle East situation presents a significantly greater risk exposure, involves more complex interests, and has a much higher probability and potential impact of escalation. Therefore, investors' optimistic expectations should be treated with caution. On the upside, the key level to watch is $77.20 (the high on March 3rd), with subsequent resistance estimated at $80 (the psychological level). On the downside, watch for $73.20 (early week high), followed by the psychological level of $70.
Consider going long on crude oil around $73.30 today; stop loss: $73.10, target: $74.50; $75.00
Spot Gold
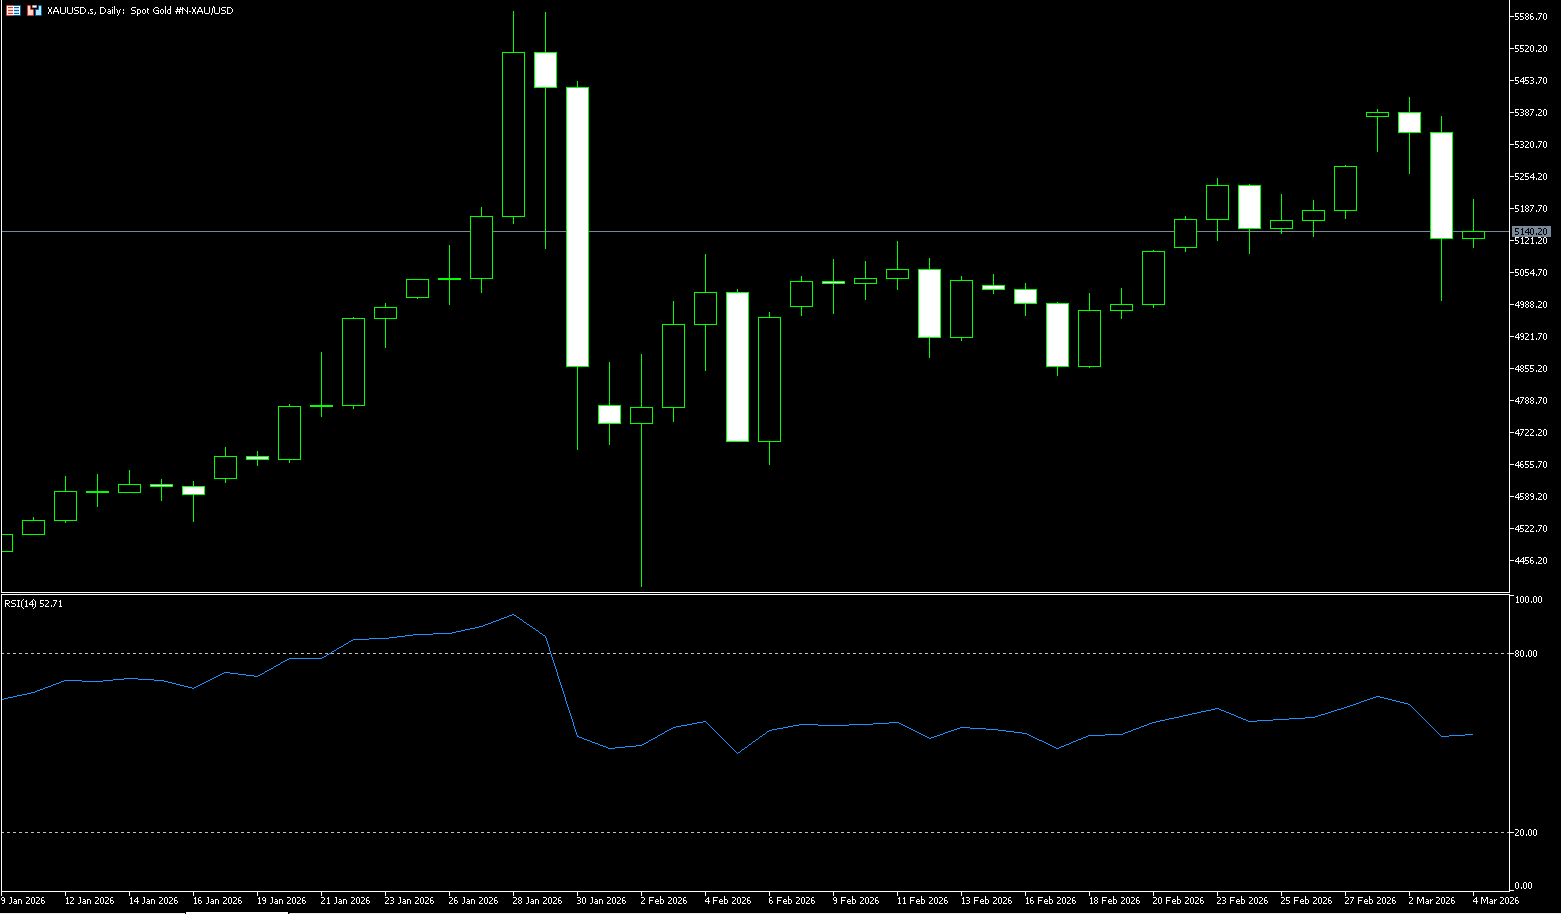
On Wednesday in European trading, spot gold traded around $5,170 per ounce. Gold prices fell more than 5% on Tuesday, weighed down by a stronger dollar and a dimming prospect of interest rate cuts. The market's expectation of a Fed rate cut has been postponed from July to September. Spot gold and April gold futures fell sharply on Tuesday, with demand for the dollar far exceeding that for gold. Despite the ongoing conflict, the market did not see safe-haven buying; at the same time, gold's appeal as an investment asset also waned today, failing to even hedge against the stock market sell-off. The current gold sell-off may stem from margin calls in the stock market. When the stock market falls, exchanges require leveraged investors to make margin calls. When investors need to raise cash, they often sell their most profitable assets. Looking at the performance at the beginning of this year, gold is precisely this type of asset that is easily sold off.
The ultimate direction of gold prices depends on how long high oil prices persist—oil prices will push up inflation concerns, potentially triggering a Federal Reserve rate hike and strengthening and stabilizing the dollar. In this scenario, gold is bearish in the short term. However, from a technical perspective, gold is still in an upward trend, but the decline has been rapid. If gold traders shift from safe-haven buying to a value-driven investment logic, a pullback to the 35-day simple moving average of $5,006 and the $5,000 psychological level would be a reasonable scenario. After this correction, if there are no signs of a quick resolution to the conflict, oil prices remain high, inflationary pressures persist, and the Federal Reserve is forced to postpone or even shift to a neutral-to-tight policy, gold is likely to resume its upward trend and may even challenge higher levels. The current short-term resistance levels are at $5,193 (9-day simple moving average) and $5,200 (a psychological level). A break above these levels could lead to tests of $5,265 (the February 27 high) and $5,300 (a psychological level).
Consider going long on gold today around $5,160; stop-loss: $5.150, target: $5,260; $5,280
AUD/USD
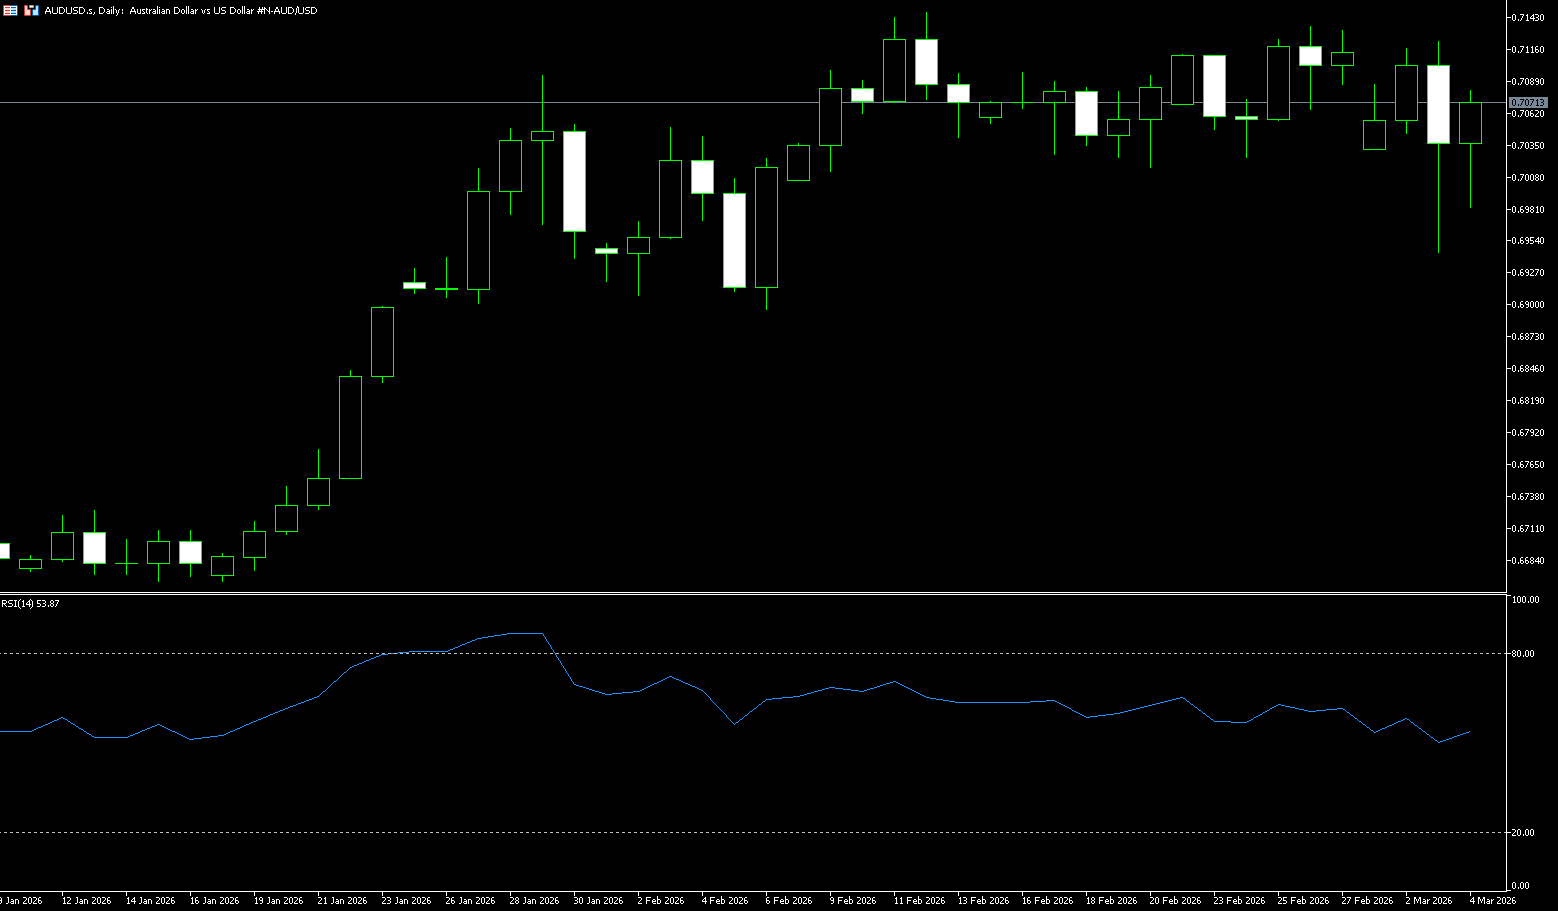
The AUD/USD pair extended its losses for the second consecutive trading day on Wednesday during the European session, trading around 0.7050. The pair came under pressure after the release of Australian GDP data. Data released by the Australian Bureau of Statistics on Wednesday showed that the economy grew by 0.8% quarter-on-quarter in the fourth quarter of 2025, accelerating from 0.5% in the third quarter and exceeding market expectations of 0.6%. On an annual basis, fourth-quarter GDP grew by 2.6%, higher than the previous quarter's 2.1% and the market consensus expectation of 2.2%. Final data showed that the S&P Global Australian Services PMI fell to 52.8 in February from 56.3 in January, indicating continued but slowing expansion in service sector activity. The AUD/USD pair also weakened against a backdrop of renewed demand for the US dollar, supported by diminished expectations of a Fed rate cut.
Australia's macroeconomic backdrop is resilient, and the Australian dollar performs well when risk appetite is healthy. A pullback could occur quickly if the US dollar regains sustained momentum or global sentiment deteriorates. On the daily chart, AUD/USD is trading around 0.7050. The near-term bias is neutral with a downward bias. Currently, the pair remains above the rising 55, 100, and 200-day simple moving averages, which still indicate a broader uptrend, but the 14-day Relative Strength Index (RSI) has retreated from overbought territory to 48.80, indicating weakening bullish momentum and a bias towards consolidation or corrective pressure in the short term. Immediate resistance is seen at the 9-day simple moving average at 0.7076, followed by the psychological level resistance at 0.7100. On the downside, initial support is at 0.6952 (40-day simple moving average). A break below this level would expose further losses to the 0.6900 support level.
Consider shorting the Australian dollar today around 0.7064; Stop loss: 0.7078; Target: 0.7000; 0.6990
GBP/USD
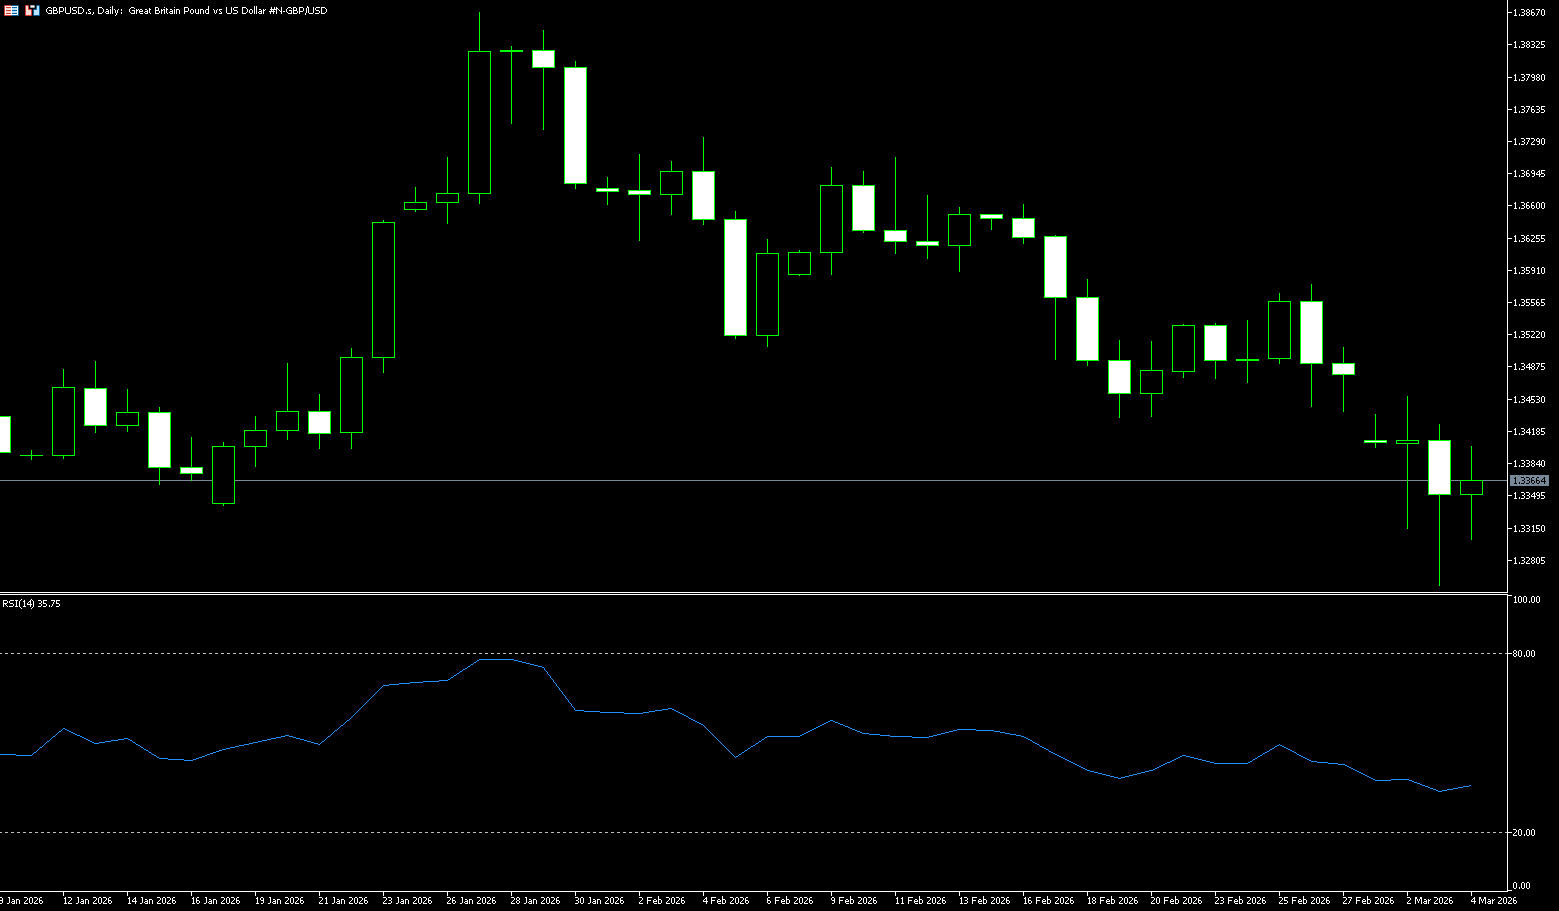
GBP/USD gained momentum on Wednesday, moving towards 1.3400. Despite no news indicating easing of tensions in the Middle East, a modest rebound in US stock index futures limited the dollar's gains and helped the pair hold steady. The pound had fallen to 1.3253, below $1.3300, in early March, its lowest level since December 2025, as safe-haven demand fueled a dollar rally amid escalating Middle East tensions. Increased domestic political uncertainty following Labor's unexpected defeats in Gordon and Denton further pressured the currency. The Labour Party won the seat easily in the 2024 general election. This result has increased concerns about Starmer and Chancellor Rachel Reeves, fearing they might be replaced by ministers pushing for higher fiscal spending, which could further exacerbate public finances pressures in the UK.
On the daily chart, GBP/USD is trading around 1.3370. The short-term bias is slightly bearish, as the spot price has broken below the 50-day simple moving average at 1.3538, while the 200-day simple moving average, hovering around 1.3447, has now become dynamic resistance. The recent failure to maintain gains above 1.36 has resulted in a series of lower closes, and the daily stochastic oscillator, after retreating from overbought levels, remains near 40, indicating weakening momentum rather than a full bearish reversal. This suggests a consolidation above recent lows rather than a sustained downward breakout. A break below 1.3300 (the psychological level) and 1.3280 (Tuesday's low) would confirm a deeper correction towards 1.3250 (the 300-day simple moving average).
Consider shorting GBP/USD today around 1.3380; Stop loss: 1.3390, Target: 1.3330; 1.3320
USD/JPY
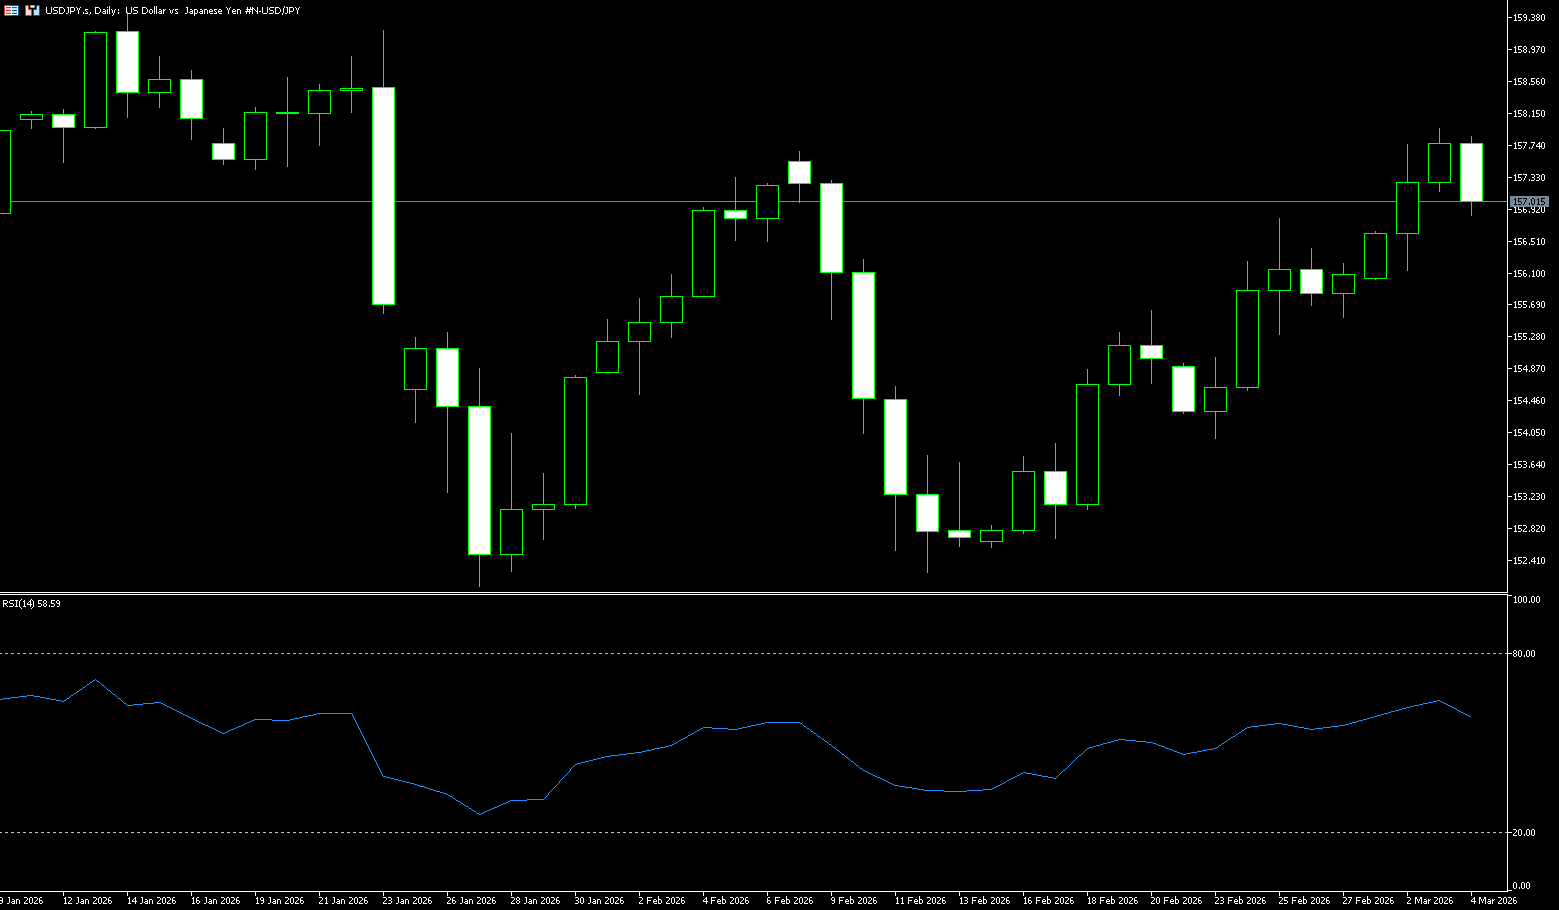
During Wednesday's Asian trading session, USD/JPY consolidated in the 157.20-157.30 range, as bullish concerns about intervention became more cautious after the recent rally brought it to a near six-week high. Meanwhile, reduced bets on an imminent Bank of Japan rate hike weakened the yen, while safe-haven demand benefited the dollar's status as the global reserve currency, as market expectations of a less dovish Federal Reserve provided a tailwind for the pair. It touched around 157.97 intraday this week, continuing its recent upward trend. Japanese government bond yields rose across the board on the same day, reflecting a shift in market pricing from the ongoing Middle East conflict to inflationary pressures. This background is directly related to the yen's exchange rate movement, with authorities simultaneously increasing their monitoring of market volatility. Looking ahead, if the Middle East conflict continues to push up inflation expectations and Japanese bond yields remain high, without a significant strengthening of intervention signals from the Japanese authorities, the USD/JPY pair is expected to continue its upward trend, gradually testing higher resistance areas.
Overall, the resonance between fundamental inflation concerns and technical bullish momentum remains dominant, but the risk of intervention, as a core variable, will determine the sustainability of the upward movement. The market needs to continuously monitor the results of Japanese government bond auctions, statements from the Ministry of Finance, and the latest developments in the Middle East situation to grasp the changing pace. The short-term resistance range is focused on 157.65 to 157.97. The former is the high point in February, and the latter is the high point this week. The rationale is that the K-line has tested 157.65-157.97 multiple times and experienced slight pullbacks; a breakout requires increased trading volume and further expansion of the MACD histogram. If the price holds above 157.65-157.97, it opens the possibility of testing 159.45 (the high for 2026) and potentially moving towards the psychological level of 160. Support lies between 156.50 and 156.33. The former represents the high of February 26th, providing dynamic support for trend continuation; the latter is the 9-day moving average, forming a stronger retracement buffer. A break above this level would test 155.82 (the 89-day moving average), and holding above this support would maintain bullish control.
Today, consider shorting the US dollar near 157.55; Stop loss: 157.70; Target: 156.60; 156.50
EUR/USD
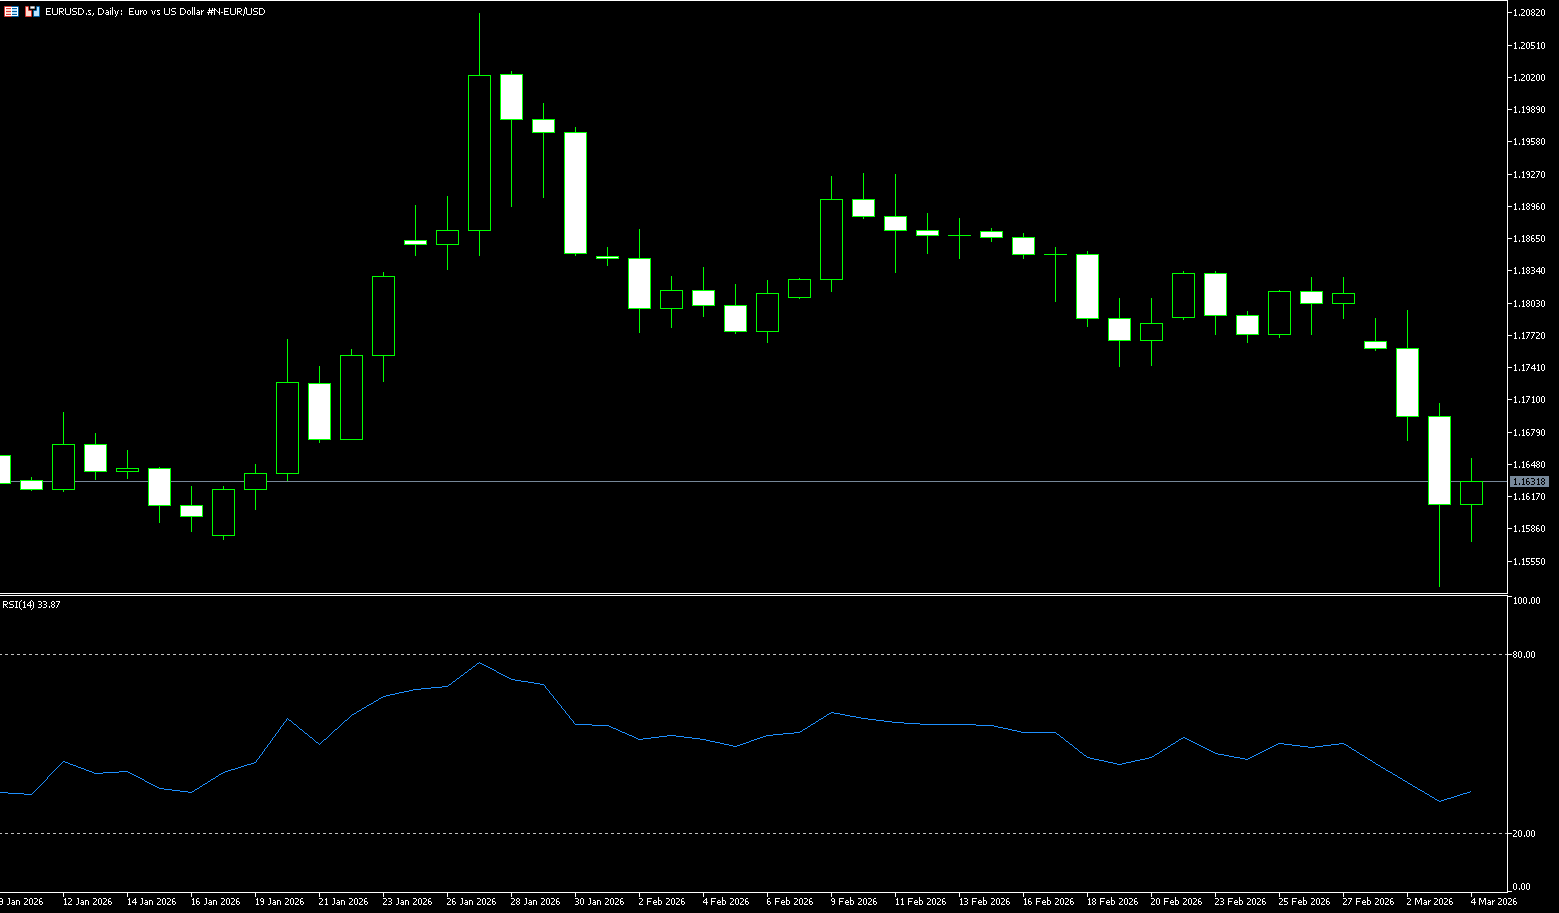
The EUR/USD pair rebounded slightly during Wednesday's European trading session, trading within a positive range above 1.1600. Improved risk sentiment made it difficult for the dollar to maintain its strength, helping the pair to rise slightly as market focus shifted to key US data releases. Spot prices retreated to around 1.1600 during the Asian session, seemingly facing further downside risk. The broader conflict in the Middle East shows little sign of abating, fueling concerns about the inflationary effects of prolonged war. This, coupled with reduced bets on more aggressive monetary easing by the Federal Reserve, further supports the safe-haven dollar. Meanwhile, the closure of the Strait of Hormuz has raised concerns about supply disruptions in key oil-producing regions. Given Europe's reliance on imported energy, further increases in crude oil and gas prices could pose a significant economic shock. This is another factor putting pressure on the euro and confirms the negative short-term outlook for the EUR/USD pair.
On the daily chart, EUR/USD is trading around 1.1630. The pair has fallen below the 210-day simple moving average, which is around 1.1649, while still challenging the 250-day simple moving average around 1.1565, maintaining a slightly bullish but weakening bias. The 14-day Relative Strength Index (RSI) has fallen to 36, indicating weakening upward momentum after failing to maintain gains above 1.18 recently. Immediate resistance is at 1.1649 (210-day simple moving average), which has limited the latest rally, followed by higher resistance at 1.1700 (psychological level). A daily close above 1.1700 would reopen the path to 11800. On the downside, initial support is at the 250-day simple moving average at 1.1565, with deeper support at 1.1500 (psychological level). A break below this level would expose lower support and suggest a shift to a broader bearish phase.
Consider shorting the Euro today near 1.1644; Stop loss: 1.1655; Targets: 1.1570, 1.1580
Disclaimer: The information contained herein (1) is proprietary to BCR and/or its content providers; (2) may not be copied or distributed; (3) is not warranted to be accurate, complete or timely; and, (4) does not constitute advice or a recommendation by BCR or its content providers in respect of the investment in financial instruments. Neither BCR or its content providers are responsible for any damages or losses arising from any use of this information. Past performance is no guarantee of future results.
More Coverage


Risk Disclosure:Derivatives are traded over-the-counter on margin, which means they carry a high level of risk and there is a possibility you could lose all of your investment. These products are not suitable for all investors. Please ensure you fully understand the risks and carefully consider your financial situation and trading experience before trading. Seek independent financial advice if necessary before opening an account with BCR.
BCR Co Pty Ltd (Company No. 1975046) is a company incorporated under the laws of the British Virgin Islands, with its registered office at Trident Chambers, Wickham’s Cay 1, Road Town, Tortola, British Virgin Islands, and is licensed and regulated by the British Virgin Islands Financial Services Commission under License No. SIBA/L/19/1122.
Open Bridge Limited (Company No. 16701394) is a company incorporated under the Companies Act 2006 and registered in England and Wales, with its registered address at Kemp House, 160 City Road, London, City Road, London, England, EC1V 2NX. This entity acts solely as a payment processor and does not provide any trading or investment services.

 English
 简体中文
简体中文
 繁體中文
繁體中文
 Bahasa
Melayu
Bahasa
Melayu
 Tiếng
Việt
Tiếng
Việt
 ไทย
ไทย
 日本語
日本語
 한국어
한국어
 ភាសាខ្មែរ
 español