


0
US Dollar Index
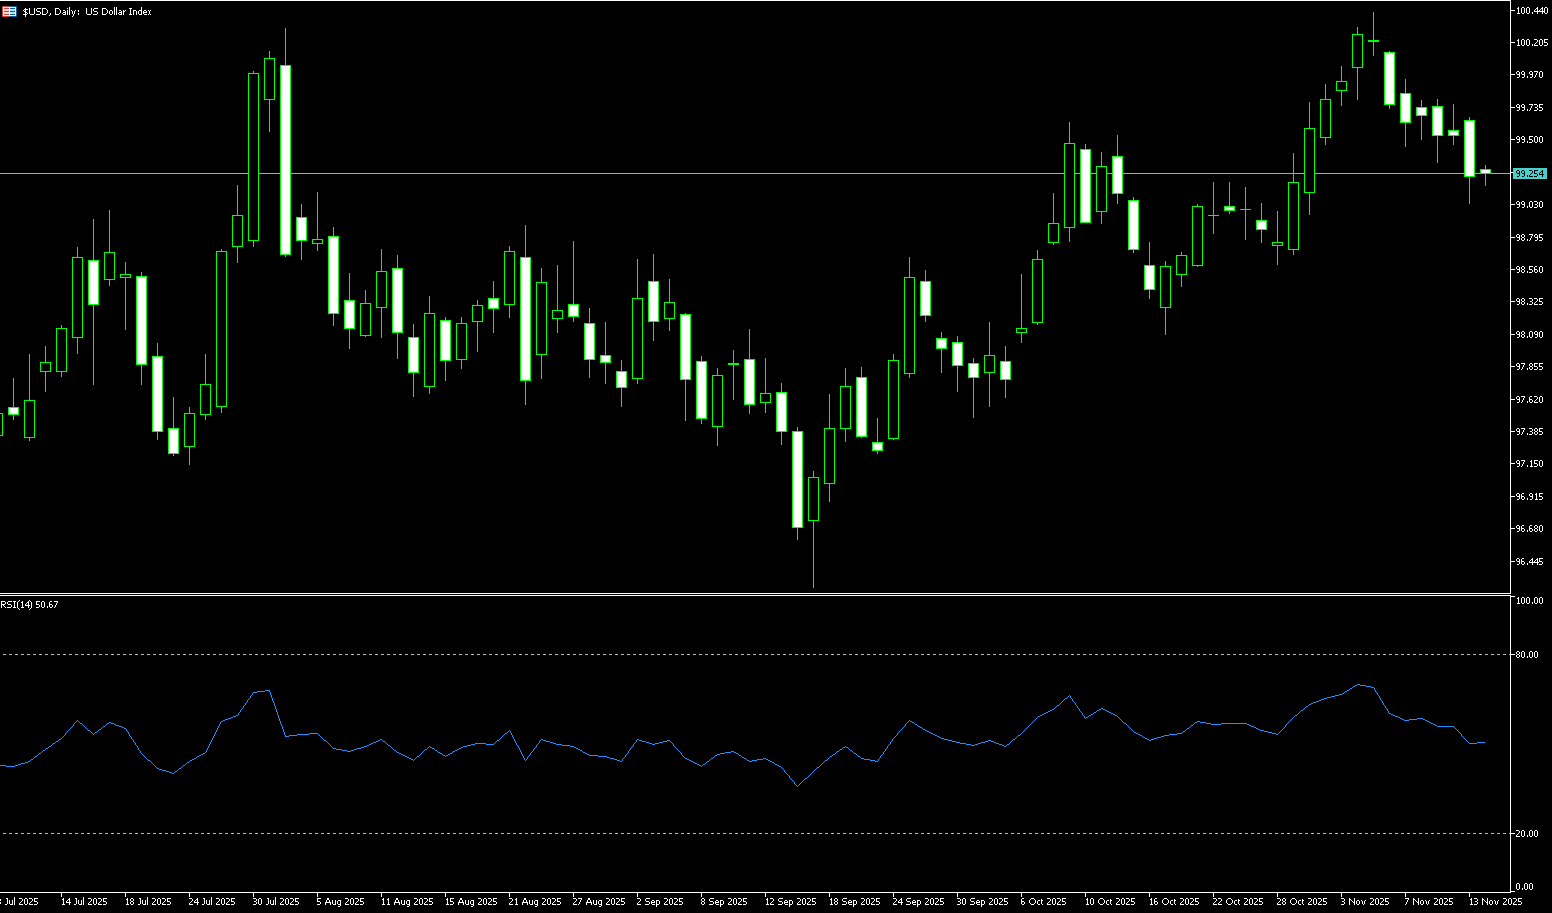
The US dollar index climbed above 100.20, its highest level in nearly two weeks, as traders reduced their expectations for another Federal Reserve rate cut in December. Market pricing now implies a probability of about 34% for a 25 basis point cut in the federal funds rate. It briefly touched a new high of 100.25 during the session, as investors await key US data to provide clarity on the Fed's policy path. The dollar's strength stems primarily from two factors. In Japan, while Bank of Japan Governor Kazuo Ueda hinted at a possible rate hike as early as next month, Prime Minister Sanae Takaichi expressed dissatisfaction, demanding the central bank cooperate with the government to revive the economy. This policy disagreement has raised concerns about fiscal discipline in Japan. Prime Minister Takaichi's push for Abenomics-style policies will continue to put pressure on the yen. In the US, recent data shows signs of an economic slowdown, but expectations for rate cuts are weakening. Market focus is shifting to the US September jobs report, expected to be released on Thursday, which will provide important clues for the Fed's next move.
The daily chart shows that the US dollar remains mildly bullish in the short term. The dollar index is holding above the Bollinger Bands average of 99.55, and the cooling of expectations for aggressive rate cuts is helping to maintain bullish activity. However, in the absence of catalysts, the dollar index may oscillate between moving averages until the non-farm payroll report provides the next push. The current RSI value is 65, in the neutral-to-strong range, not yet overbought, and still has room to rise. The MACD indicator shows that short-term momentum has weakened, and the risk of a pullback should be noted, but as long as the DIFF does not fall below the zero line, the medium-term bullish structure remains intact. Currently, the dollar index is under pressure near 100.53 (the high on May 29). A break above this level would target 101.00 (the psychological level); if it falls back, attention should be paid to the effectiveness of the support zone at the 200-day moving average of 99.88 and the Bollinger Bands average of 99.55.
Today, consider shorting the US Dollar Index around 100.30; Stop loss: 100.40; Target: 99.85; 99.90
WTI Crude Oil
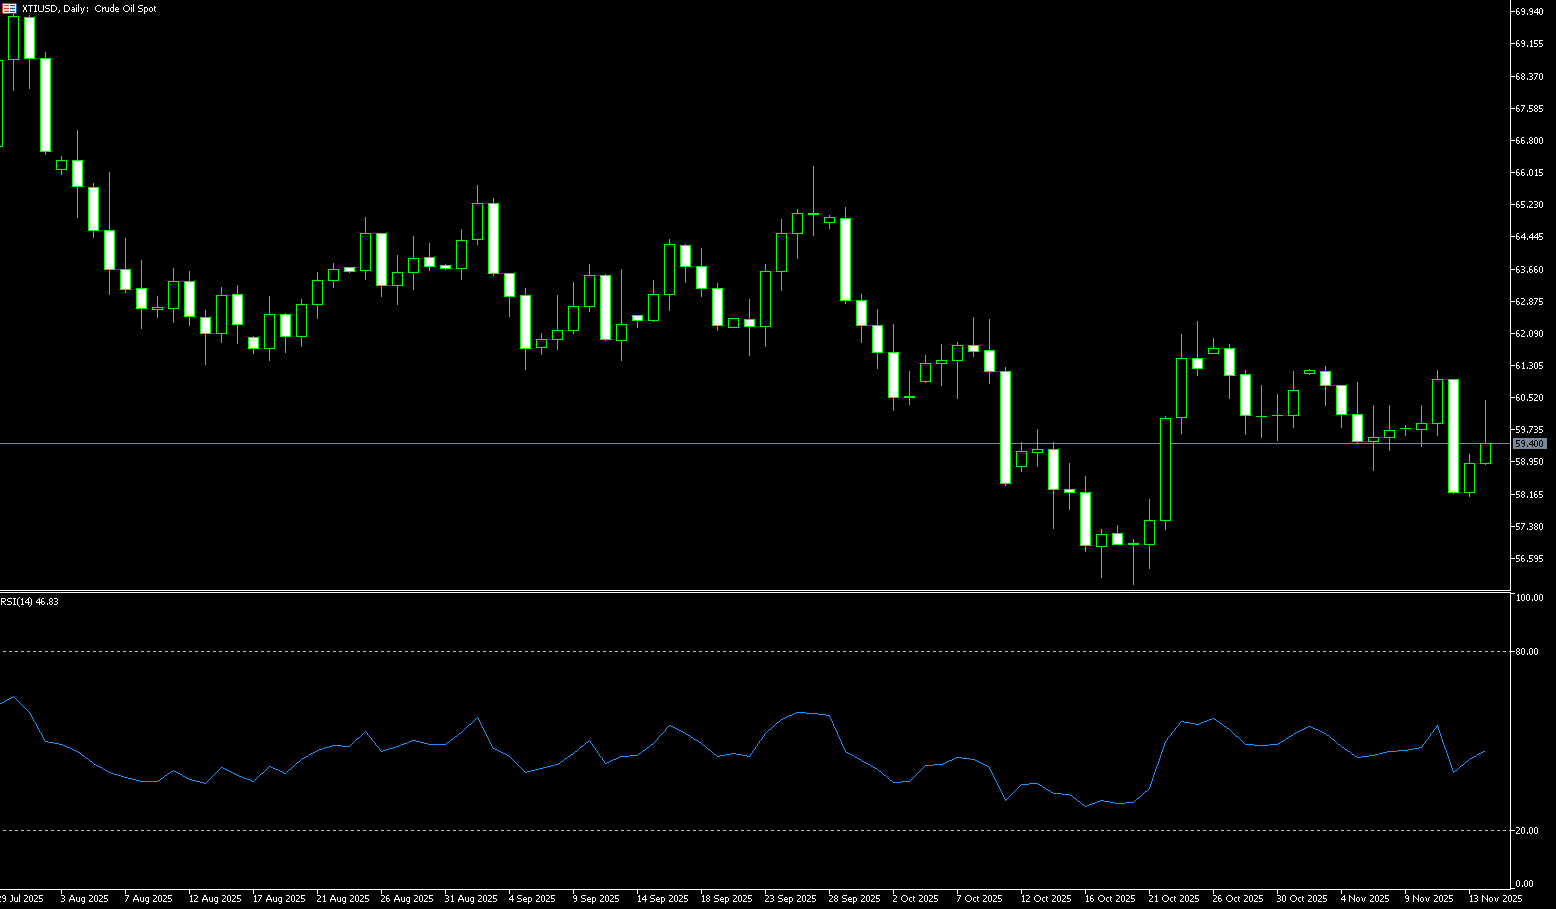
US crude oil traded around $58.80 per barrel on Thursday, weighed down by reports that the US had signaled to Ukrainian President Zelensky that he accept a US-drafted ceasefire framework involving Kyiv relinquishing some territory and weapons. It was reported that the US had signaled to Ukrainian President Zelensky that he accept a US-drafted ceasefire framework involving Kyiv relinquishing some territory and weapons. An end to the war would pave the way for increased Russian oil exports, exacerbating market concerns about oversupply. Although US sanctions against Rosneft and Lukoil have reduced Moscow's oil revenues, and the November 21 business deadline is approaching, the reduced geopolitical risk premium has made investors more focused on weak market fundamentals. On the other hand, Russia is expected to reach its OPEC+ production quota by the end of 2025 or early 2026, indicating a potential for further supply increases.
In summary, Russia's response has alleviated previous concerns in the crude oil market regarding short-term tightness in delivery-side inventories and refined product inventory gaps. However, the market faces long-term pressure from record-high US production, high global inventories, and supply-demand imbalances, intensifying the battle between bulls and bears. Two consecutive rapid unilateral declines of over 3% in oil prices within six trading days indicate strong bearish momentum. The long-term bearish fundamentals mean that every rebound may be a good selling opportunity, and chasing highs is an unwise market strategy. Currently, key support levels remain at $58.42 (lower Bollinger Band) and $57.31 (October 22nd low), while $60.00, having been broken, has now become a resistance level. The next key level is $61.59 (upper Bollinger Band).
Today, consider going long on WTI crude oil around 58.60; Stop loss: 58.45; Target: 60.30; 60.50
Spot Gold
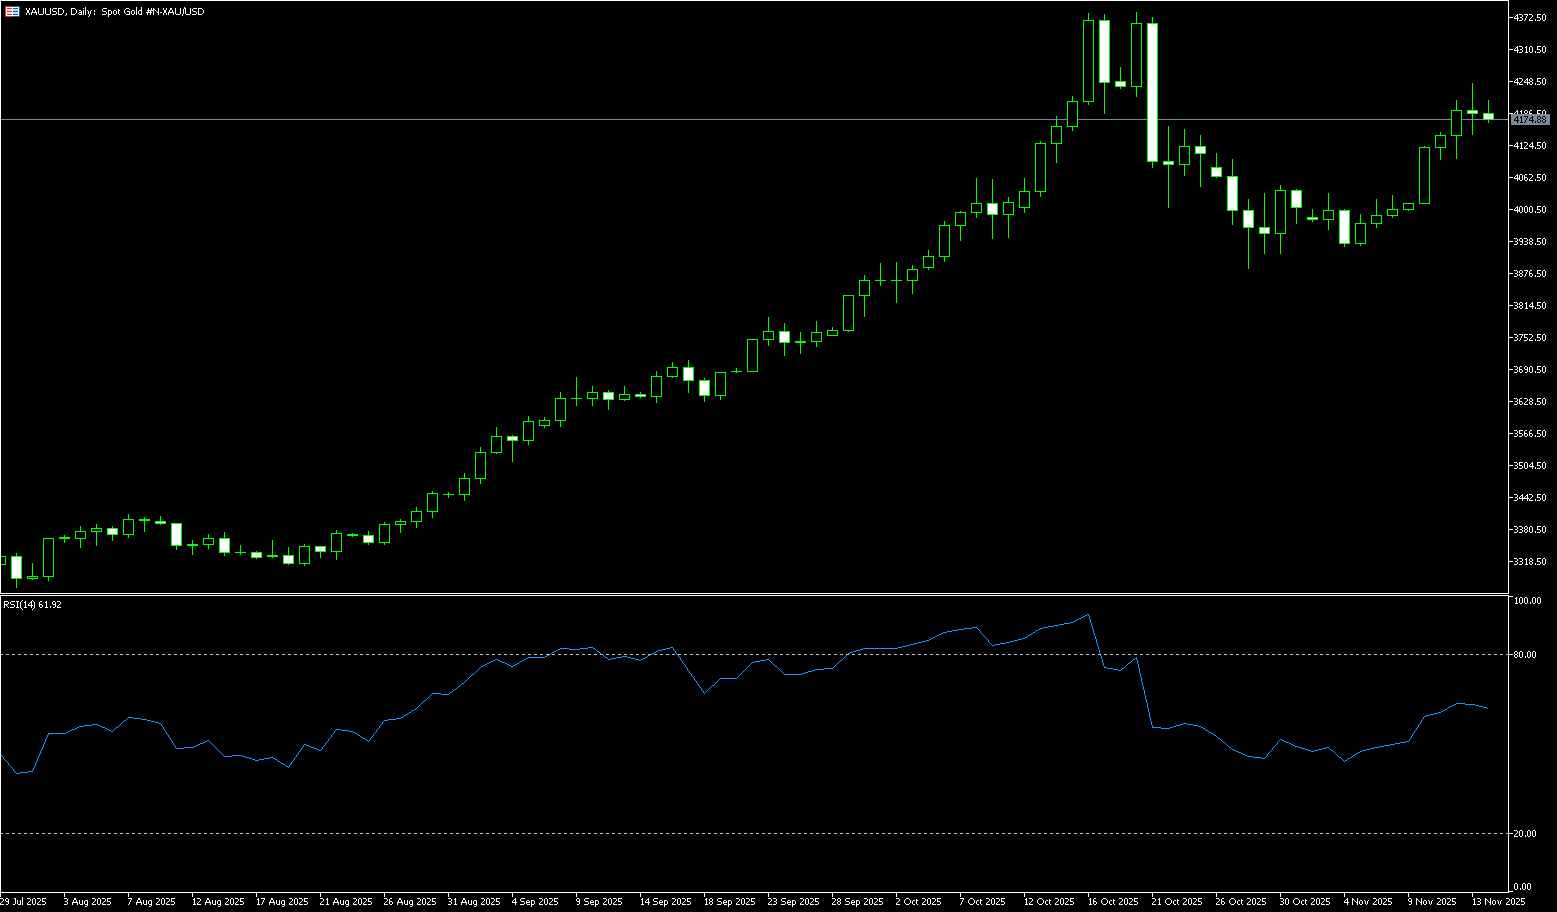
On Thursday, spot gold traded around $4,075 per ounce. Gold prices benefited from the probability of a December rate cut dropping to 30%, while policymakers remained divided on the issue of a rate cut last month. On Wednesday, gold prices surged and then retreated. In the early morning, prices jumped as much as 1.6%, reaching a high of $4,132.80 per ounce, but as the dollar index continued its upward trend, the market was dampened, and gold prices quickly fell back. The Fed meeting minutes were hawkish, and the dollar index hit a near two-week high, further suppressing gold bullish sentiment. Gold ultimately closed at only $4,077.79 per ounce. A strong dollar and rising US Treasury yields directly pressured gold. As a zero-interest asset, gold is most vulnerable to rising real interest rates. The Federal Reserve has now made it clear that it would rather "inadvertently damage employment than allow inflation to run rampant," meaning real interest rates are likely to continue rising, and gold's low-interest-rate moat is being rapidly dismantled. This Fed minutes have completely pulled the market back from the "interest rate cut frenzy" to reality: inflation remains the number one enemy, and interest rate cuts cannot be implemented at will. The foundation of gold's super bull market (low interest rates + strong safe-haven appeal) is being weakened, and short-term bulls need to be prepared for a "roller coaster" ride.
From a technical perspective on the daily chart, gold is currently "consolidating in the short term, but the medium-to-long-term bull market remains unchanged." The 4,103 (9-day simple moving average) to 4,132 (Wednesday's high) levels remain strong resistance levels. Wednesday's surge and subsequent pullback left a long upper shadow, indicating that bearish sentiment is clearly dominant. As long as the US dollar index holds above the psychological level of 100, it will be difficult for gold to truly break upwards in the short term. $4,132 may have become a temporary ceiling. A break below the $4,007 (45-day simple moving average) – $4,000 (psychological level) area could trigger a deeper pullback towards $3,941 (55-day simple moving average) and $3,900 (psychological level). If momentum remains above the $4,132-$4,150 area, upward pressure may resume. Key upside targets are $4,200 and $4,250.
Consider going long on spot gold around $4,075 today; Stop loss: $4,070; Targets: $4,120; $4,130
AUD/USD
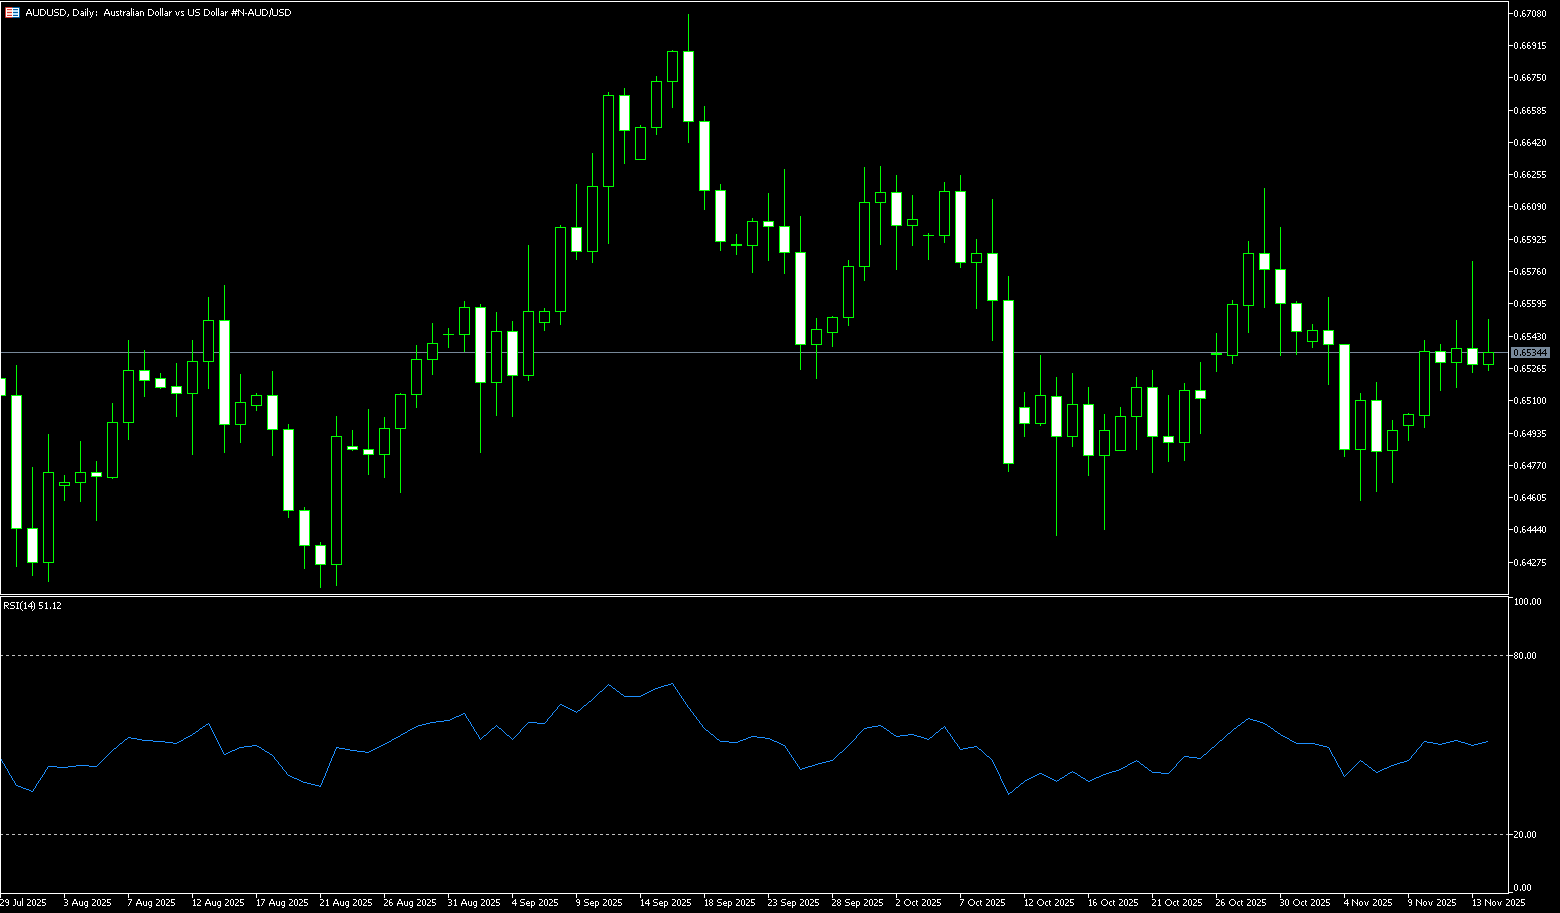
The Australian dollar is trading around US$0.6450, near its lowest level in six weeks, as investors assess the ongoing debate at the Reserve Bank regarding the actual extent of tightening. Deputy Governor Sarah Hunt's recent comments highlighted that the central bank is reassessing three key changes in the economy, including how businesses are pricing post-pandemic, the tightness of the labor market, and whether the strong response in the housing market has altered policy transmission. Markets remain cautious, weighing on the Australian dollar, given policymakers' uncertainty about whether the 3.6% cash rate is sufficient to limit inflation back to target. Investors are now awaiting Purchasing Managers' Index (PMI) data later today for further clues about the economic situation. Elsewhere, the US dollar strengthened broadly after the October Fed meeting minutes showed several members opposed another rate cut this year, adding further pressure.
The short-term outlook for AUD/USD remains unclear and continues to point to a continuation of sideways trading. Furthermore, momentum indicators reinforce the possibility of further near-term losses: the 14-day Relative Strength Index (RSI) has slipped to the 44 area, while the Average Directional Index (ADX) is around 12, indicating the trend remains fragile. A break below the key 200-day simple moving average at 0.6460 could pave the way for further losses, initially targeting the October low of 0.6440 (October 14), then the August low of 0.6414 (August 21), and the psychological level of 0.6400. On the other hand, immediate resistance lies at 0.6500 (a psychological level), followed by the 20-day simple moving average at 0.6523, a break of which would target the November high of 0.6580 (November 13).
Consider going long on the Australian dollar today near 0.6433; Stop loss: 0.6420; Target: 0.6490; 0.6500
GBP/USD
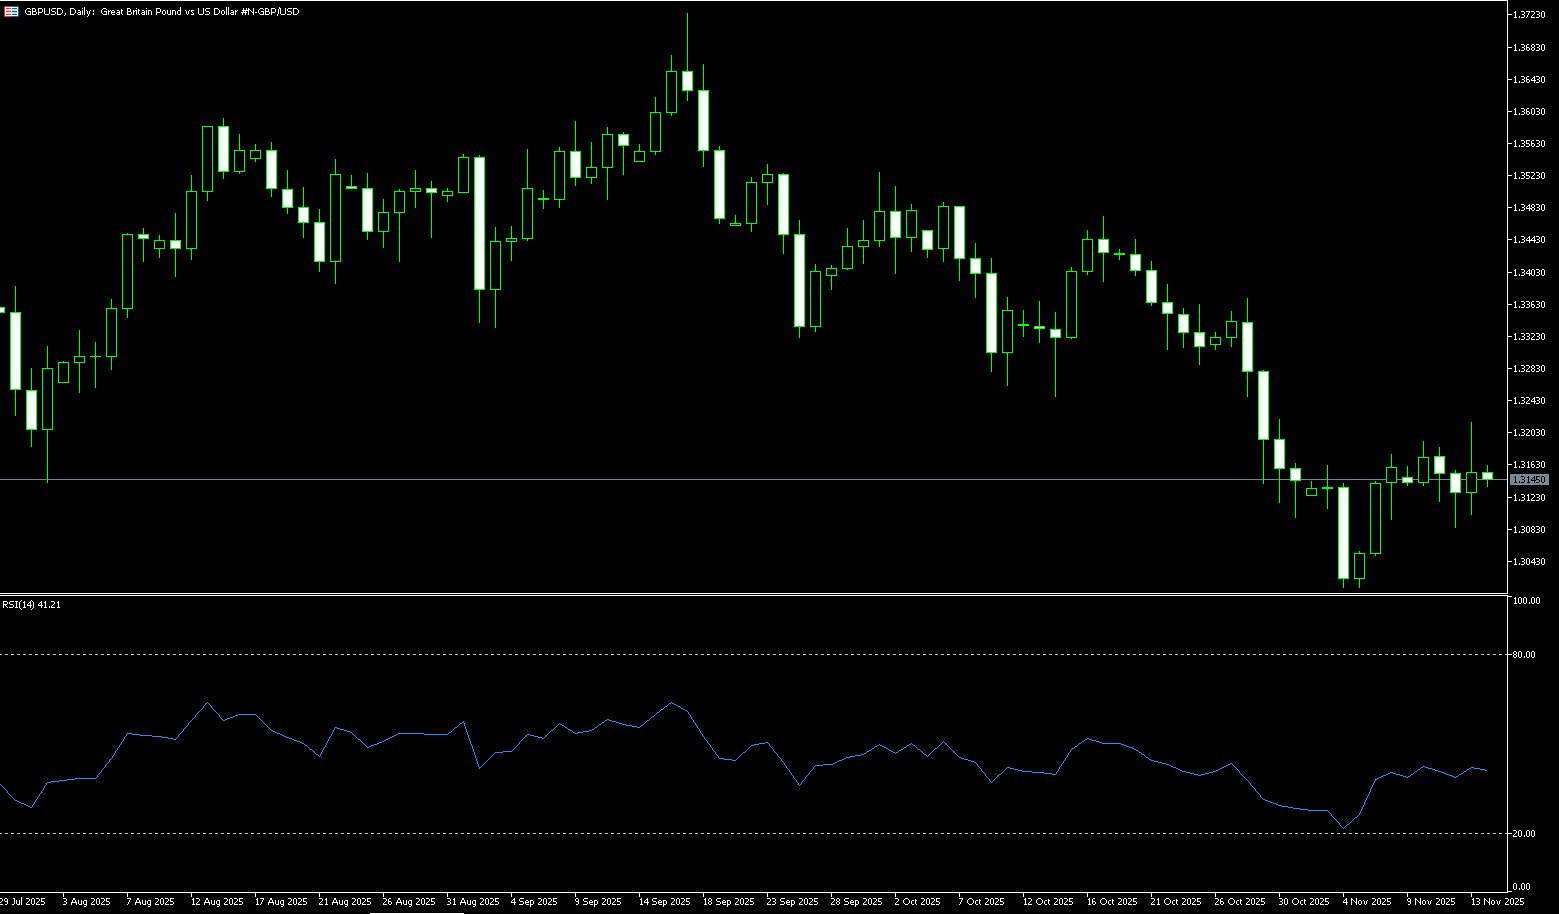
The pound fell to $1.3038 in the latter part of the week, near a seven-month low reached earlier this month, after new data showed a significant slowdown in UK inflation. Slower inflation has provided some relief to the Bank of England and the UK government, while also giving Chancellor Rachel Reeves a boost as she prepares to release the key budget next week. Headline inflation fell to 3.6% in October, primarily driven by lower household electricity and heating costs due to adjustments in the Ofgem energy price cap and cheaper hotel prices. Services inflation fell more than expected to 4.5%, while core inflation dropped to 3.4%. Reeves pledged to lower the cost of living in her upcoming Tax and Expenditure Report on November 26, aiming to reduce inflation and pave the way for a possible Bank of England rate cut. Meanwhile, the dollar remained supported as investors awaited Thursday's key September jobs report, keeping broader currency markets cautious.
The recent break below the technically important 200-day simple moving average is seen as a key trigger for bears in GBP/USD. Furthermore, the daily 14-day Relative Strength Index (RSI) has moved out of oversold territory, which, along with negative oscillators on the daily chart, suggests that the rally from near the psychological level of 1.3000 may quickly fade. Therefore, it would be prudent to wait for further buying opportunities near the weekly high, around 1.3193, before taking further profits. The GBP/USD pair may move towards a challenge of the 200-day simple moving average, currently in the 1.3275-1.3280 area, which should be a key pivot point for short-term traders. On the other hand, the November 4th low and the 1.3000 psychological level may act as immediate support; a break below this area should pave the way for deeper losses towards the 1.2966 April 11th low support, potentially leading to levels below 1.2900.
Consider going long on GBP/USD around 1.3058 today; Stop loss: 1.3045; Target: 1.3100; 1.3110
USD/JPY
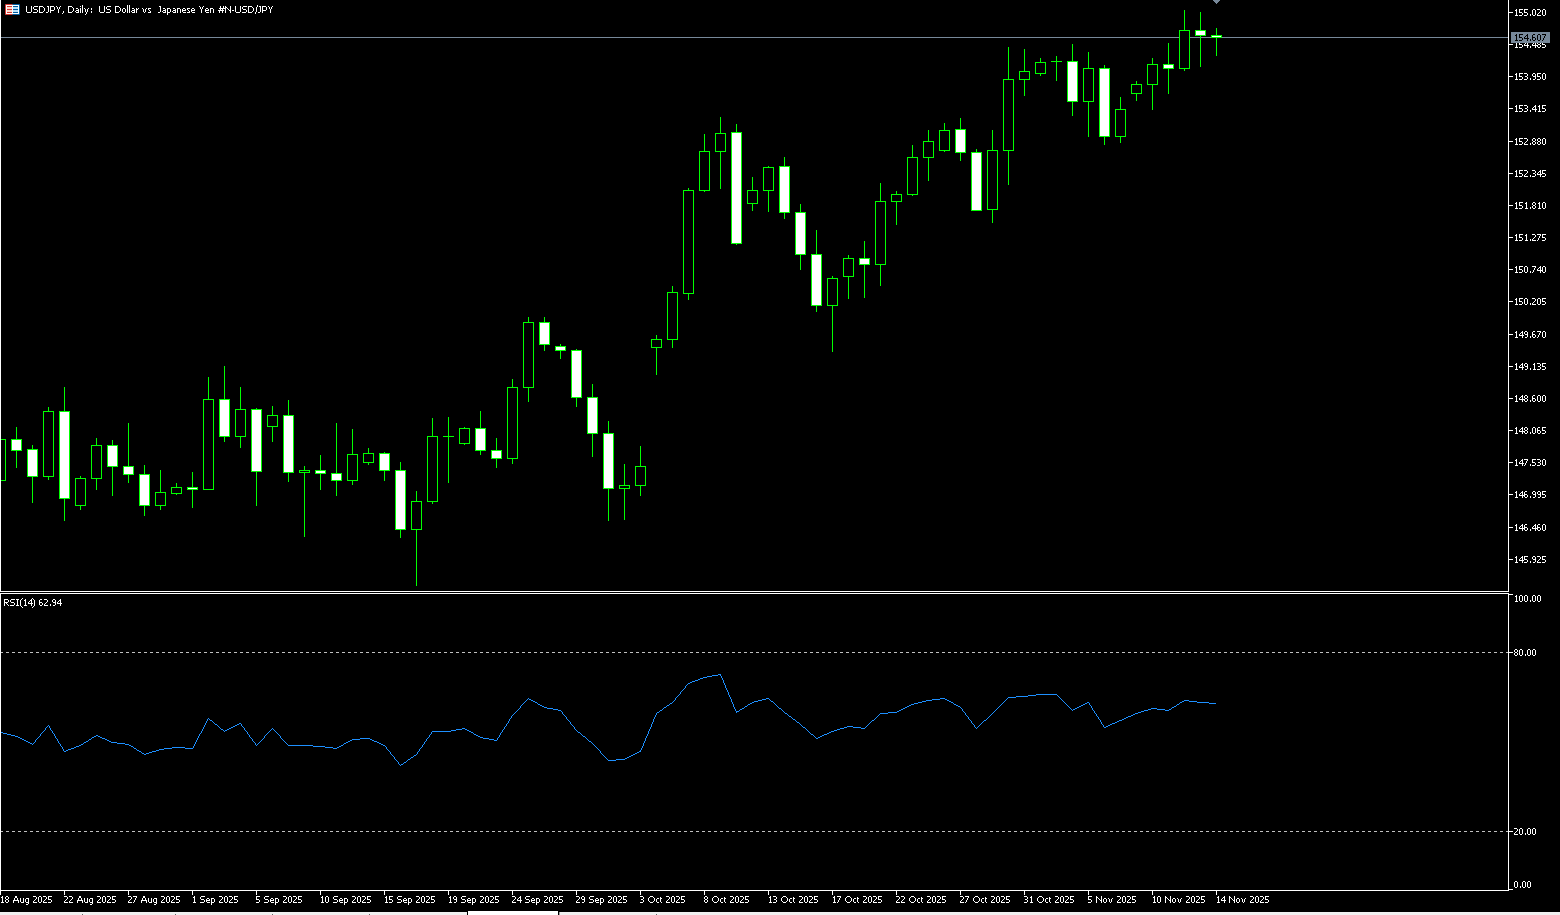
The yen weakened to 157.50 yen per dollar on Thursday, hitting a ten-month low, as investors prepared for the announcement of Mayor Sanae Takashi's stimulus plan, expected to exceed 20 trillion yen. This massive spending plan sparked concerns about Japan's fiscal health, fueling a "sell Japan" trade and pushing the yen and bond prices lower, although strong earnings from Nvidia eased investor concerns about an artificial intelligence bubble, with stocks remaining resilient. The yen depreciated sharply on Wednesday after Finance Minister Satsuki Katayama stated that she did not specifically discuss foreign exchange issues during her meeting with Bank of Japan Governor Kazuo Ueda. Traders now speculate that authorities may intervene again if the yen depreciates to 160 yen per dollar, consistent with past intervention levels. A stronger dollar has also put additional pressure on the yen, as several Federal Reserve officials indicated that a rate cut in December is unlikely.
The 14-day Relative Strength Index (RSI) on the daily chart shows overbought conditions at 75.20, hindering traders from making new bullish bets on USD/JPY. Therefore, it would be wise to wait for some short-term consolidation or a moderate pullback before taking further steps to push for appreciation. However, any corrective decline is likely to find fairly good support in the 156.65-156.60 area; below this level, the pair could fall further to the 156.00 level. The latter should be considered a key point, as continued weakness could prompt some technical selling, paving the way for deeper losses. On the other hand, the 157.40-157.45 area could be a direct hurdle; a break above this level could accelerate the USD/JPY pair toward the 158.00 psychological level. The next relevant resistance level is near mid-158.00, after which the spot price will test the January swing high around 159.00.
Today, consider shorting the US dollar near 157.75; Stop loss: 157.95; Target: 156.40; 156.30
EUR/USD
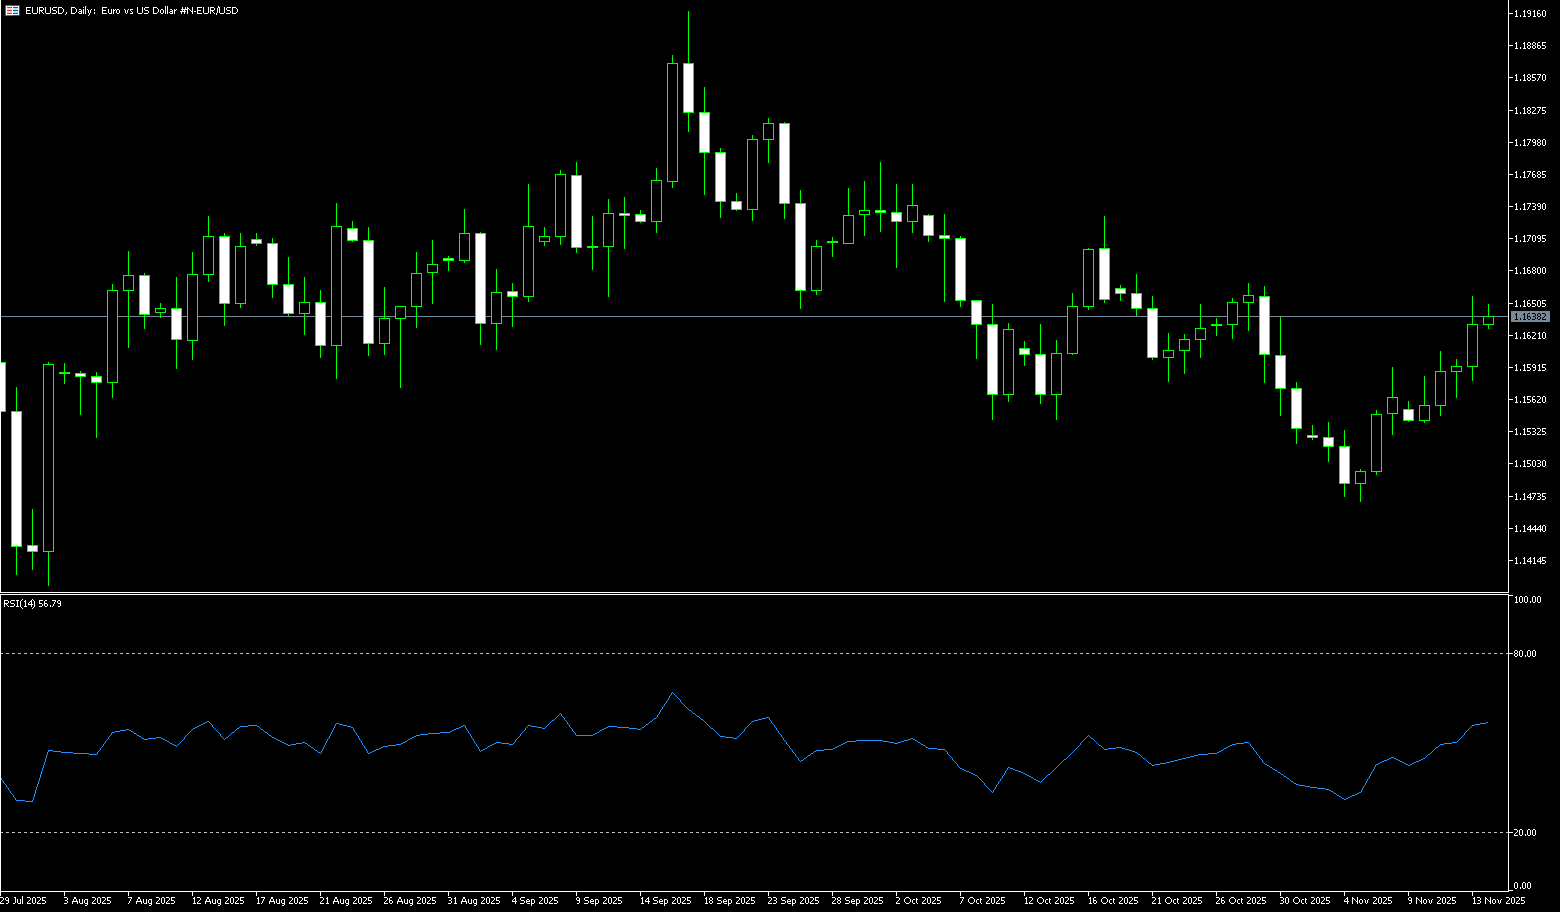
The euro fell slightly above $1.1500, its lowest level in about two weeks, dragged down by a stronger dollar as traders lowered their expectations for a 25 basis point rate cut by the Federal Reserve in December. This shift in sentiment occurred after the cancellation of the October jobs report and the FOMC meeting minutes revealing disagreement among policymakers on whether further policy easing was needed. In contrast, the European Central Bank is expected to keep interest rates unchanged until the end of 2026, with inflation near its 2% target, stable economic growth, and record low unemployment. The central bank kept rates unchanged at its third meeting in October. Meanwhile, the European Commission raised its 2025 eurozone growth forecast to 1.3%, up from 0.9% in its spring forecast, due to a surge in exports to the US and businesses increasing inventories ahead of Trump-era tariffs. Growth is projected to slow to 1.2% in 2026, below 1.4%, before rising to 1.4% in 2027.
Looking at recent price action, EUR/USD has fallen to a two-week low of 1.1511 and is currently hovering around the current level. Buyers failed to retake 1.1600 as the Federal Reserve hinted at a possible decision to keep interest rates unchanged at its December meeting. A break below 1.1500 could open a path to test the November 5 low of 1.1468, followed by 1.1450. A break above this level would target the psychological level of 1.1400, as well as the 200-day simple moving average at 1.1395. For a bullish continuation, EUR/USD needs to rise above the 20-day simple moving average at 1.1571, followed by the psychological level of 1.1600. This would clear the path to challenge the key resistance level of 1.1653 (simple moving average).
Consider going long on the Euro today around 1.1513; Stop loss: 1.1500; Target: 1.1560; 1.1570
Disclaimer: The information contained herein (1) is proprietary to BCR and/or its content providers; (2) may not be copied or distributed; (3) is not warranted to be accurate, complete or timely; and, (4) does not constitute advice or a recommendation by BCR or its content providers in respect of the investment in financial instruments. Neither BCR or its content providers are responsible for any damages or losses arising from any use of this information. Past performance is no guarantee of future results.
More Coverage


Risk Disclosure:Derivatives are traded over-the-counter on margin, which means they carry a high level of risk and there is a possibility you could lose all of your investment. These products are not suitable for all investors. Please ensure you fully understand the risks and carefully consider your financial situation and trading experience before trading. Seek independent financial advice if necessary before opening an account with BCR.
BCR Co Pty Ltd (Company No. 1975046) is a company incorporated under the laws of the British Virgin Islands, with its registered office at Trident Chambers, Wickham’s Cay 1, Road Town, Tortola, British Virgin Islands, and is licensed and regulated by the British Virgin Islands Financial Services Commission under License No. SIBA/L/19/1122.
Open Bridge Limited (Company No. 16701394) is a company incorporated under the Companies Act 2006 and registered in England and Wales, with its registered address at Kemp House, 160 City Road, London, City Road, London, England, EC1V 2NX. This entity acts solely as a payment processor and does not provide any trading or investment services.

 English
 简体中文
简体中文
 繁體中文
繁體中文
 Bahasa
Melayu
Bahasa
Melayu
 Tiếng
Việt
Tiếng
Việt
 ไทย
ไทย
 日本語
日本語
 한국어
한국어
 ភាសាខ្មែរ
 español