


0
US Dollar Index
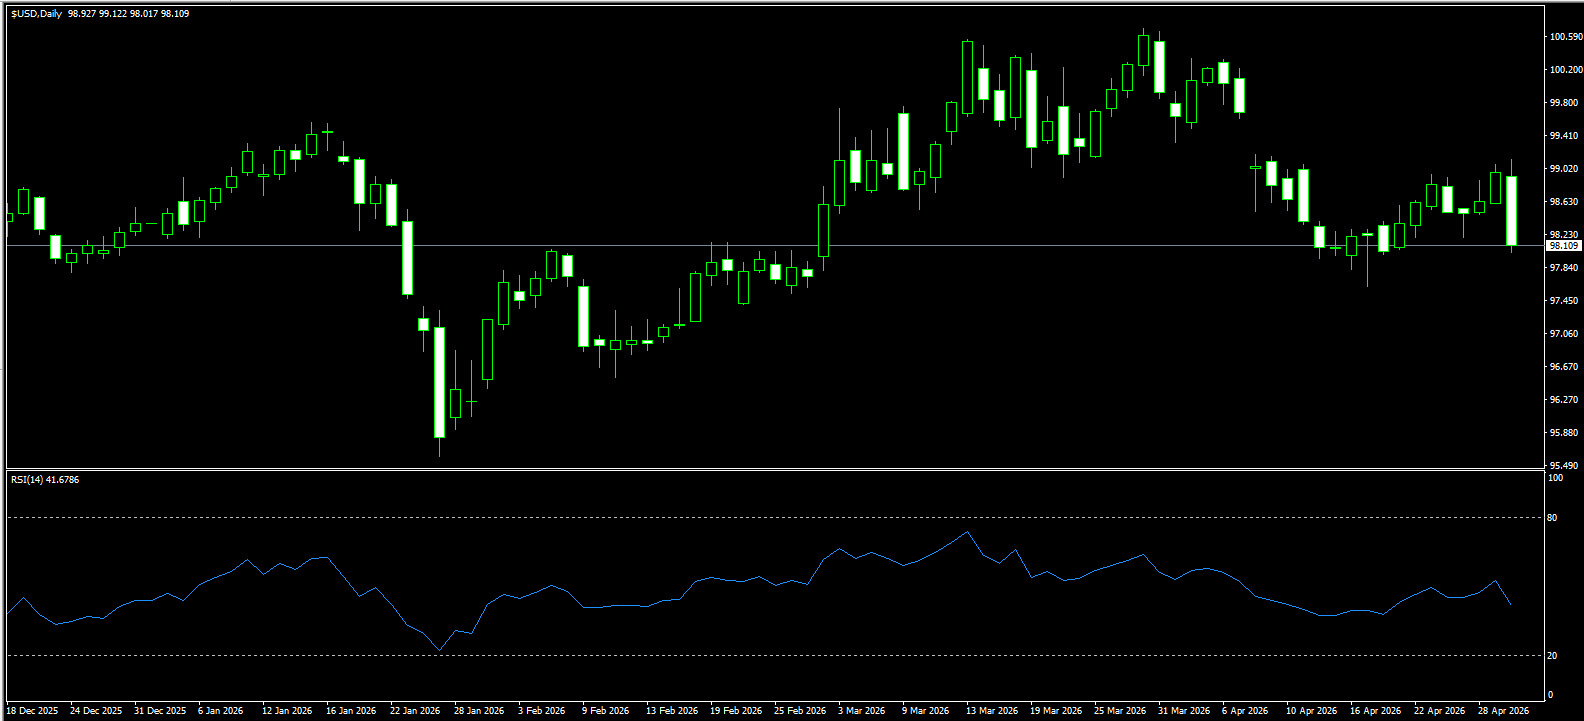
The US Dollar Index slipped to near 98 on Thursday, pressured by a pullback in oil prices from four-year highs and a sharp strengthening of the Japanese yen, even as fresh data pointed to the resilience of the US economy. Data from the Bureau of Economic Analysis showed first-quarter GDP grew at an annualized pace of 2%, rebounding from the slowdown caused by the government shutdown at the end of 2025. Consumer spending rose 1.6%, supported by strong demand for services, while separate data showed jobless claims fell to multi-decade lows.
Shortly after the data release, the Federal Reserve held rates unchanged, though divisions among policymakers widened amid uncertainty surrounding the Middle East conflict. Meanwhile, the yen surged 3%, with traders speculating that Japanese authorities may have intervened following strong warnings against excessive currency depreciation.
Recently, the US Dollar Index has shown a strengthening trend driven by two main factors: rising global oil prices providing underlying support, and market skepticism toward the hawkish rhetoric of the Fed’s counterparts such as the ECB. From a technical perspective, the index is currently consolidating at elevated levels following a rebound. On the 240-minute chart, short-term moving averages have crossed above medium-term averages, forming a bullish golden cross that signals near-term strength. Although the MACD is flattening above the zero line—indicating weakening bullish momentum—the broader structure still points to a gradual upward bias.
On the upside, attention is on stability between the 200-day moving average at 98.56 and the 99.00 level. On the downside, key support lies at 98.00 (psychological level) and 97.63 (April 17 low).
WTI Crude Oil (Spot)
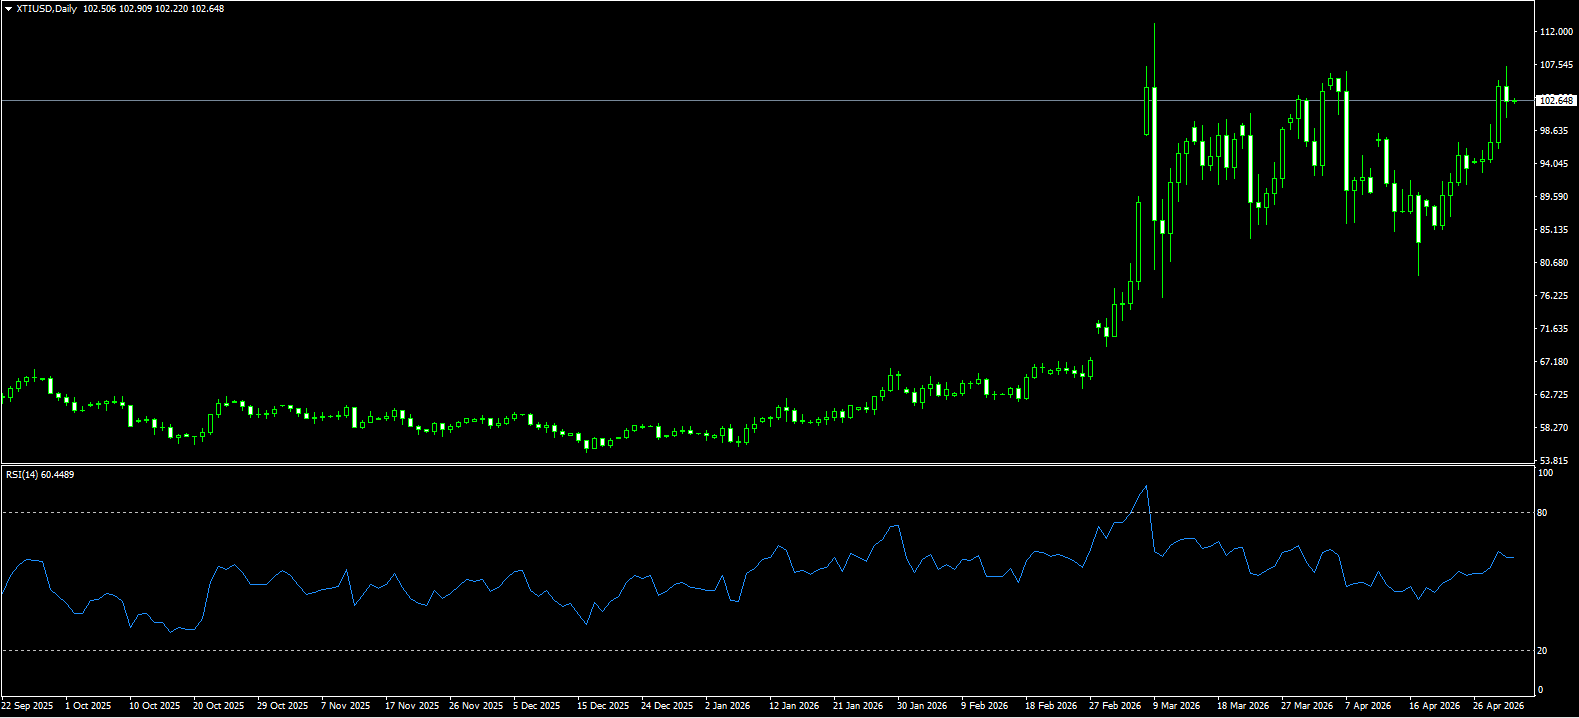
Escalating tensions in the Middle East, including a US naval blockade on Iran and the UAE’s announcement of its exit from OPEC, have raised concerns over the stability of global oil supply. These factors have pushed WTI prices toward $105.48 per barrel. Risks to energy transportation and fractures within the producer alliance have reinforced bullish expectations, suggesting oil may remain elevated and volatile in the near term.
Oil prices surged nearly 9% on Wednesday, while Brent crude futures extended gains for an eighth consecutive session, briefly hitting $120—the highest level since 2022. The rally was driven by stalled US-Iran negotiations, heightened risks of prolonged supply disruptions in the Middle East, and a larger-than-expected draw in US crude inventories.
Market sentiment reflects declining risk appetite, with safe-haven flows shifting into energy markets. The rapid rise in oil prices highlights not only short-term supply concerns but also a broader repricing of the global energy landscape. With demand yet to show meaningful improvement, supply shocks remain the dominant driver, increasing oil’s sensitivity to geopolitical developments.
From a technical standpoint, WTI remains in a clear uptrend on the daily chart, having broken above the key psychological level of $100 and holding firmly above $105. Momentum indicators show the RSI in overbought territory, though no clear topping signal has emerged. Immediate resistance is seen at $110 and $113.28 (near the March 9 high), while support lies at $100 and $96.74 (8-day moving average).
Spot Gold
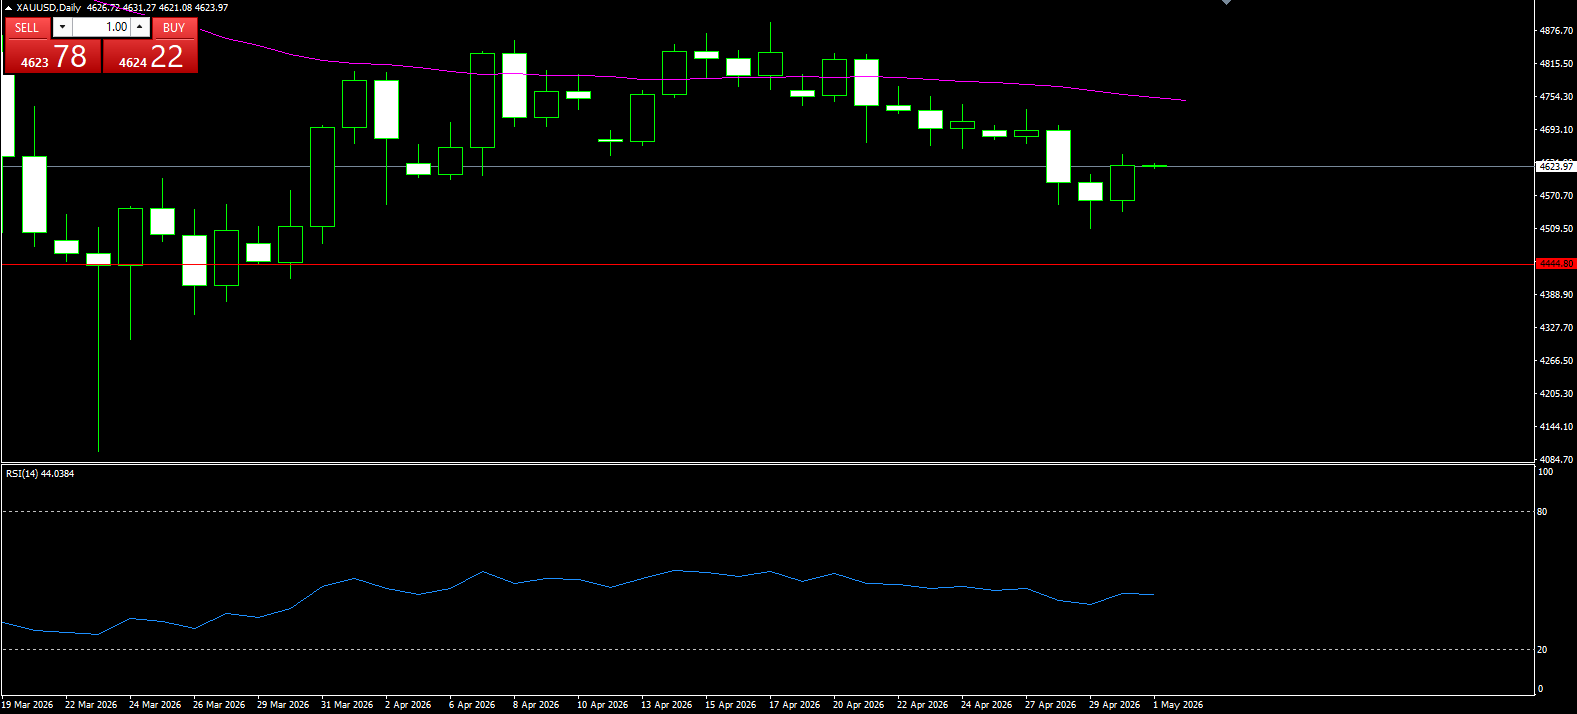
Gold rose to $4,620 per ounce on Thursday, rebounding from a one-month low as investors monitored geopolitical developments. Reports indicated that the US military is preparing to brief President Donald Trump on potential actions against Iran. Trump also stated that the US would maintain its naval blockade until a nuclear deal is reached, while Tehran accused Washington of attempting to force concessions through economic pressure and internal destabilization.
Ongoing conflict in the Middle East and near-closure of the Strait of Hormuz continue to disrupt global markets. Traders have scaled back expectations for rate cuts this year and are even beginning to price in potential rate hikes as far out as 2027. Meanwhile, the Federal Reserve held policy steady as expected, though dissent among four officials underscored growing divisions amid geopolitical uncertainty.
Technically, after failing near the 200-hour SMA (4,692), gold broke below the key support zone between $4,623 (20-period SMA) and $4,600 (psychological level), triggering bearish momentum. The RSI around 38 reflects weak buying pressure, suggesting any rebound attempts remain fragile below resistance levels. However, the MACD histogram has turned positive, hinting at a mild recovery attempt.
Initial resistance is seen around $4,650, followed by the 200-period SMA near $4,692. On the downside, a break below the recent low near $4,510 could expose the $4,500 psychological level.
USD/JPY
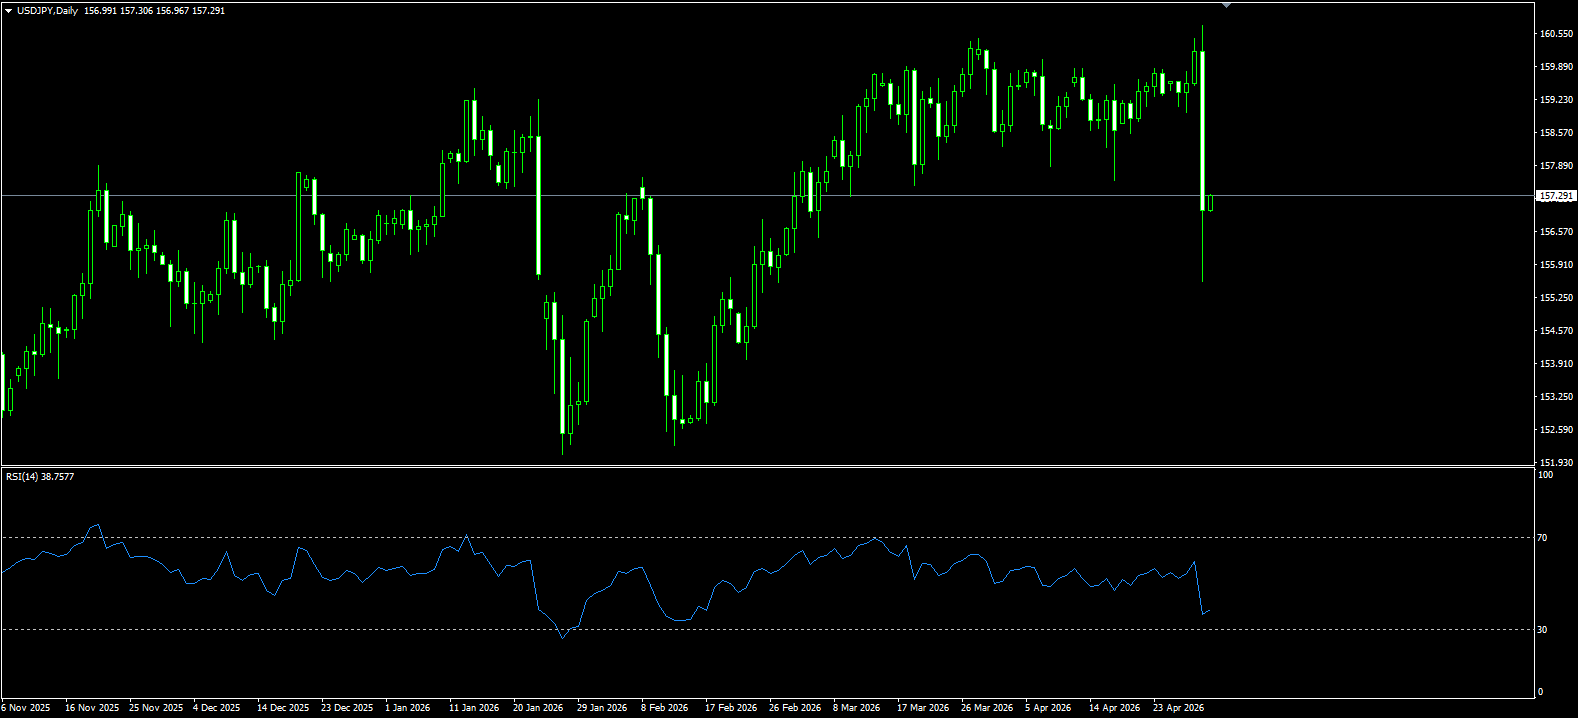
The yen strengthened by more than 2% against the dollar, pushing USD/JPY below 157 and as low as 155.56. Traders suspect intervention by the Bank of Japan after officials issued what was described as a “final warning” against excessive currency weakness. Finance Minister Katsunobu Kato stated that decisive action could be imminent.
Earlier, the pair had fallen below 160—the weakest level since July 2024, when authorities last intervened. Last week, the Bank of Japan kept its policy rate unchanged at 0.75%, balancing inflation risks against concerns over economic slowdown tied to Middle East tensions. Three of the nine board members voted in favor of a rate hike, while Governor Kazuo Ueda reiterated a commitment to gradual policy tightening.
Technically, USD/JPY has entered a corrective phase after Thursday’s sharp drop triggered by intervention fears. The pair is trading around 156.61, having hit a low of 155.56—the lowest since February 27. On the daily chart, the pair has broken below both the 50-day and 100-day SMAs, reinforcing a bearish bias. RSI has fallen into the mid-30s, indicating rising selling pressure, while MACD has crossed below the signal line into negative territory.
Initial resistance is at 157.30 (100-day SMA), with stronger resistance at 158.56 (50-day SMA). On the downside, support lies at 155.56, followed by the 200-day SMA near 154.07.
EUR/USD
The euro rose to $1.17, rebounding from a three-month low and on track for a monthly gain of over 1% against the dollar. The European Central Bank held rates steady as expected but kept all options open for its June meeting and beyond. Policymakers noted that while recent data align with inflation forecasts, upside risks to inflation and downside risks to growth have increased.
At the press conference, ECB President Christine Lagarde said the decision to hold rates was unanimous, although rate hikes were discussed. She added that policymakers are moving “away” from the baseline scenario. Money markets are currently pricing in around 75 basis points of rate hikes by year-end.
Data showed eurozone inflation rose to 3% in April—the highest since September 2023—well above the ECB’s 2% target. Meanwhile, the region’s economy unexpectedly slowed in Q1, expanding just 0.1%, partly due to energy supply disruptions linked to Middle East tensions.
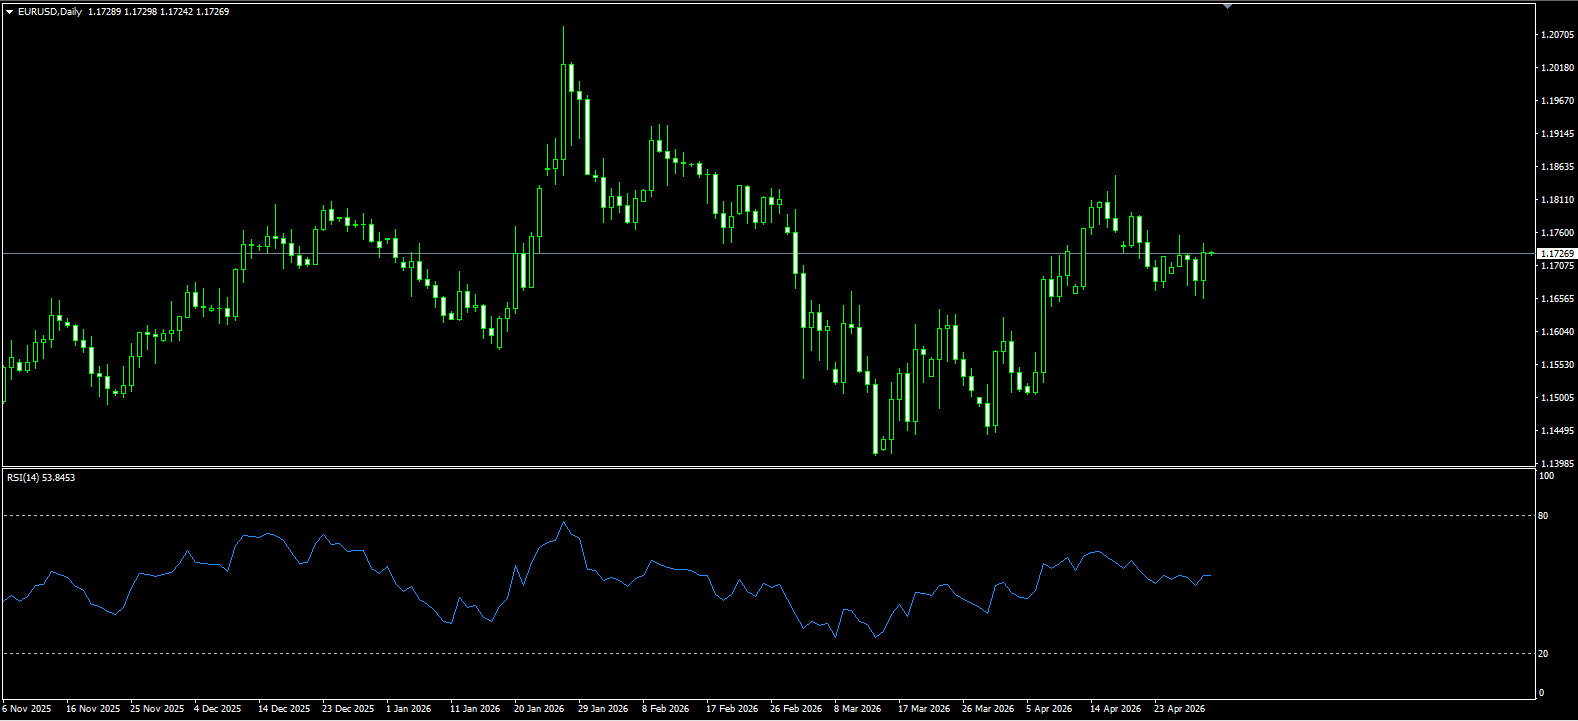
Technically, EUR/USD is holding above 1.1700, consolidating above the 200-day SMA (1.1670) and the 50-day SMA (1.1647). The 14-day RSI has retreated into the 50–55 range after failing to sustain levels above 66, indicating fading momentum but maintaining a bullish bias.
On the upside, resistance is seen at 1.1745 (50% Fibonacci retracement), followed by 1.1830 (late-February high). On the downside, initial support lies at the 200-day SMA (1.1670), with a break exposing the 1.1600 psychological level.
Lebih Liputan


Pendedahan Risiko:Instrumen derivatif diniagakan di luar bursa dengan margin, yang bermakna ia membawa tahap risiko yang tinggi dan terdapat kemungkinan anda boleh kehilangan seluruh pelaburan anda. Produk-produk ini tidak sesuai untuk semua pelabur. Pastikan anda memahami sepenuhnya risiko dan pertimbangkan dengan teliti keadaan kewangan dan pengalaman dagangan anda sebelum berdagang. Cari nasihat kewangan bebas jika perlu sebelum membuka akaun dengan BCR.
BCR Co Pty Ltd (No. Syarikat 1975046) ialah syarikat yang diperbadankan di bawah undang-undang British Virgin Islands, dengan pejabat berdaftar di Trident Chambers, Wickham’s Cay 1, Road Town, Tortola, British Virgin Islands, dan dilesenkan serta dikawal selia oleh Suruhanjaya Perkhidmatan Kewangan British Virgin Islands di bawah Lesen No. SIBA/L/19/1122.
Open Bridge Limited (No. Syarikat 16701394) ialah syarikat yang diperbadankan di bawah Akta Syarikat 2006 dan berdaftar di England dan Wales, dengan alamat berdaftar di Kemp House, 160 City Road, London, City Road, London, England, EC1V 2NX. Entiti ini bertindak semata-mata sebagai pemproses pembayaran dan tidak menyediakan sebarang perkhidmatan perdagangan atau pelaburan.

 English
 简体中文
简体中文
 繁體中文
繁體中文
 Bahasa
Melayu
Bahasa
Melayu
 Tiếng
Việt
Tiếng
Việt
 ไทย
ไทย
 日本語
日本語
 한국어
한국어
 ភាសាខ្មែរ
 español


