


0
US Dollar Index
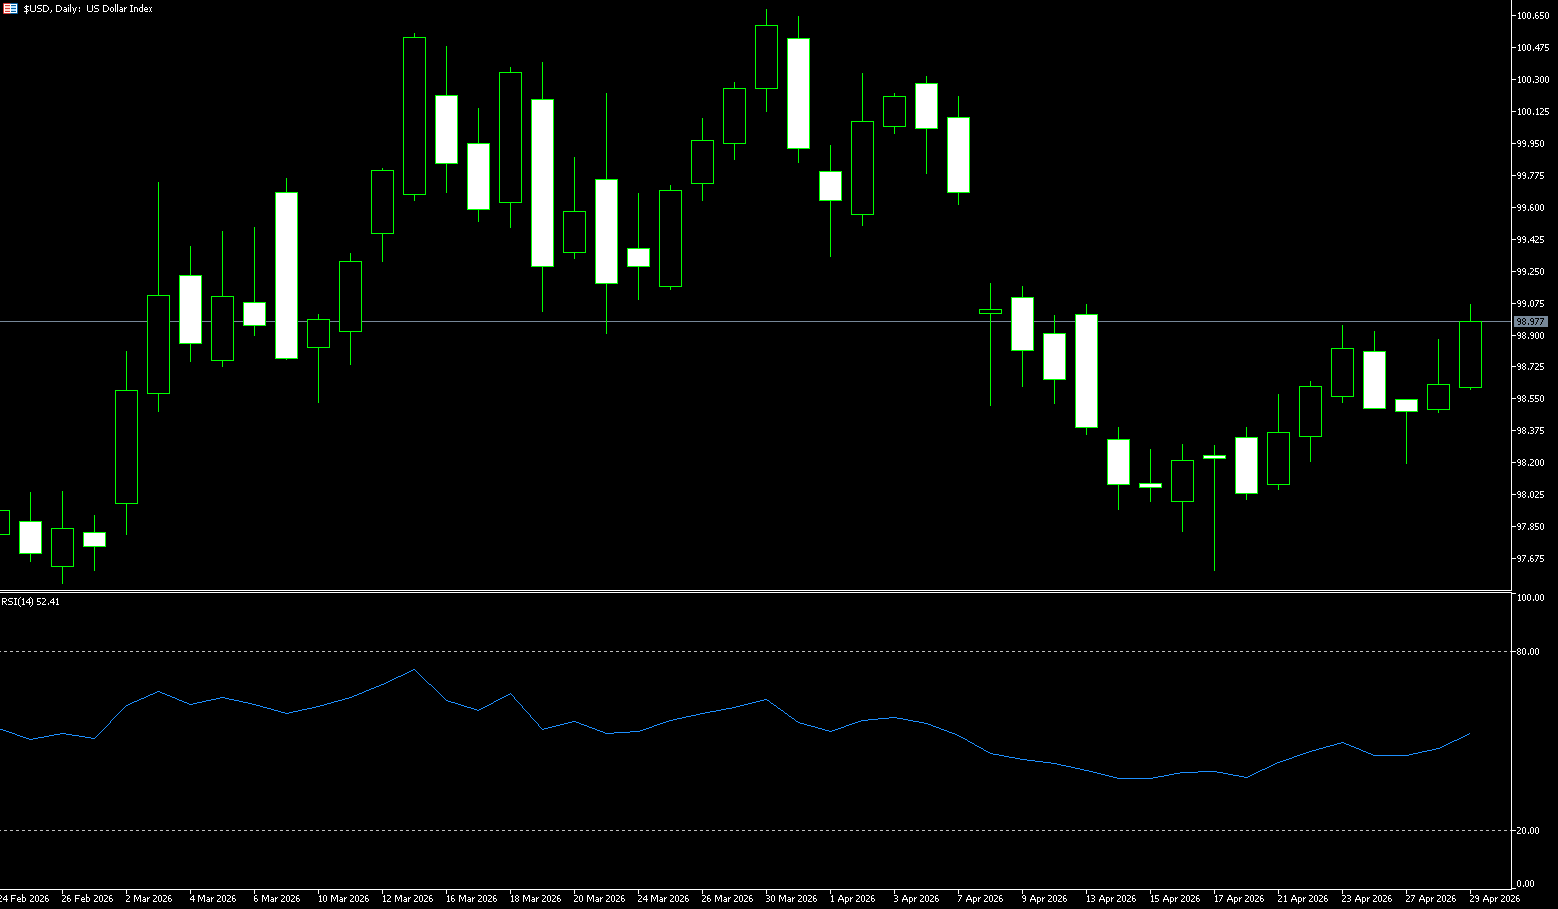
The US dollar index rose above 98.90 on Wednesday, its highest level in three weeks, as Federal Reserve policymakers adopted a hawkish tone in maintaining interest rates, and ongoing geopolitical tensions also supported the dollar's safety. The Fed kept policy rates unchanged as expected, but three Federal Open Market Committee (FOMC) members dissented from the central bank's dovish signals. This raised the bar for regional Fed presidents, known for their hawkish stance, to vote in favor of a final rate cut. Furthermore, Chairman Powell announced he would continue serving on the FOMC, removing dovish dissident Milan. President Trump stated that the agreement to lift the blockade of oil tankers in the Persian Gulf could only be lifted after a nuclear agreement on Iran was reached, adding further deadlock to the conflict. The Bank of Canada stated it did not see domestic inflation derailing in maintaining interest rates, despite hawkish comments from the Bank of Japan at its meeting. The European Central Bank and the Bank of England will decide on interest rates tomorrow.
The US dollar index has recently strengthened, driven by two factors: firstly, the continued rise in international oil prices has provided fundamental support for the dollar; secondly, the market is skeptical of the hawkish rhetoric from the Federal Reserve's competitors, such as the European Central Bank. The dollar index is currently holding above the 23.6% Fibonacci retracement level of its decline from the January 2025 high. However, the dollar index has been trading within a range for the past five weeks, lacking bullish momentum. Furthermore, the fact that it broke below and closed below the 200-week simple moving average for the first time since November 2021 in April 2025 is favorable for long-term bears. On the upside, watch for resistance at 99.61 (April 8 high) and 99.00 (psychological level); a decisive break below these levels could lead to a weakening trend and a pullback to 98.00 (psychological level) and 97.63 (April 17 low).
Today, consider shorting the US Dollar Index at 99.03, with a stop-loss at 99.15 and targets at 98.60 and 98.50.
WTI Crude Oil
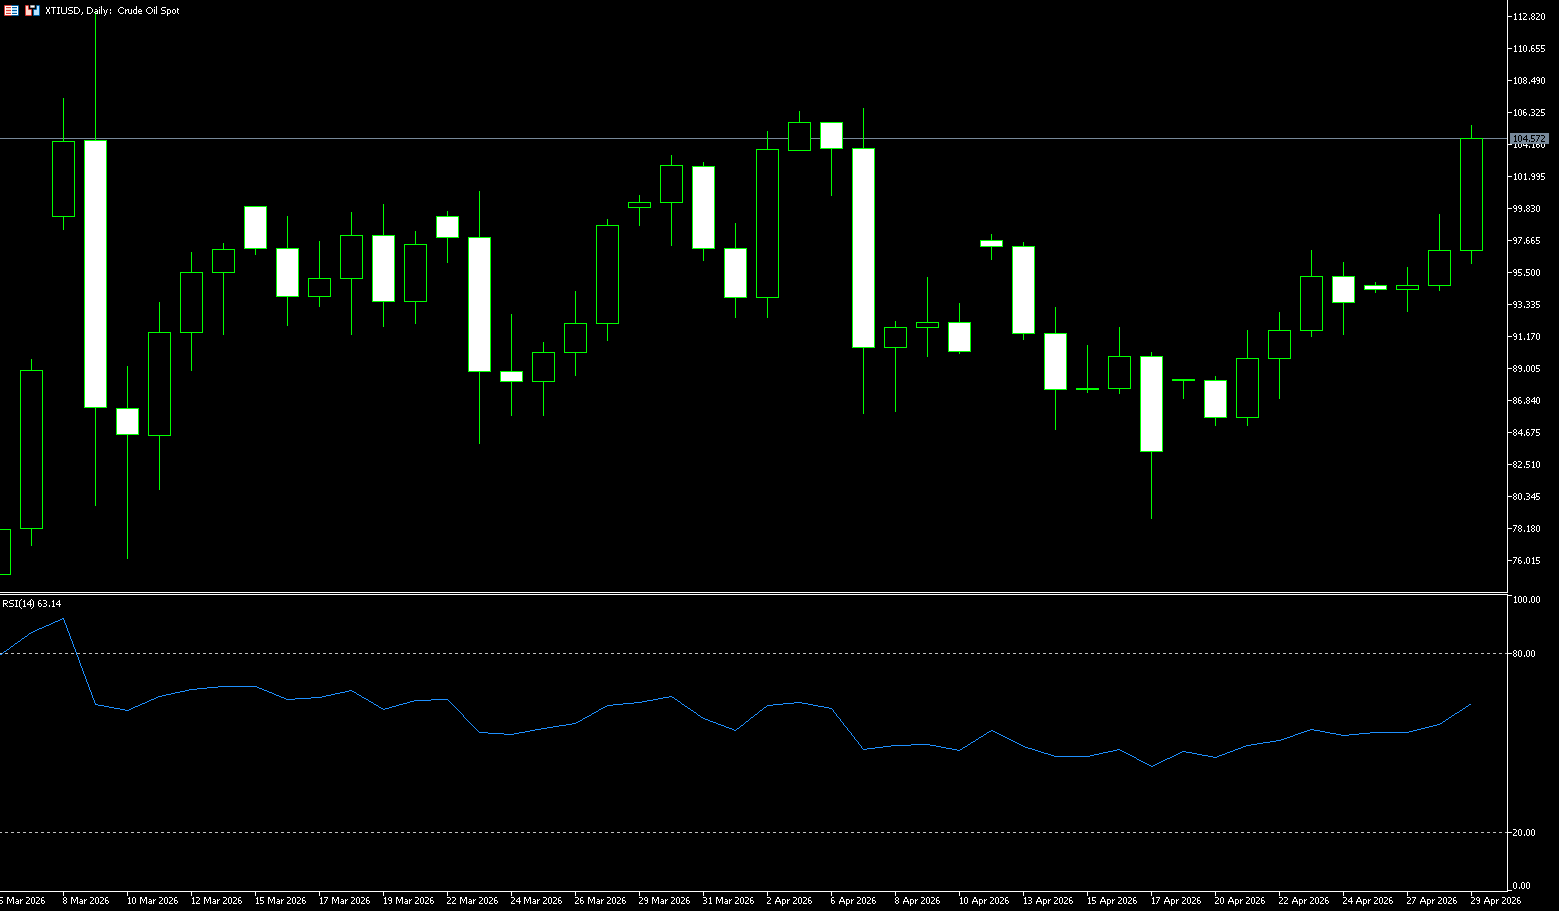
WTI crude oil rose above $105 a barrel on Wednesday, marking its third consecutive day of gains, supported by heightened global supply uncertainty as US-Iran peace talks stalled and the Strait of Hormuz remained effectively closed. President Trump stated that Iran had urged the US to lift its maritime blockade of the strait, while negotiations to end the conflict continued, and the resulting disruptions restricted energy flows from the Middle East. The closure of this vital passage halted approximately 20% of global oil shipments, triggering what the International Energy Agency called the largest supply shock in history. Meanwhile, the US increased pressure on Iran through additional measures, including potential sanctions on Chinese refineries linked to Tehran and sanctions on countries paying transit fees to secure passage through the Strait of Hormuz. Elsewhere, the ongoing conflict prompted the UAE to announce its withdrawal from OPEC next month to gain greater flexibility in adapting to market changes.
Technically, WTI is currently in a typical upward consolidation phase. Technical indicators such as the RSI remain in the mid-to-high range, indicating that the bulls have the upper hand in the battle. The MACD indicator is near the zero line, suggesting weakening trend momentum, and the market has entered a window of "awaiting a directional choice." The $100 psychological and technical resistance level constitutes a significant resistance level. Historically, this level has repeatedly been a key area where bulls have failed to break through, with a large number of institutional orders and algorithmic trading strategies concentrated around this area, reinforcing its resistance properties. If the price effectively breaks through $102, accompanied by increased trading volume and a simultaneous strengthening of momentum indicators, it is likely to confirm an upward breakout, opening up further upside potential, with a target range of $110 to $120. Conversely, if the price falls back, support levels to watch are the $102 level and the area around $100 (a psychological level). These levels have been repeatedly verified as effective support areas in historical cycles and have strong technical reference value.
Today, consider going long on crude oil at 105.15, with a stop-loss at 105.00 and targets at 108.00 and 110.00.
Spot Gold
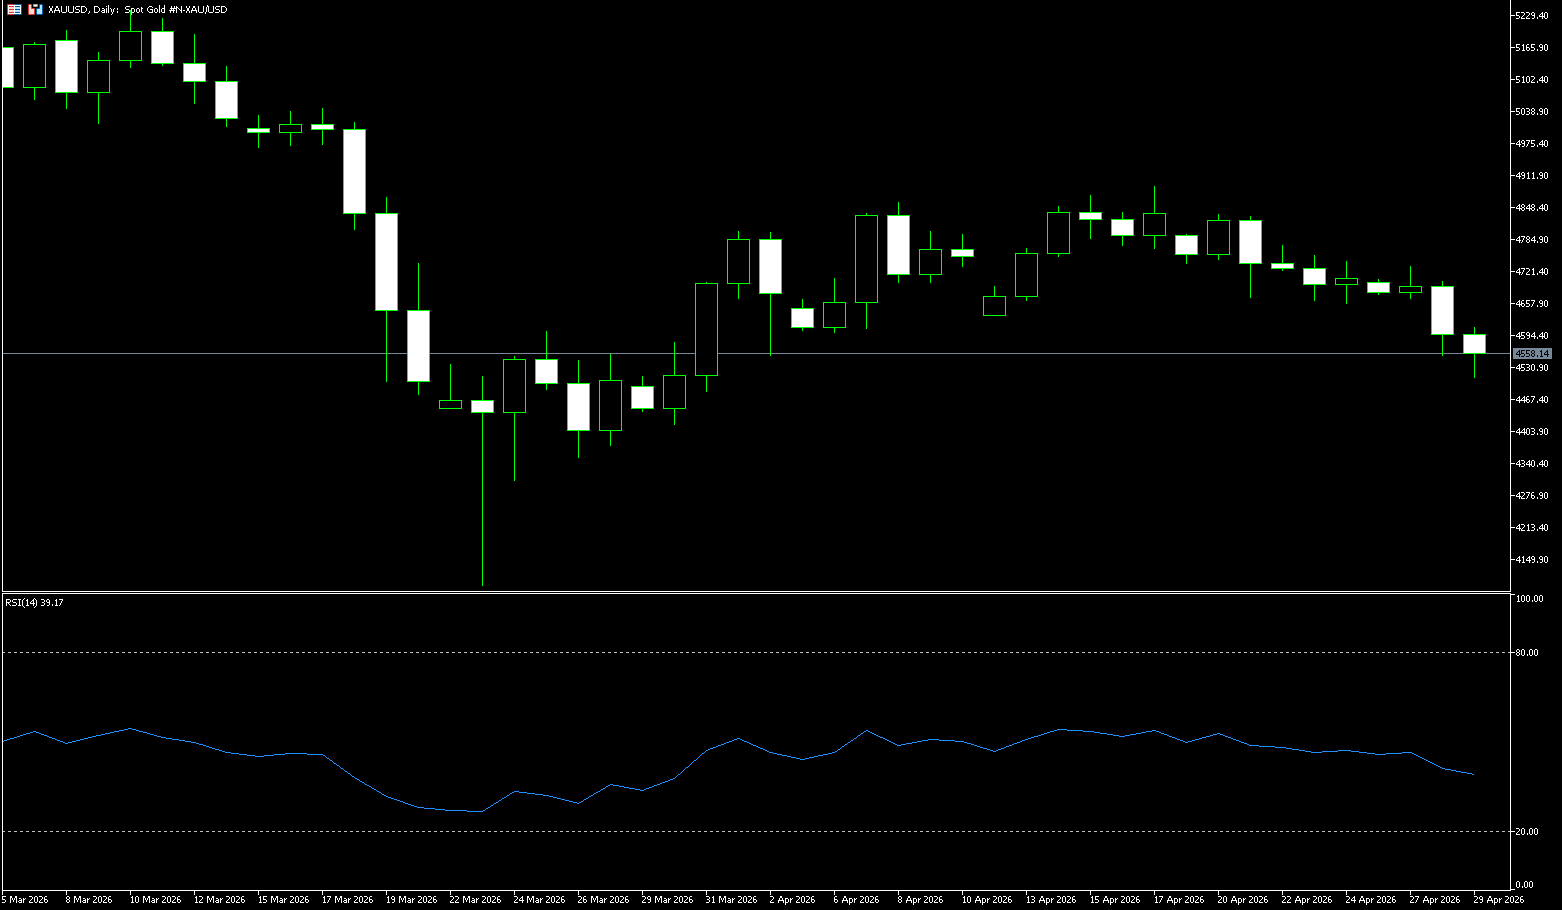
On Wednesday, gold prices hovered below $4,560 per ounce, after falling nearly 2% in the previous session to a one-month low, as stalled peace talks between the US and Iran and the continued closure of the Strait of Hormuz fueled concerns about rising inflation. President Trump stated that Iran had demanded the US lift its maritime blockade of the strait, and the ongoing negotiations to end the conflict have further tightened energy supplies from the Middle East. The closure of this crucial passage has cut off approximately 20% of global oil flows, resulting in what the International Energy Agency (IEA) described as the largest supply shock in history and exacerbating inflationary pressures. Investors are increasingly considering that central banks may maintain higher interest rates for longer, or even tighten them further, putting pressure on non-yielding gold. Earlier this week, the Bank of Japan kept its policy rate unchanged, while the central banks of the US, EU, UK, and Canada are scheduled to announce their decisions later this week.
On the daily chart, spot gold prices have consistently remained below the 100-day and 50-day simple moving averages, indicating a continued downtrend in the short term. The Relative Strength Index (RSI) is around 39, below the midline; while the negative MACD indicates increasing downward momentum, suggesting sellers remain in control. Technically, initial resistance is near the 100-day simple moving average, around $4,754. The next resistance level is at the 50-day simple moving average, around $4,849. For bulls to re-establish an uptrend, gold prices need to close above this area for several consecutive trading days. On the downside, current support is around $4,510 (Wednesday's low). If prices fall further, the psychological level around $4,500 will become the next support level.
Today, consider going long on spot gold at 4,540, with a stop loss at 4,535 and targets at 4,580 and 4,590.
AUD/USD
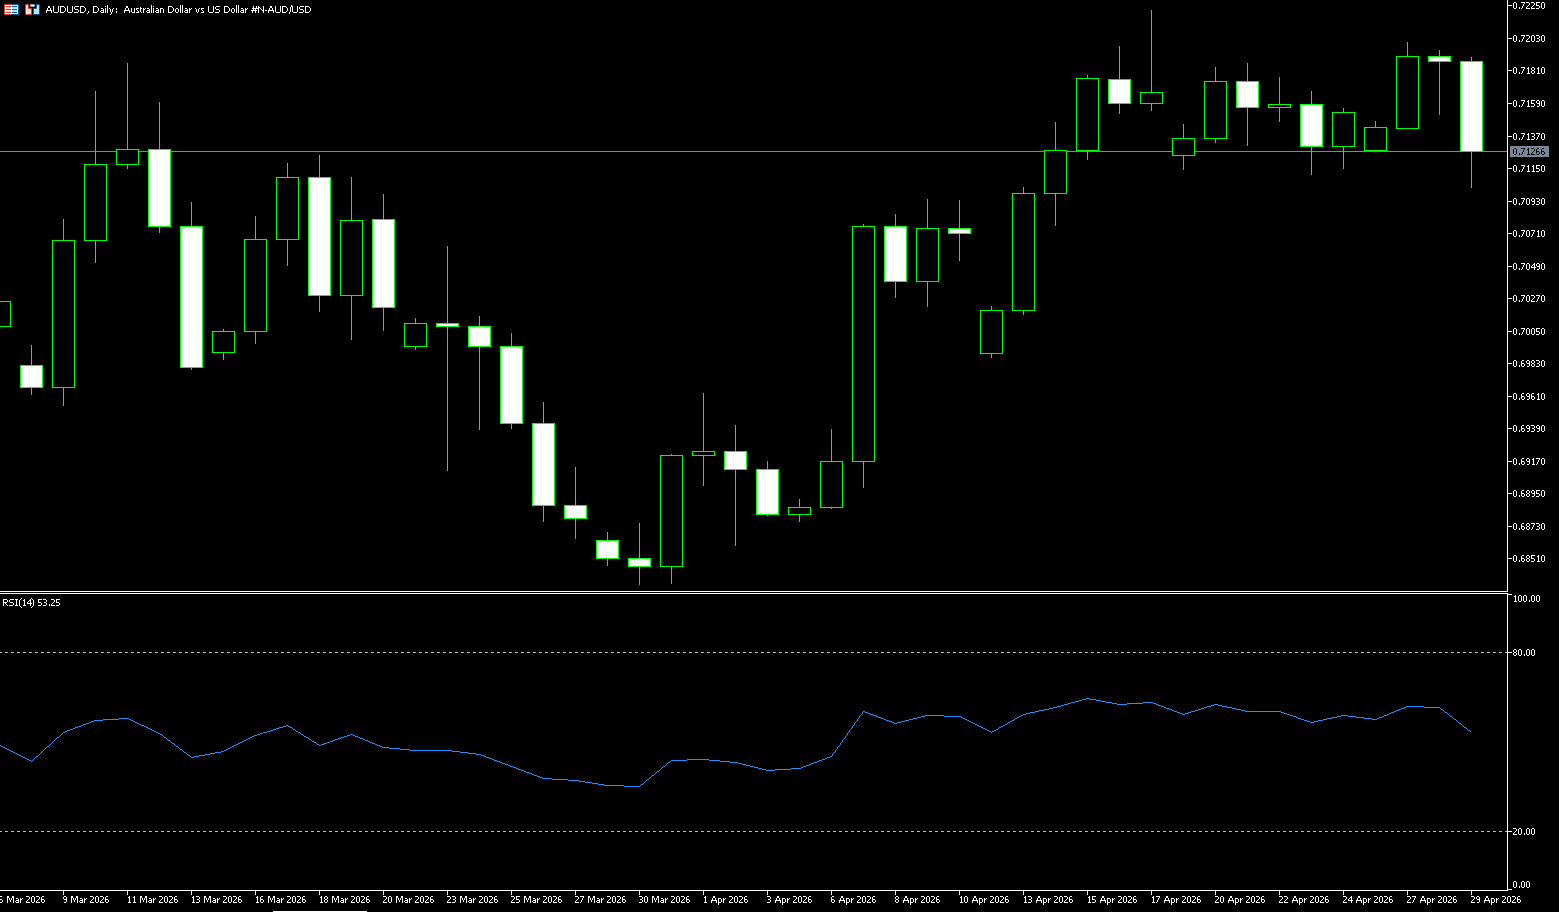
On Wednesday, the Australian dollar fell about 1%, heading towards 0.7100, as the Federal Reserve kept interest rates unchanged and Fed Chairman Jerome Powell hinted that he would remain on the Fed Board after his term ends. At the press conference, Powell congratulated Kevin Warsh on successfully completing the first phase of becoming his successor and clarified that he would continue to serve as a governor until the criminal investigation concludes. He added that as a governor, he "will maintain a low profile" and will remain on the Fed after his eight-year term as chairman of the U.S. central bank ends on May 15. Regarding the monetary policy statement, the Fed stated that the U.S. economy remains resilient, the unemployment rate has "not changed much in recent months," and inflation is high, mainly driven by rising energy prices related to the conflict with Iran. The Fed noted that recent events in the Middle East have increased economic uncertainty and emphasized that policymakers will continue to weigh both aspects of their dual mandate.
On the daily chart, the Australian dollar is trading at 0.7120 against the US dollar, maintaining a slightly bearish intraday tone as it continues to trade below the recent high of 0.7200, which now acts as immediate resistance. The latest Stochastic RSI reading is near 60, suggesting room for a moderate corrective bounce. On the upside, the first resistance level to break is 0.7200 (the April 27 high) and the April 17 high of 0.7222, to ease the immediate bearish bias and pave the way for a deeper rally. The next resistance lies at the psychological level of 0.7300. On the downside, the lack of clear nearby support levels in this timeframe makes further downward movement easier, and traders may rely on intraday lows and psychological levels as temporary demand signals. Initial support is at the psychological level of 0.7100, where a pullback is expected to attract bargain hunters, provided this level holds. A deeper correction would expose the 50-day moving average at 0.7057 as a more crucial structural bottom.
Today, consider going long on the Australian dollar at 0.7108, with a stop-loss at 0.7100 and targets at 0.7160 and 0.7170.
GBP/USD
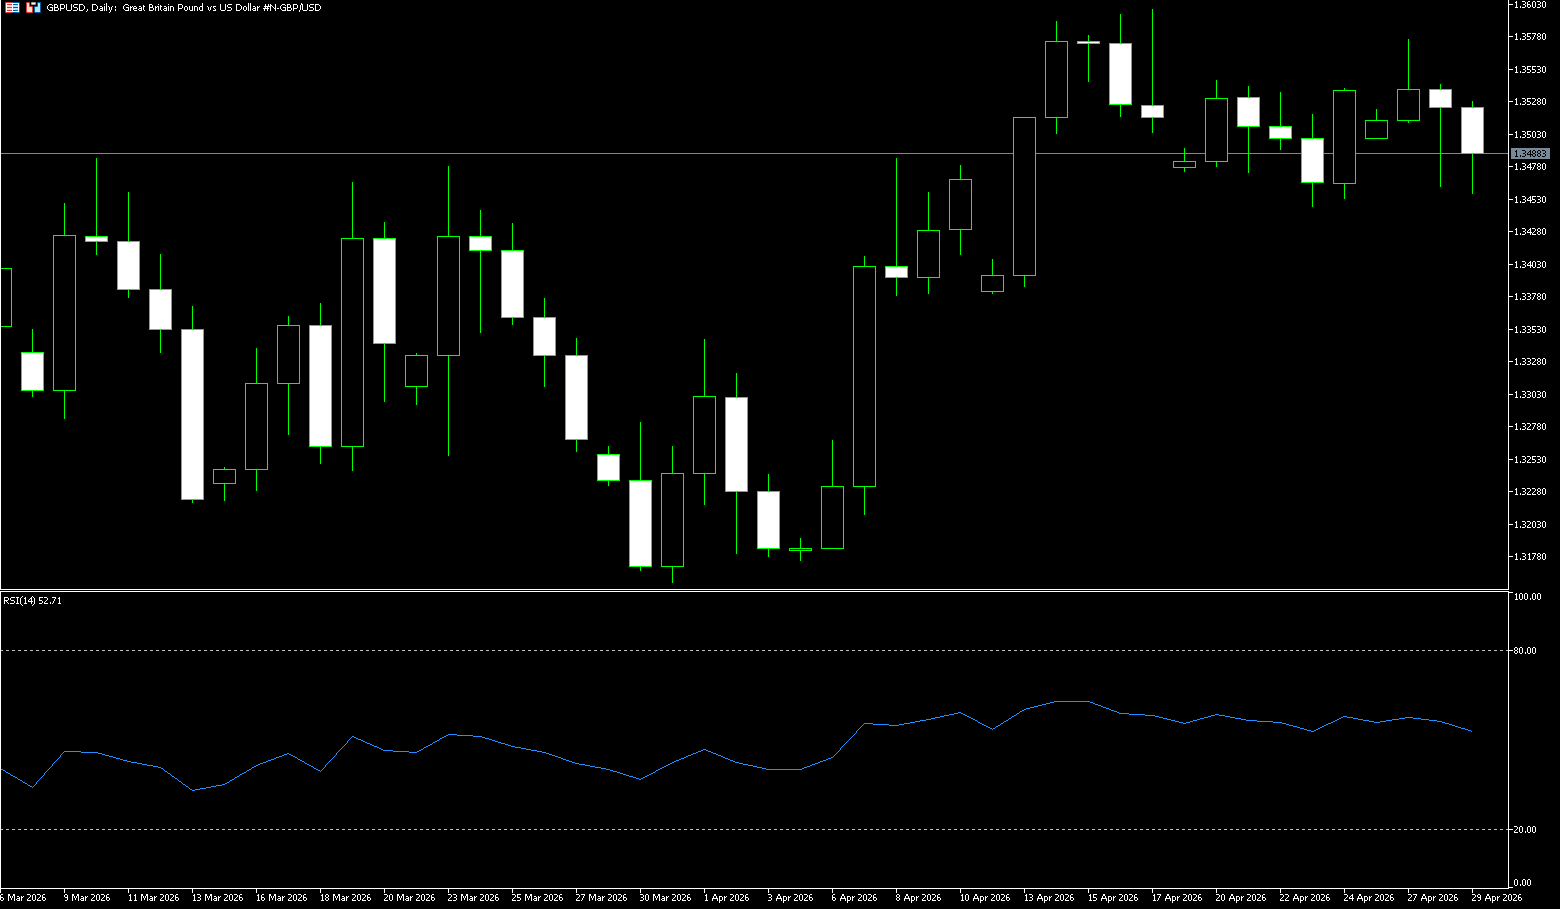
The pound is trading sideways slightly below $1.35 as the ongoing US-Iran standoff and domestic political pressures weigh on the market. Tensions escalated after a US official revealed President Trump's dissatisfaction with a recent proposal to delay nuclear talks until the current conflict and shipping disputes are resolved. In the UK, Prime Minister Keir Starmer faces a crucial vote on Tuesday regarding whether to investigate his assurances to Parliament regarding Peter Mandelson's appointment as US ambassador. While Starmer's allies are confident of securing a vote, the controversy could overshadow next week's critical local elections. Investors are also focused on the Bank of England's policy decision on Thursday, with expectations that the central bank will keep interest rates at 3.75% amid the Middle East crisis. Analysts anticipate a near-unanimous or strong majority vote to maintain the current stance.
The pound/dollar pair edged higher after a slight decline the previous day, trading near 1.350 on Wednesday. Technical analysis on the daily chart suggests a potential bearish reversal as the pair hovers near the lower boundary of its ascending channel. However, the pound/dollar maintains a moderately bullish bias, holding above its 20-day (1.3451) and 50-day (1.3408) simple moving averages. These moving averages cluster below the spot price, indicating support after the recent rally, while the 14-day Relative Strength Index (RSI) of around 56 suggests positive but not overextended momentum, leaving room for further gains, provided the pair remains capped by nearby resistance. The pound/dollar could rise to the key resistance level of 1.3599, the two-month high reached on April 17. Further gains would support a test of 1.3672 (the high of February 12).
Today, consider going long on GBP at 1.3465, with a stop-loss at 1.3455 and targets at 1.3520 and 1.3530.
USD/JPY
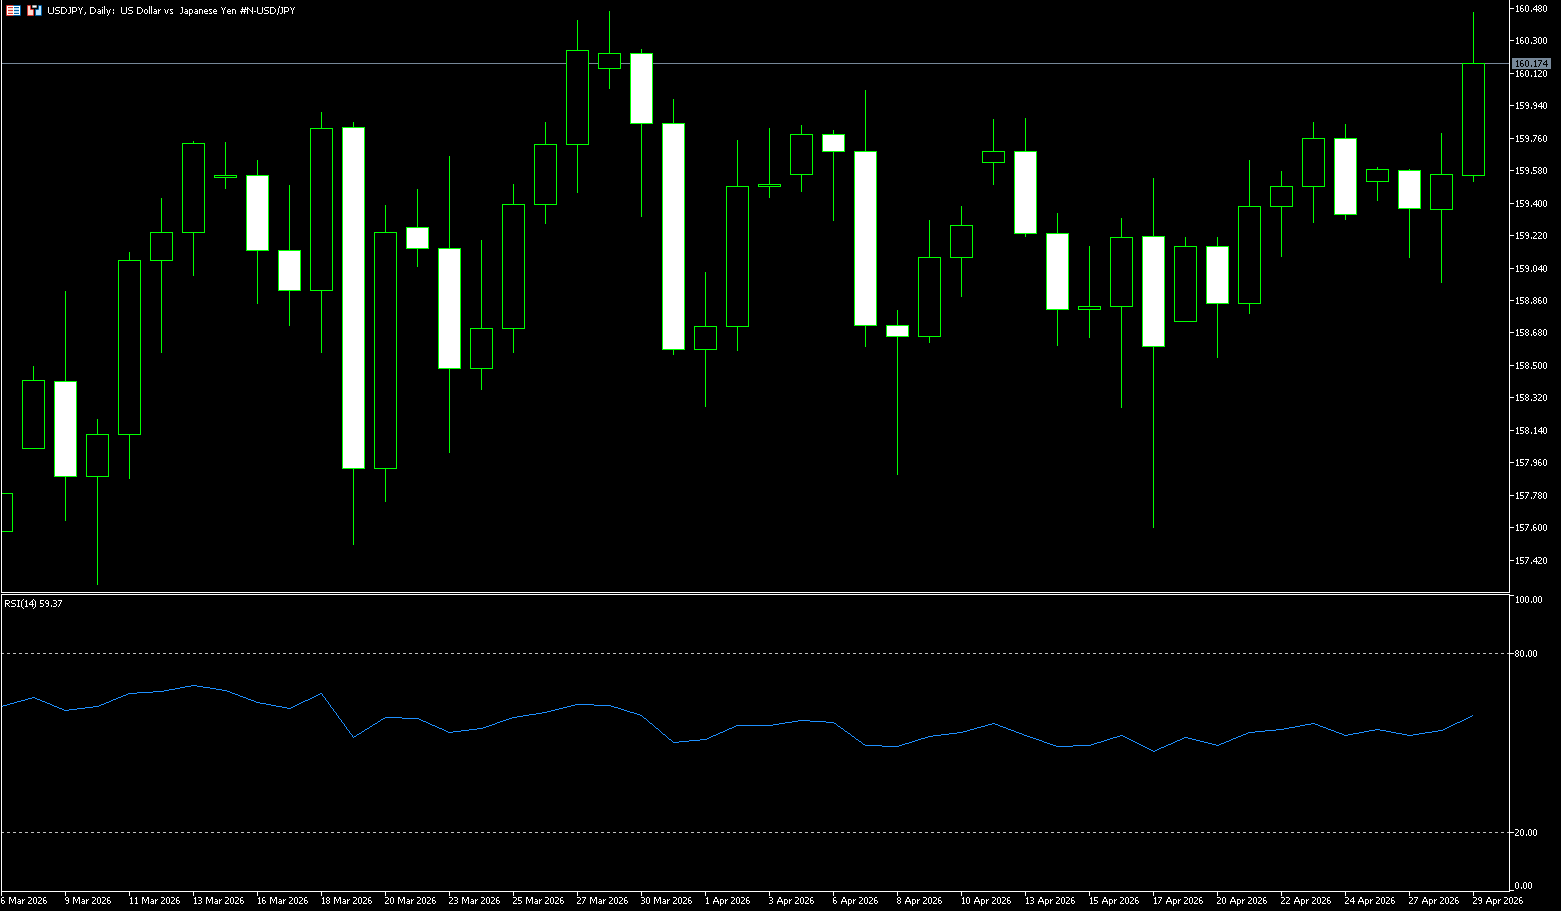
USD/JPY is trading around 160.30, near a two-year high, after the Federal Reserve decided to keep interest rates unchanged as widely expected. This was also the last meeting chaired by Jerome Powell. Although the Fed's decision to keep rates unchanged was in line with market expectations, the statement contained some hawkish comments, emphasizing that inflation "remains high." Traders are now turning their attention to Chairman Powell's press conference. Earlier in the day, US President Trump's nominee for Fed Chair, Kevin Warsh, was confirmed by the Senate Banking Committee. Warsh is not yet officially elected; he needs confirmation from the entire Senate to succeed Powell on May 15. Earlier in the day, White House officials said President Trump was discussing with oil companies continuing the blockade of the Strait of Hormuz until Iran agrees to the nuclear agreement. This news boosted the dollar and oil prices.
On the daily chart, USD/JPY is trading above 160. The currency pair maintains a short-term bullish bias as prices hold above the 50-day simple moving average at 158.51 and the 100-day simple moving average at 157.27, preserving the broader uptrend. The Stochastic Relative Strength Index (RSI) has bounced into the mid-50 range, indicating that upward momentum is resuming after a period of consolidation within the ongoing bullish structure. On the downside, initial support is seen around the 50-day simple moving average at 158.51. A drop to this level would maintain the broader bullish bias as long as the pair trades above the 100-day simple moving average at 157.27. On the upside, a hold above the aforementioned downward sloping boundary could see the pair advance towards the March 30 high of 160.46. A break above this level would open up further upside potential, targeting the psychological level of 161.00.
Today, consider shorting the US dollar at 160.55, with a stop loss at 160.75 and targets at 159.50 and 159.30.
EUR/USD
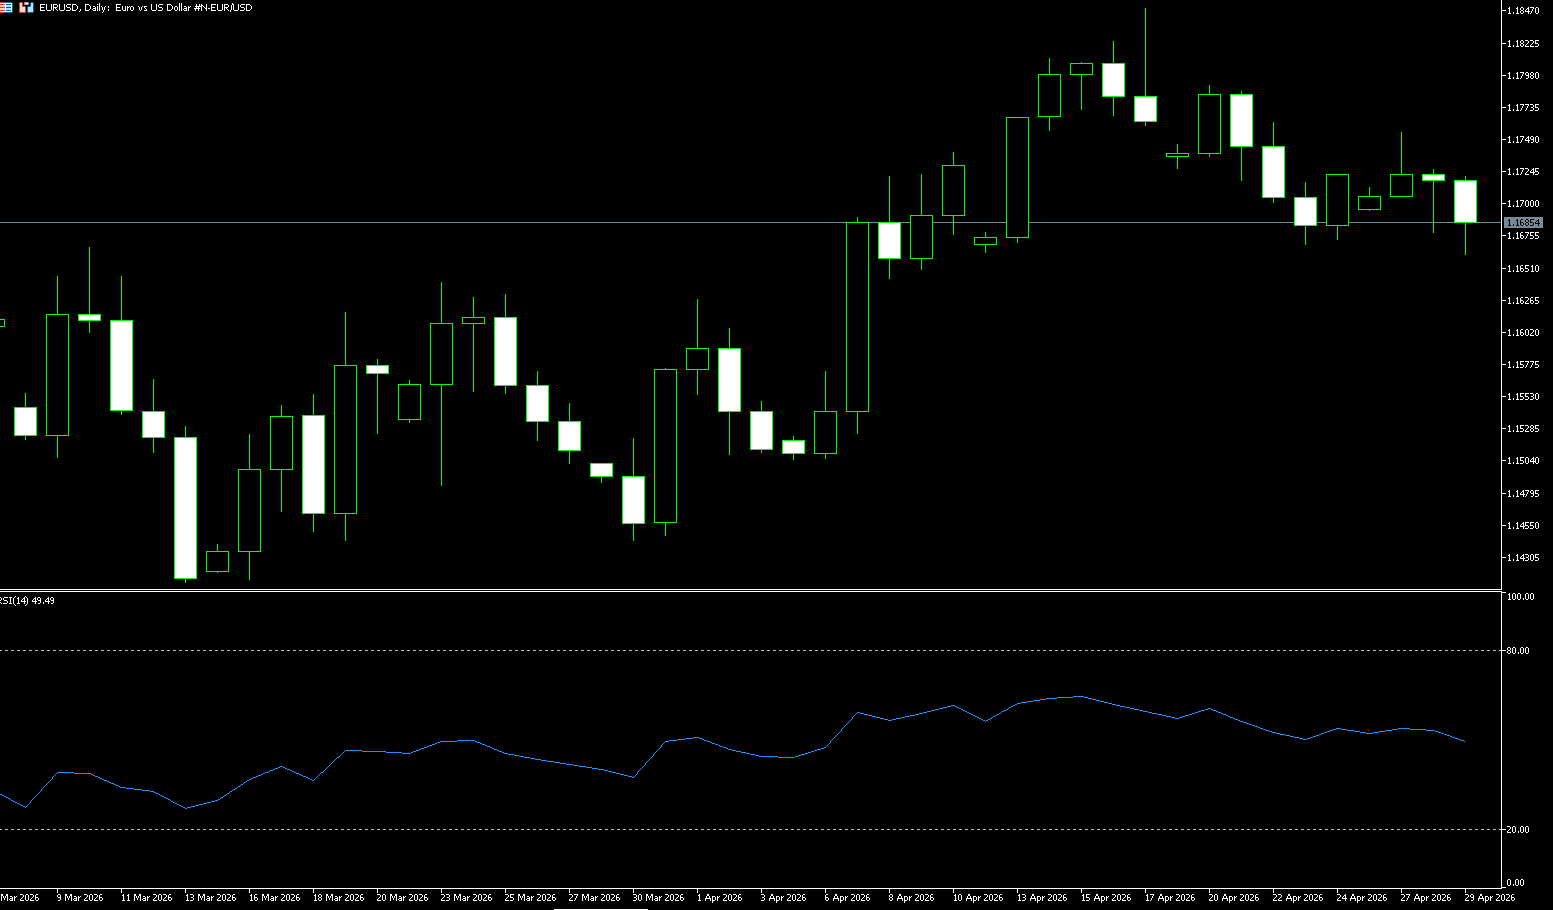
The euro is hovering below $1.17, near last week's two-week low, as investors grapple with the consequences of stalled US-Iran negotiations and prepare for a wave of key economic data. EUR/USD consolidated near 1.1700 on Wednesday, within Tuesday's trading range. The major currency pair is generally moving sideways as investors await the European Central Bank's monetary policy announcement on Thursday. The ECB is expected to keep interest rates unchanged at its meeting on Thursday, adopting a cautious stance amid the Middle East crisis. However, further tightening is still under consideration, with the market anticipating at least two 25 basis point rate hikes in 2026. Warnings have been issued about upside risks to inflation due to high energy prices caused by the prolonged closure of the Strait of Hormuz. Investors will be closely watching comments from ECB President Christine Lagarde for clues as to whether the two central banks are discussing near-term monetary policy tightening.
The daily chart shows the EUR/USD exchange rate flat below approximately 1.1700. The pair is consolidating, hovering around the 21-day simple moving average at 1.1690, but still above the 38.2% Fibonacci retracement level of 1.1666. The 14-day Relative Strength Index (RSI), after failing to hold above 60.00 for an extended period, has moved into the 50.00-55.00 range, indicating weakening upward momentum, but an upward bias still exists. On the upside, short-term resistance is at the 50.0% Fibonacci retracement level of 1.1745, followed by 1.1830, the high reached at the end of February. On the downside, the 38.2% retracement level of 1.1666 and 1.1650 (the 50-day simple moving average) provide initial support; a break below this area would expose deeper support down to the psychological level of 1.1600.
Consider going long on the Euro today at 1.1658, with a stop-loss at 1.1646 and targets at 1.1710 and 1.1720.
Disclaimer: The information contained herein (1) is proprietary to BCR and/or its content providers; (2) may not be copied or distributed; (3) is not warranted to be accurate, complete or timely; and, (4) does not constitute advice or a recommendation by BCR or its content providers in respect of the investment in financial instruments. Neither BCR or its content providers are responsible for any damages or losses arising from any use of this information. Past performance is no guarantee of future results.
Lebih Liputan


Pendedahan Risiko:Instrumen derivatif diniagakan di luar bursa dengan margin, yang bermakna ia membawa tahap risiko yang tinggi dan terdapat kemungkinan anda boleh kehilangan seluruh pelaburan anda. Produk-produk ini tidak sesuai untuk semua pelabur. Pastikan anda memahami sepenuhnya risiko dan pertimbangkan dengan teliti keadaan kewangan dan pengalaman dagangan anda sebelum berdagang. Cari nasihat kewangan bebas jika perlu sebelum membuka akaun dengan BCR.
BCR Co Pty Ltd (No. Syarikat 1975046) ialah syarikat yang diperbadankan di bawah undang-undang British Virgin Islands, dengan pejabat berdaftar di Trident Chambers, Wickham’s Cay 1, Road Town, Tortola, British Virgin Islands, dan dilesenkan serta dikawal selia oleh Suruhanjaya Perkhidmatan Kewangan British Virgin Islands di bawah Lesen No. SIBA/L/19/1122.
Open Bridge Limited (No. Syarikat 16701394) ialah syarikat yang diperbadankan di bawah Akta Syarikat 2006 dan berdaftar di England dan Wales, dengan alamat berdaftar di Kemp House, 160 City Road, London, City Road, London, England, EC1V 2NX. Entiti ini bertindak semata-mata sebagai pemproses pembayaran dan tidak menyediakan sebarang perkhidmatan perdagangan atau pelaburan.

 English
 简体中文
简体中文
 繁體中文
繁體中文
 Bahasa
Melayu
Bahasa
Melayu
 Tiếng
Việt
Tiếng
Việt
 ไทย
ไทย
 日本語
日本語
 한국어
한국어
 ភាសាខ្មែរ
 español


