


0
US Dollar Index
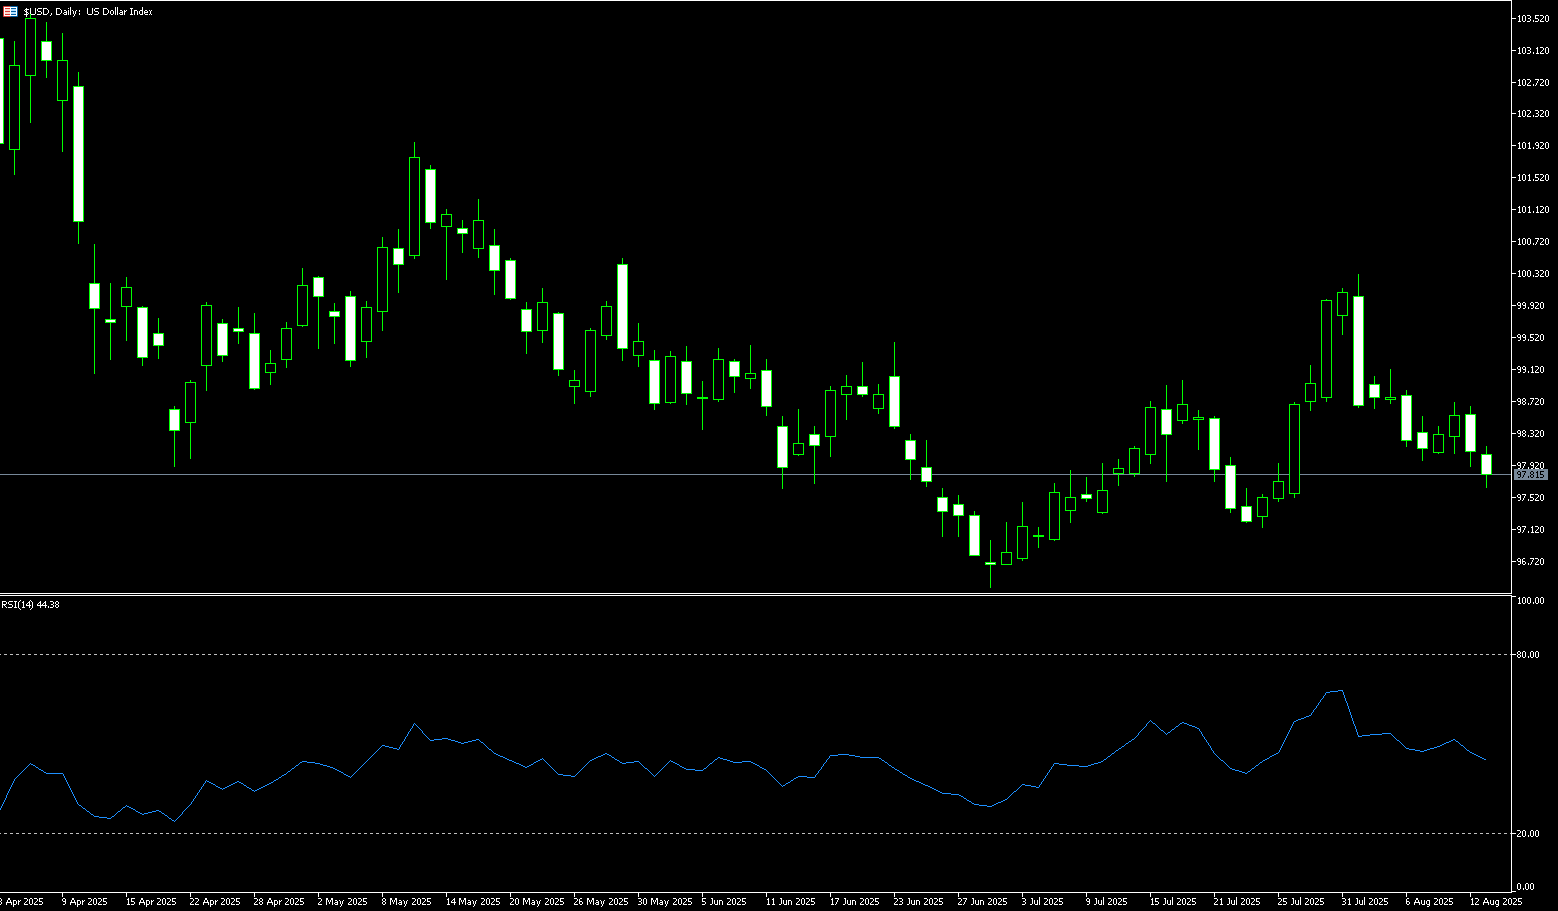
The US dollar fell across the board in the first half of the week, falling below the key 98.00 level to a low of 97.62. Earlier data showed a modest increase in US consumer prices in July, keeping the Federal Reserve's interest rate cut possibility alive next month. Underlying inflation remains subdued, giving policymakers wiggle room to respond to nascent signs of labor market weakness. Chairman Powell's speech at Jackson Hole on the 21st should put the possibility of a September rate cut on the agenda. Money markets have been holding onto their money as growing expectations mount that benign readings on US price pressures could solidify bets on a Fed rate cut next month, which increased after last week's weak jobs data. If the Fed continues to cut rates, the policy rate differential with its peers could narrow rapidly, putting pressure on the dollar against higher-yielding currencies.
If Powell signals a readiness for further significant rate cuts at the Jackson Hole symposium, the US dollar index could face continued selling pressure, pushing it towards the key support level of 98.00. From a technical perspective, the US dollar index fell below its 9-day simple moving average of 98.37 and briefly dipped to a near three-week low of 97.62, putting it in a weak position. The 14-day relative strength index (RSI) is below 45.00, indicating a weak market bias. The recent sell-off has raised the possibility of a re-break through the support level of 97.62, which could serve as a trigger for an accelerated decline. The next major target is the low of 97.49 set on July 28, further towards 97.00. On the upside, the market is viewing 98.00 (round number mark) and the 9-day simple moving average of 98.37 as key pivot points. A clean break above these levels could trigger a move towards strong resistance near 98.67 (Monday's high) and above 99.00 (round number mark).
Consider shorting the US Dollar Index at 97.94 today, with a stop-loss at 98.05 and a target of 97.40 or 97.30.
WTI Spot Crude Oil
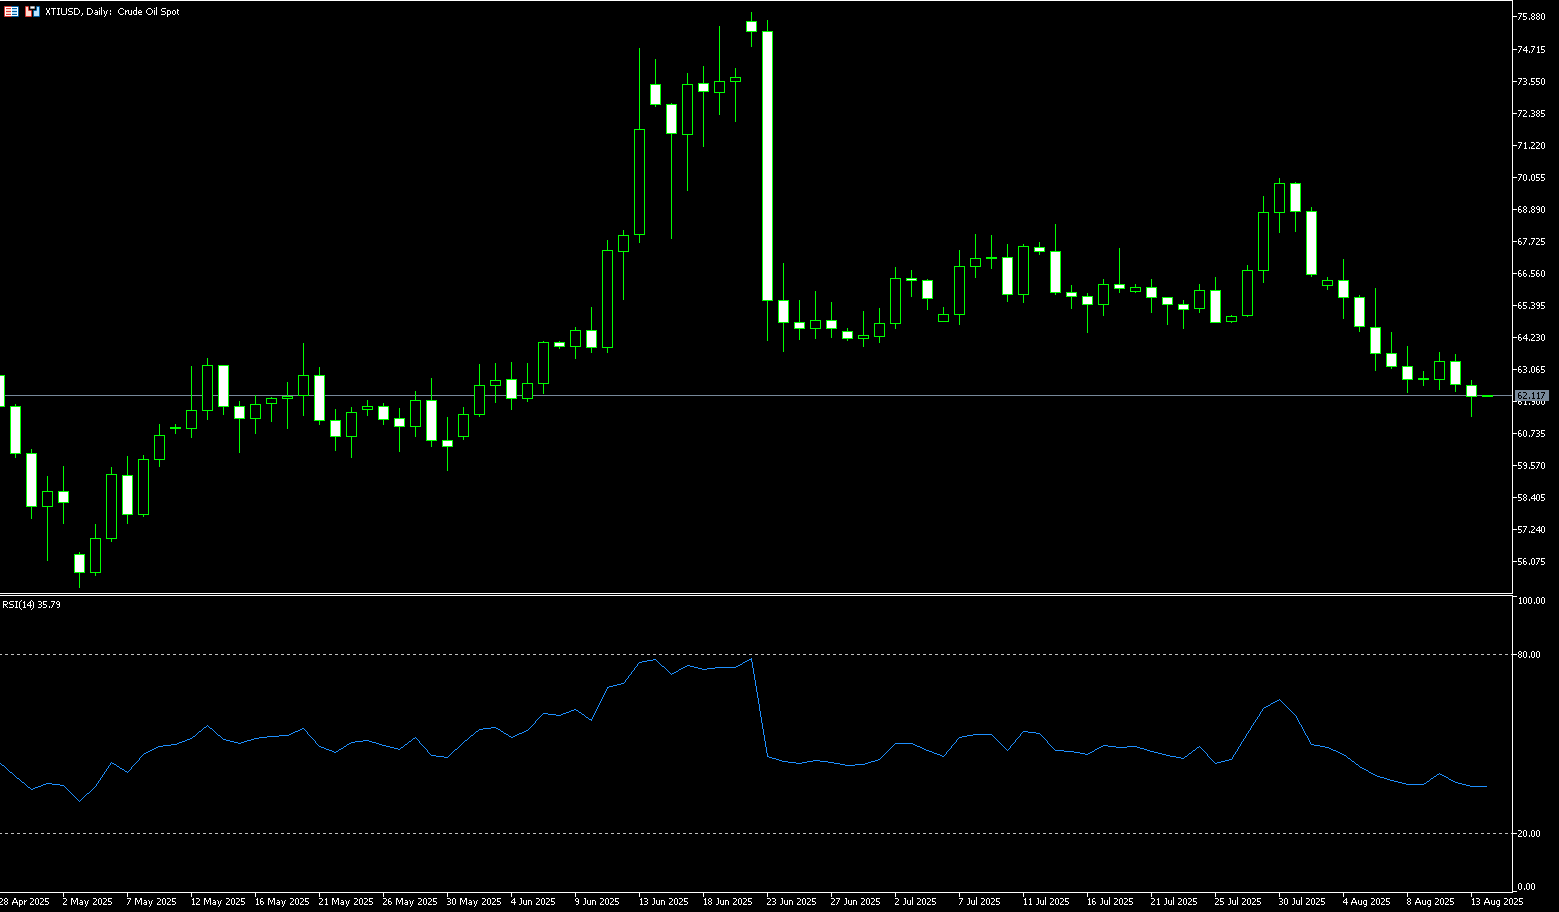
WTI crude oil traded around $62.00 per barrel on Wednesday, having earlier fallen to a low of $61.35. Traders awaited the U.S. Energy Information Administration's inventory report and began watching for signs of a potential decline in demand as the summer driving season ends in early September. U.S. consumer prices rose in July, with tariffs increasing the cost of imported goods, driving the largest month-over-month increase in a measure of core inflation in six months. Diesel demand, which drives oil demand, appears to be weakening. Meanwhile, the outlooks released by the Organization of the Petroleum Exporting Countries (EIA) and OPEC indicate that oil production will increase this year, but both forecast a decline in U.S. production in 2026, while oil and gas production will increase elsewhere in the world. Trump and Russian President Vladimir Putin will meet in Alaska on Friday to discuss ending Russia's war in Ukraine, which could also weigh on the oil market.
The daily chart shows that WTI crude oil is developing bearish momentum below long-term resistance at $70.00 (a psychological level) and $70.02 (the July 30 high). Prices have broken out of a symmetrical triangle pattern, establishing negative price action. A decisive break below the psychological support level of $60.00 would confirm the start of the next bearish trend. On a broader long-term timeframe, oil prices remain within a descending channel, suggesting continued volatility. This short-term price action reflects the ongoing tug-of-war between bullish momentum and bearish pressure in the market as prices break out of the symmetrical triangle. Crude oil's latest decline has temporarily stabilized at $62.00. If this level is broken, key support lies at $61.60 (the June 4 low). A further test of $60.00 (the psychological level) is possible. If $62.00 holds and WTI climbs back to $64.42 (the 100-day moving average), the market could see a resurgence. A break below this level could lead to $65.76 (50.0% Fibonacci retracement).
Consider going long on crude oil at $61.85 today. Stop-loss: $61.65, target: $63.50, $64.00.
Spot Gold
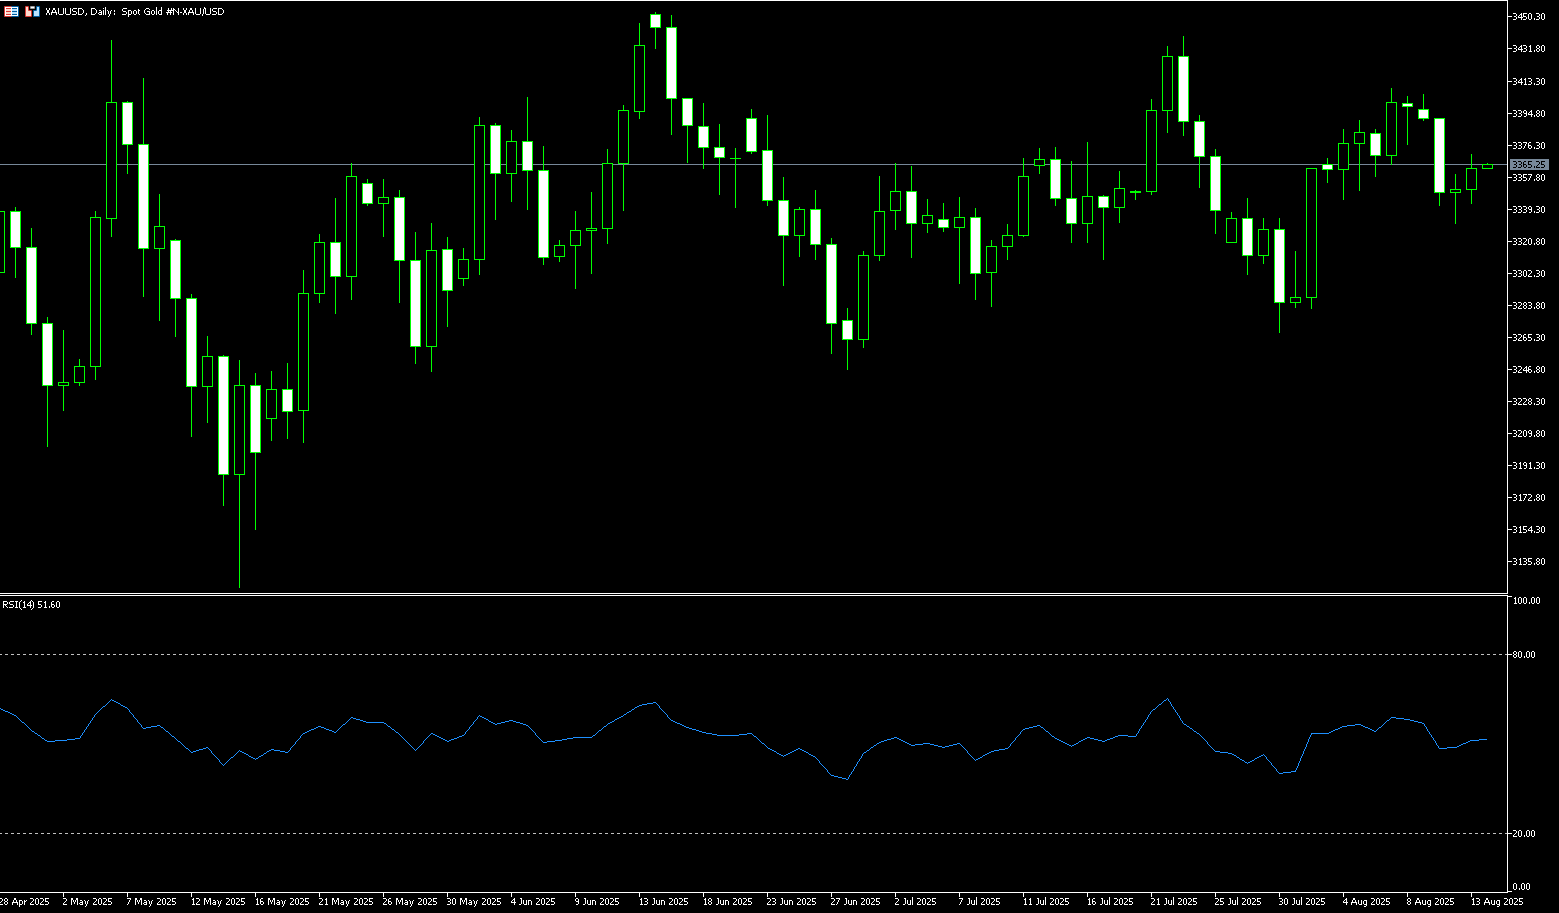
Spot gold saw a second consecutive day of buying on Wednesday (August 13), reaching a high of $3,370, attempting to build on the previous day's rebound from around $3,331. The latest US Consumer Price Index (CPI) data for July was largely in line with expectations, reinforcing market expectations of a September interest rate cut by the Federal Reserve. This data kept the US dollar at a low level for over two weeks, further supporting gold as a non-yielding asset. However, gold's intraday rally appears to lack sufficient momentum, particularly given the potential for a resolution to the Russia-Ukraine conflict following the US-Russia summit, which has dampened its safe-haven properties. The shift in market sentiment suggests it's still prudent to hold long gold positions without strong follow-through buying.
From a midweek technical perspective, gold bulls still hold a clear overall near-term technical advantage, but their advantage appears to be waning. Bulls' next upside price objective is a close above strong resistance at $3,439-3,450, the July 23 low. Bears' next near-term downside price objective is pushing gold prices below strong technical support at $3,268-3,250, the near two-month low. First resistance lies at $3,369.50 (9-day simple moving average) and $3,370 (Wednesday's high), followed by $3,400.00 (round number). First support lies at $3,331 (this week's low), followed by $3,300.00 (a psychological level).
Consider going long on gold at 3,352 today, with a stop-loss at 3,348 and targets at 3,370 and 3,375.
AUD/USD
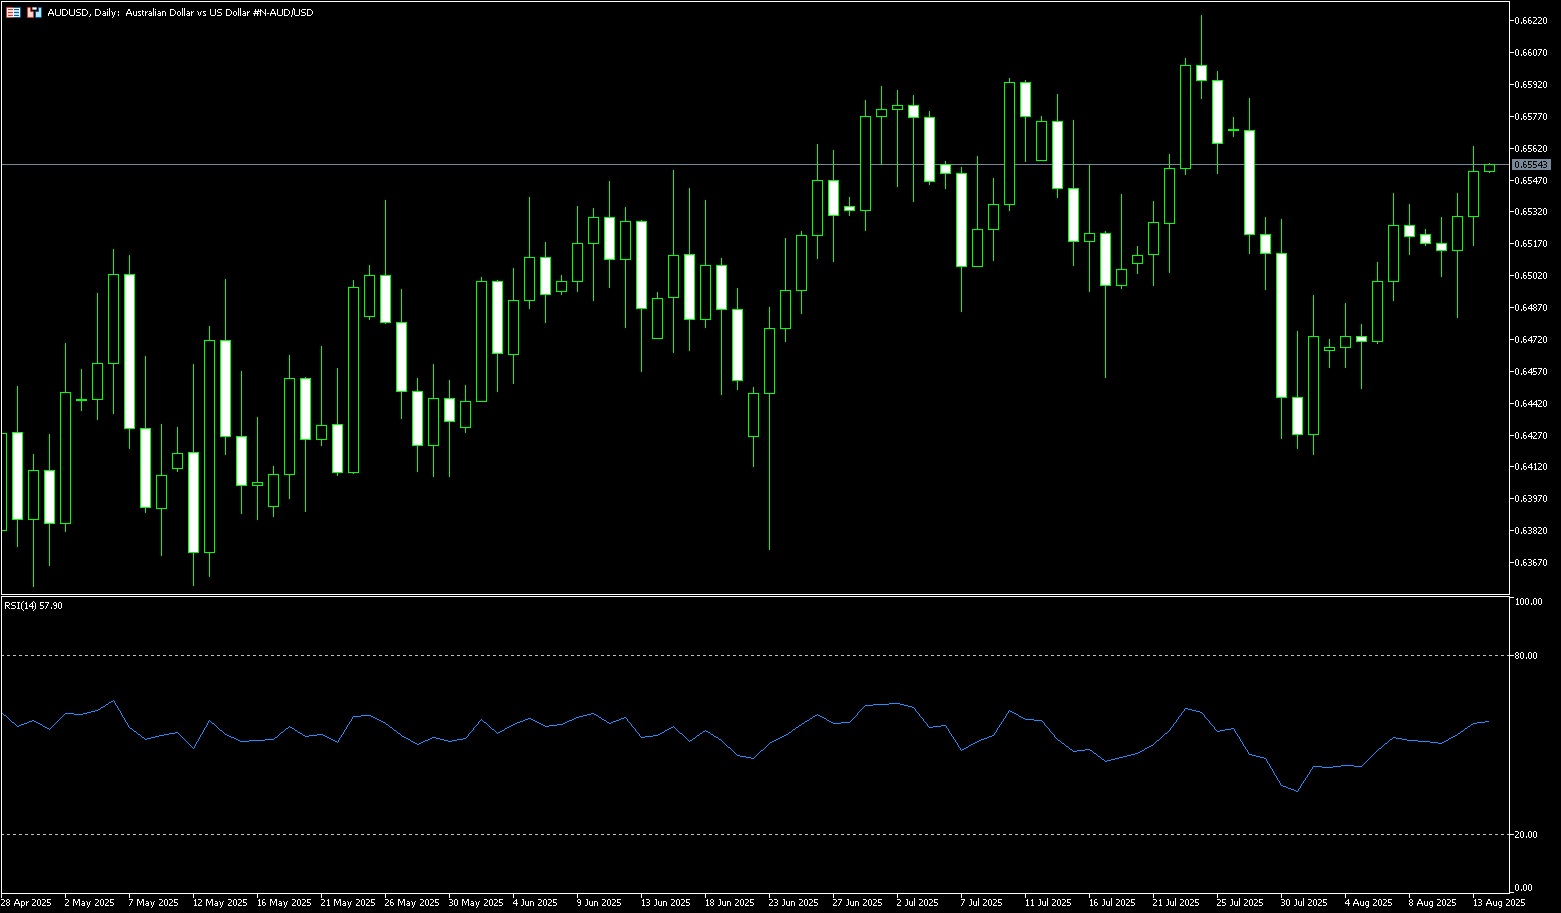
During Wednesday's European trading session, the AUD/USD pair hit a new two-week high near 0.6560. The AUD strengthened against the US dollar, and market expectations for a Fed rate cut at its September policy meeting have risen significantly. The Reserve Bank of Australia's dovish rate cut continues to put pressure on the currency. On Tuesday, the central bank lowered its official cash rate, as widely expected, and indicated that further easing may be needed to achieve its inflation and employment targets due to weakening economic growth momentum. It also lowered its 2025 GDP forecast from 2.1% to 1.7%, citing weak public demand at the beginning of the year and its unlikely recovery. Markets now imply only a 34% probability of another rate cut in September, although the market is fully pricing in two more rate cuts by early 2026, bringing the rate to around 3.1%. Meanwhile, a weakening US dollar, fueled by growing market expectations for a September rate cut by the Federal Reserve, limited the Australian dollar's decline. The commodity-linked Australian dollar also benefited from rising iron ore prices, as the extended US-China trade truce boosted demand for Australia's resource-rich exports.
The Australian dollar was trading around 0.6550 against the US dollar on Wednesday. Technical analysis on the daily chart suggests strengthening short-term momentum. Furthermore, AUD/USD remains above its 20-day simple moving average of 0.6514. The 14-day relative strength index (RSI) is slightly above 50, suggesting a neutral market bias. Further movement will indicate a clear directional trend. On the upside, AUD/USD could target the upper line of the ascending channel at 0.6570, and the 0.6576 area, the 76.4% Fibonacci retracement level from 0.6625 to 0.6420. A successful breakout could strengthen the bullish bias and support the pair's pursuit of the psychological level of 0.6600. On the downside, the pair could test its psychological 0.6500 level and the 20-day simple moving average around 0.6514. A break below this key support zone would weaken short- and medium-term price momentum and exert downward pressure on the pair, potentially testing last week's low of 0.6449, followed by the 0.6400 level.
Consider a long position on the Australian dollar at 0.6540 today, with a stop-loss at 0.6530 and targets at 0.6580 and 0.6590.
GBP/USD
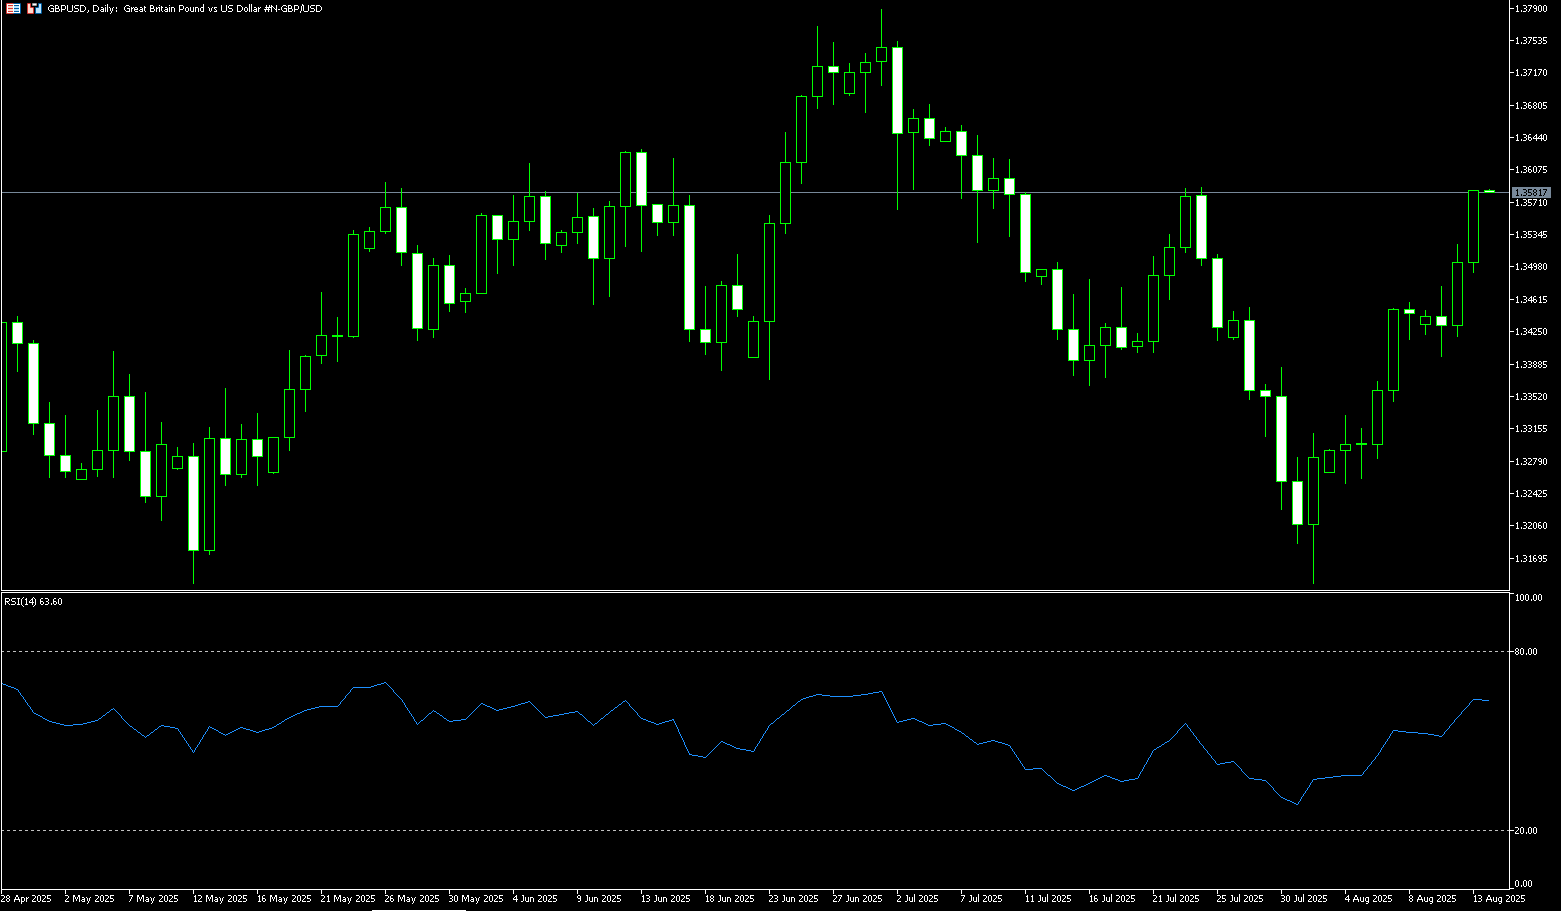
The British pound rose to $1.3585, a three-week high, after UK labor data showed a smaller-than-expected decline in unemployment in July, easing concerns about the economy. The payroll fell by 8,000, well below the 20,000 expected, and following downward revisions to previous months' figures, suggesting the labor market remains solid despite the UK government's £26 billion tax increase. The unemployment rate remained at 4.7%, while private sector wage growth slowed slightly to 4.8%, still above the Bank of England's 2% inflation target. The data highlights the Bank of England's delicate balancing act between firm inflation and a sluggish labor market following its narrow 25 basis point interest rate cut. Investors are now focused on second-quarter GDP, expected to show a 0.1% increase. Trade and geopolitics remain key concerns, with the US-China tariff pause extended for 90 days and a US-Russia meeting on Ukraine scheduled for Friday.
The British pound rose against the US dollar on Wednesday, trading around 1.3570. The pair is trading above its 50-day simple moving average of 1.3502 on the daily chart and the psychological level of 1.3500, indicating a short-term upward bias. The 14-day relative strength index (RSI) rebounded above 60.00 after trading below 50 for several sessions, suggesting a bullish reversal attempt. Currently, the British pound continues its upward trend against the US dollar and is approaching its highest level in three weeks at 1.3585. If the pair re-traces above the 1.3500 level and the 50-day simple moving average of 1.3502, the next key resistance level will be yesterday's high near 1.3585 and the 1.3600 psychological level. A break below this level would target 1.3662, the July 7 high. Looking down, the 50-day simple moving average of 1.3502 and the 1.3500 psychological level will serve as key support areas, followed by the 1.3450 30-day simple moving average.
Consider a long GBP at 1.3565 today, with a stop-loss at 1.3550 and a target of 1.3595 or 1.3600.
USD/JPY
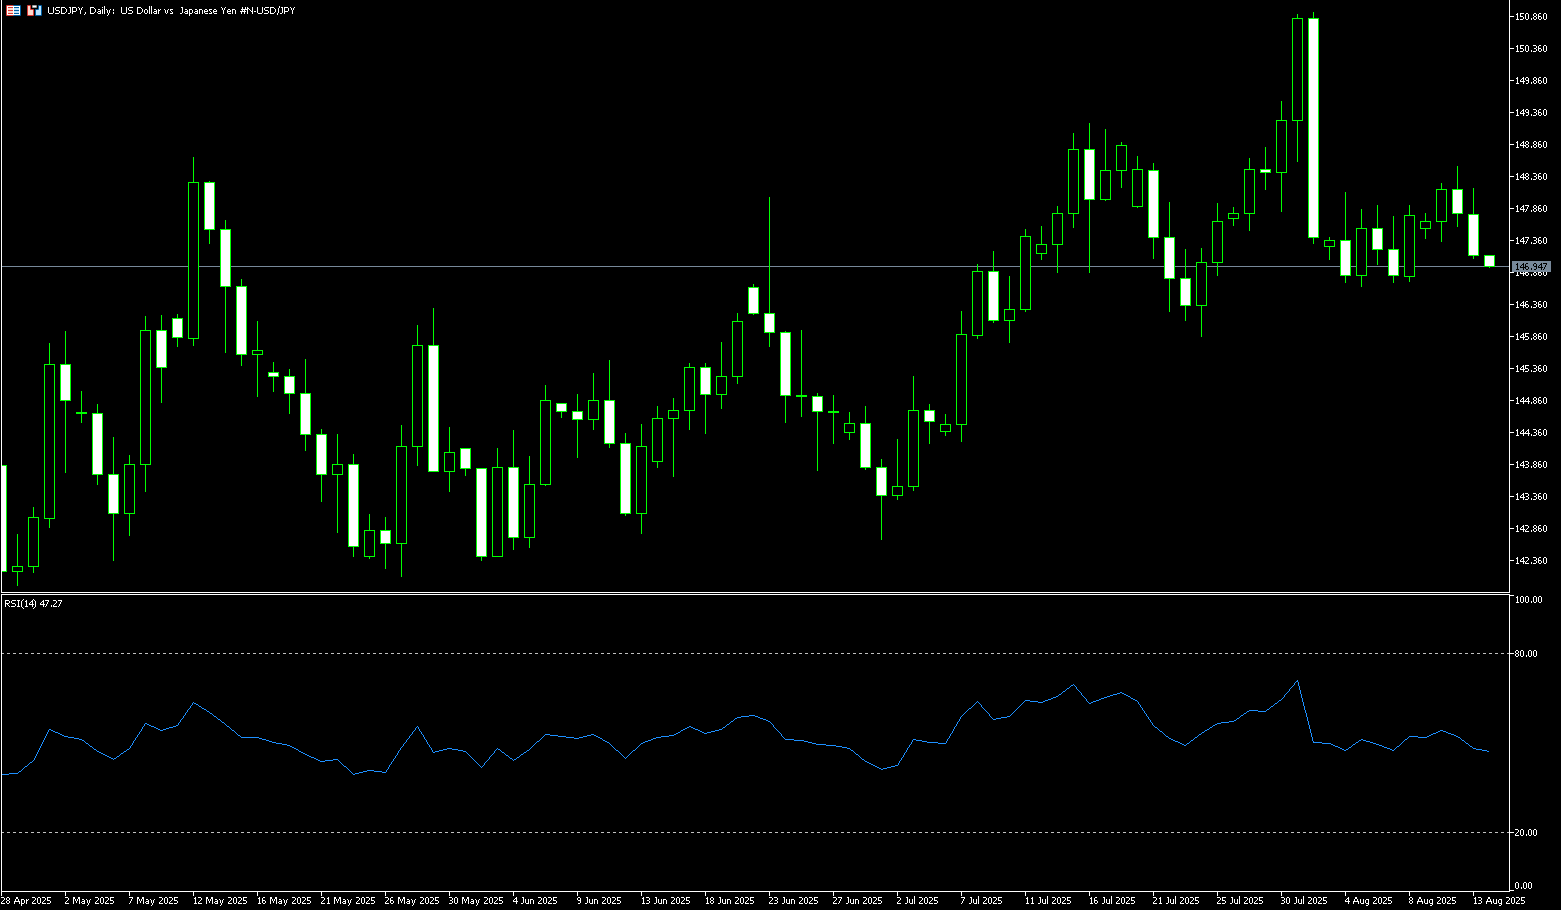
The US dollar fell against major currencies on Wednesday, extending its reversal to 147.00 against the yen following Tuesday's release of benign US inflation data. The data suggests that market hopes for a post-summer Federal Reserve rate cut have increased. Uncertainty about the timing of the Bank of Japan's next rate hike, coupled with underlying bullish sentiment, is acting as a headwind for the safe-haven yen. However, investors appear confident that the Bank of Japan will stick to its policy normalization path. By contrast, the Fed is expected to cut rates in September, a bet confirmed by Tuesday's US consumer inflation data, which came in broadly in line with expectations. This puts dollar bulls on the defensive and should continue to provide some support for the low-yielding yen. A lack of relevant market-moving economic data in the second half of the week leaves the dollar on the defensive amidst a series of influential speeches by FOMC members. Market focus will shift to Thursday's release of the US Producer Price Index, followed by Japan's preliminary second-quarter GDP data on Friday, which could bring some volatility to USD/JPY.
From a technical perspective on the daily chart, USD/JPY has shown some resilience below the 147.00 resistance-turned-support level for a second day. Furthermore, some dip-buying suggests the path of least resistance for the pair is to the upside. Therefore, a subsequent move toward the overnight highs in the 148.50-148.55 area, towards the 149.00 round number, appears a distinct possibility. On the other hand, weakness below the European session lows in the 147.18 area could still be seen as a buying opportunity around 147.00, with support remaining limited around 146.80. A breakout could put the USD/JPY pair at risk of testing levels below 146.00.
Consider shorting the US dollar at 147.55 today. Stop-loss: 147.75, target: 146.50, 146.30.
EUR/USD
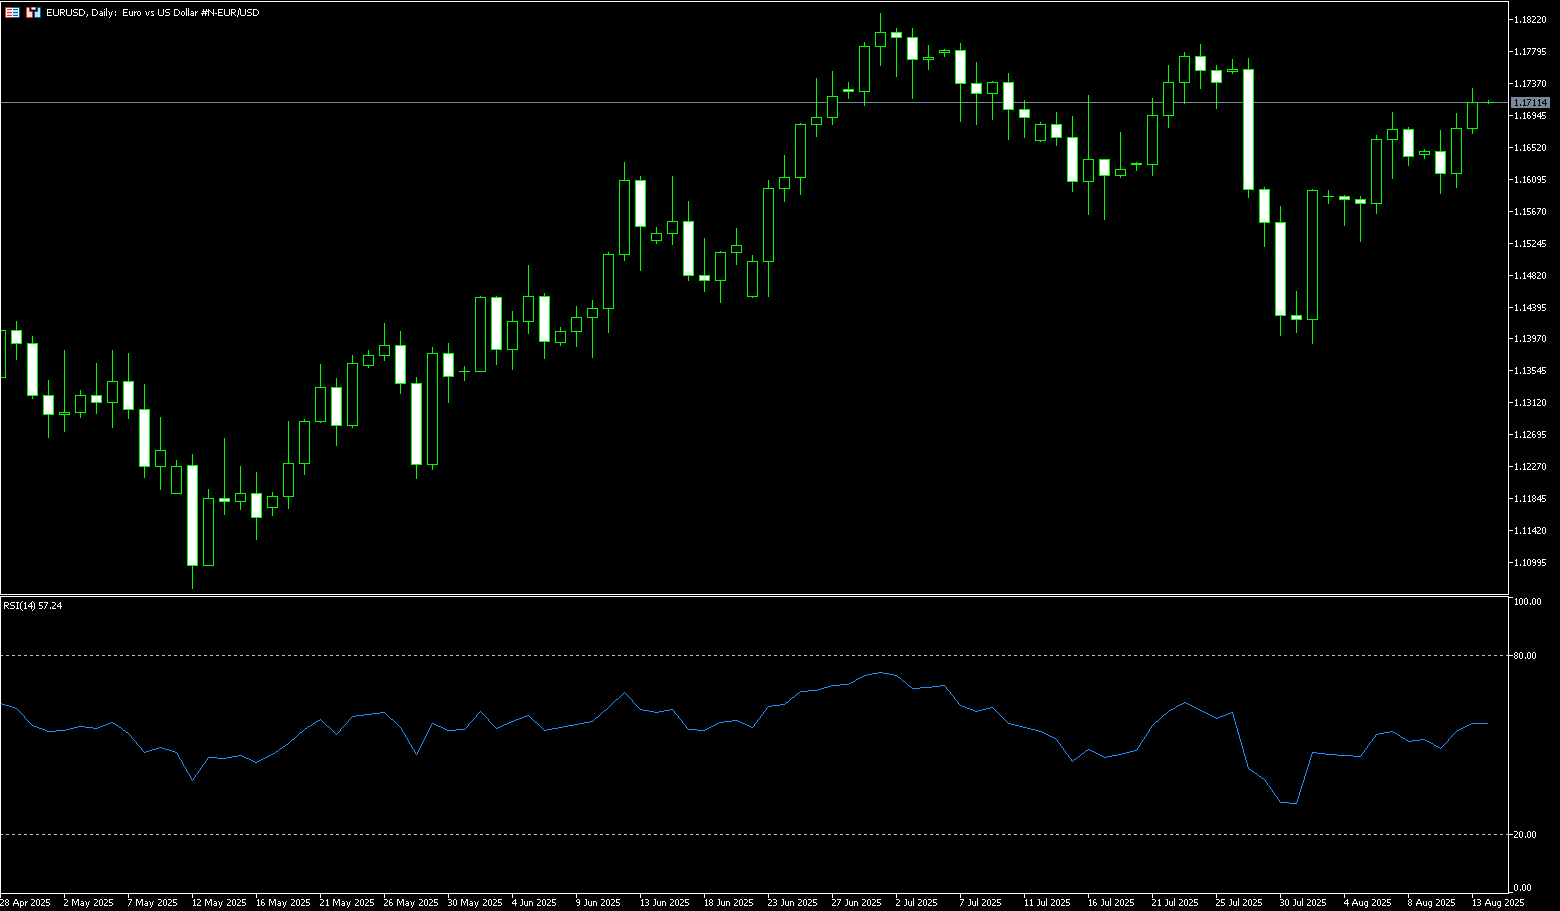
The euro gained momentum, rising above $1.1730, its highest level in nearly three weeks, extending its second leg of gains as the US dollar fell to its lowest level since late July. US inflation data fueled market expectations of a possible Federal Reserve rate cut in September, supporting global risk appetite. In Europe, the European Central Bank ended its easing cycle in July after eight rate cuts over the past year, keeping borrowing costs at their lowest level since November 2022, although some believe another rate cut is possible before the end of the year. Eurozone GDP grew 0.1% in the second quarter, and inflation remained stable at 2% in July. Trade risks remain as the EU faces 15% tariffs on many exports to the US. Geopolitically, European and Ukrainian leaders plan to meet with President Trump before his summit with Russian President Vladimir Putin.
Despite hitting a high of 1.1730 yesterday, just shy of the 1.1750 round-figure mark, the EUR/USD pair remains in an uptrend. Momentum suggests buyers are dominant, as indicated by the 14-day relative strength index (RSI). However, with the index flattening, the possibility of a pullback remains real. If EUR/USD falls below 1.1650, it could test the confluence of the 20-day and 50-day simple moving averages at 1.1628 and 1.1620. A break of these levels could lead to further declines towards 1.1600. Conversely, if EUR/USD breaks above 1.1750, the next key resistance levels are 1.1789 (July 24 high), 1.1800, and the year-to-date high of 1.1829.
Consider a long position on the euro at 1.1688 today, with a stop-loss at 1.1675 and targets at 1.1750 and 1.1760.
Disclaimer: The information contained herein (1) is proprietary to BCR and/or its content providers; (2) may not be copied or distributed; (3) is not warranted to be accurate, complete or timely; and, (4) does not constitute advice or a recommendation by BCR or its content providers in respect of the investment in financial instruments. Neither BCR or its content providers are responsible for any damages or losses arising from any use of this information. Past performance is no guarantee of future results.
Lebih Liputan


Pendedahan Risiko:Instrumen derivatif diniagakan di luar bursa dengan margin, yang bermakna ia membawa tahap risiko yang tinggi dan terdapat kemungkinan anda boleh kehilangan seluruh pelaburan anda. Produk-produk ini tidak sesuai untuk semua pelabur. Pastikan anda memahami sepenuhnya risiko dan pertimbangkan dengan teliti keadaan kewangan dan pengalaman dagangan anda sebelum berdagang. Cari nasihat kewangan bebas jika perlu sebelum membuka akaun dengan BCR.

 English
 简体中文
简体中文
 繁體中文
繁體中文
 Bahasa
Melayu
Bahasa
Melayu
 Tiếng
Việt
Tiếng
Việt
 ไทย
ไทย
 日本語
日本語
 한국어
한국어
 ភាសាខ្មែរ
 español