


0
US Dollar Index
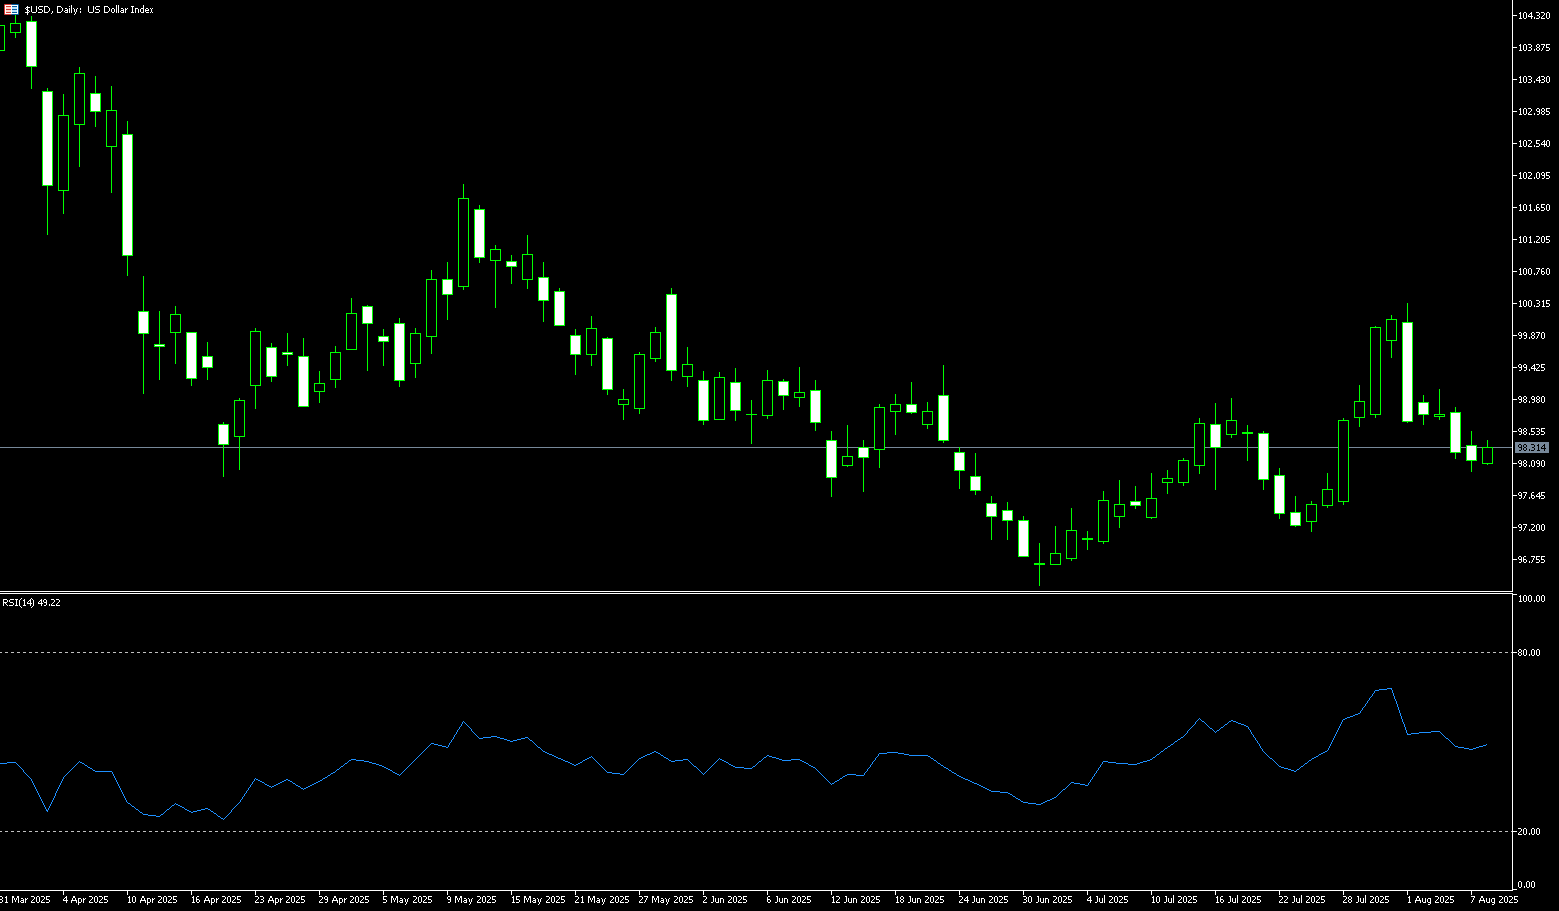
On Thursday, the US dollar index continued its recent weakness. Market sentiment was influenced by a combination of factors, including expectations regarding the progress of the Federal Reserve chair nomination, Trump's recent tariff comments, and weak US economic data. The US dollar index showed technical signs of being oversold, but fundamental uncertainty still dominated market sentiment. Furthermore, Trump's comments on tariffs in the semiconductor and pharmaceutical industries, as well as signals that the trade truce with China may be extended, have also exacerbated risk aversion. While market expectations for an extension of the trade truce remain relatively stable, the tariff rhetoric continues to exert mild pressure on non-US currencies such as the RMB. The dollar's overall weakness is likely to continue this week, driven by the market's dovish repricing of Fed policy and the potential policy uncertainty stemming from Trump's early nomination of the Fed chair.
Technically, the US dollar index is currently showing a clear weakening pattern. According to the latest data, the US dollar index has failed to stabilize after falling below the 20-day moving average (98.39) and the 61.8% Fibonacci retracement level of the 97.11 to 100.25 range at 98.31, indicating that bearish momentum remains dominant. Looking at the daily chart, if the RSI rebounds above 50 from oversold territory and the MACD forms a golden cross, it would provide further confirmation of rebound momentum. This scenario could be driven by a short-term improvement in market sentiment or a easing of dovish rhetoric from Federal Reserve officials. If the US dollar index finds support near 98.00 (round number) and 97.77 (78.6% Fibonacci retracement), it could trigger a technical rebound targeting the 20-day moving average (98.39) and the 61.8% Fibonacci retracement level of 98.31, or even further to the 50.0% retracement level of 98.69. Otherwise, the market could test 97.77 (78.6% Fibonacci retracement) and the 97.00 round-figure mark.
Consider shorting the US Dollar Index at 98.20 today, with a stop-loss at 98.30 and a target of 97.70 or 97.55.
WTI Spot Crude Oil
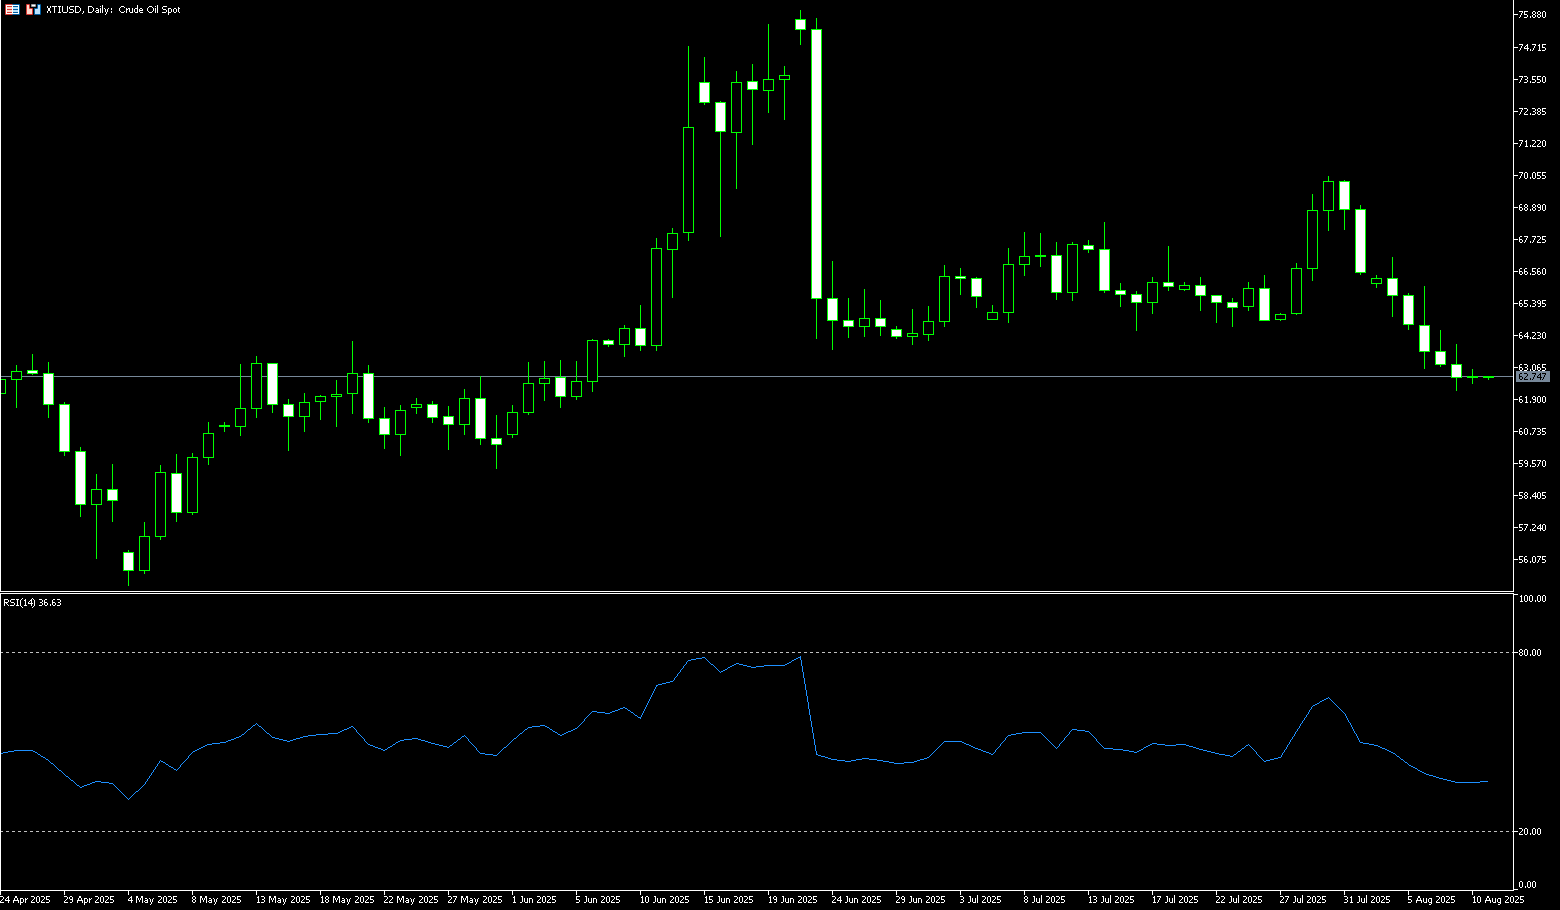
WTI crude oil is currently trading around $63.50 per barrel on Thursday, closing at $63.20 per barrel, marking its fifth consecutive day of decline and a new six-week low. Sources say Trump plans to meet with Putin and Zelensky as early as next week, and Trump announced tariffs of approximately 100% on chips. Trump said on Wednesday that his special envoy, Witkov, made "tremendous progress" in his meeting with Russian President Vladimir Putin. Russia is the world's second-largest crude oil producer after the United States, so any potential agreement to reduce sanctions would make it easier for Russia to export more oil. In addition to uncertainty surrounding tariffs and sanctions, OPEC+'s planned supply increase has also weighed on the market in recent days. Separately, an earlier report showed a larger-than-expected drop in U.S. crude oil inventories last week, providing support for the oil market.
Oil prices hit their lowest level since early June at $63.03 on Tuesday. With key support at $64 broken before reaching $63.00, prices are currently trading slightly below $64.00, but appear to be at a disadvantage. Currently, $63.70 is a price level worth watching, having served as resistance between May and June. A break below this level would bring back $63.03 (Tuesday's low) and $63.00 (round-number mark). Next up is $62.00, a level seen earlier this year, but $60 appears to be a more critical downside target. The 14-day relative strength index (RSI) is below 50, and the moving average convergence divergence (MACD) is negative and has fallen below its signal line, both suggesting that shorting on rallies may be more effective than buying on dips in the short term. Of course, if oil prices fail to break below $63 despite negative news, the market may reverse, targeting the 100-day moving average at $64.59 and the resistance level of $66.03 (Wednesday's high).
Today, consider going long on crude oil at $63.00. Stop-loss: $62.80, target: $64.50, $65.00.
Spot Gold
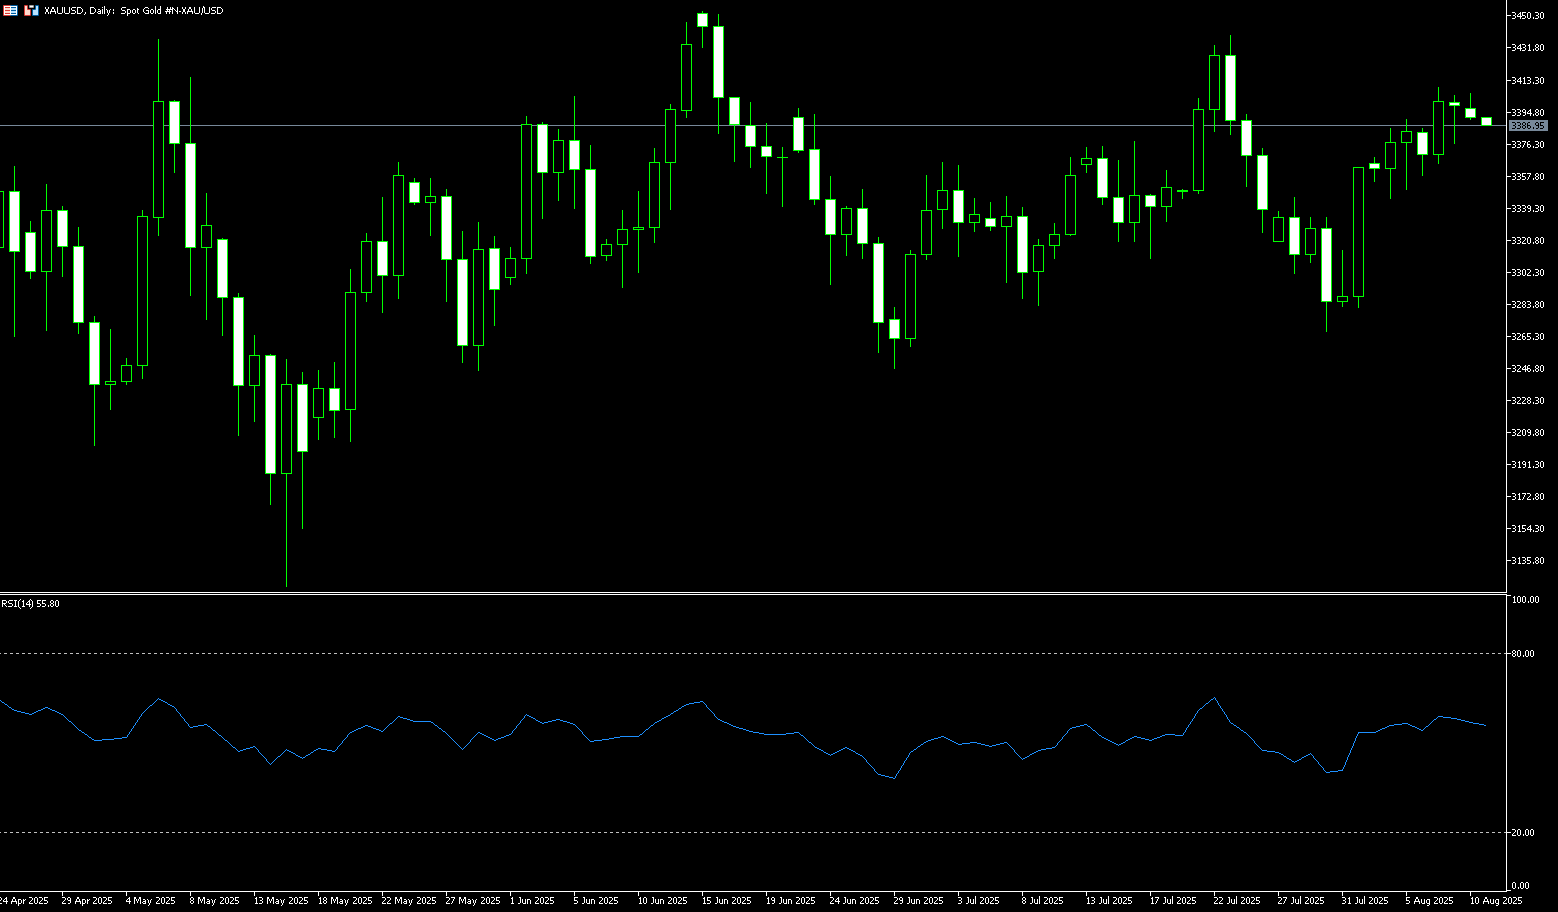
Gold prices traded around $3,395/oz on Thursday, having earlier reached a high of $3,401. Wednesday's decline was driven by profit-taking after hitting a near two-week high the previous day. Market focus shifted to President Trump's upcoming announcement of his nominee for Federal Reserve Chair. Investors viewed this as a correction, and amidst a period of limited economic news, some profit-taking following recent gains and a slight easing of safe-haven demand were seen. Last Friday, weaker-than-expected US job growth data triggered three consecutive days of gains. However, as economic data releases entered a relatively quiet period, safe-haven demand waned, prompting some investors to lock in profits, leading to a short-term correction in gold prices. This type of technical correction is not uncommon in the gold market, especially in the absence of major economic catalysts, when prices often come under pressure due to profit-taking.
The daily chart shows that after the rebound triggered by the non-farm payroll data, gold continued to rise before a slight pullback. The next major resistance levels are around $3,400 (round-number mark) and $3,439 (July 23 high). If gold prices reach these levels, sellers are expected to intervene again near resistance. They have identified above $3,439 as a clear risk point, looking for short positions, targeting pullbacks to $3,300 (psychological level) and $3,255 (110-day simple moving average) support. Buyers, on the other hand, would like to see gold break through this resistance level, increasing their bullish bets and aiming for a new all-time high. The 4-hour chart shows that gold prices have experienced some consolidation in the $3,349 to $3,385 range. Buyers hope to see gold prices break out to extend the rally to key resistance levels, while sellers anticipate a breakout to the downside, leading to increased short positions.
Consider going long on gold at 3,390 today, with a stop-loss at 3,385 and targets at 3,415 and 3,420.
AUD/USD
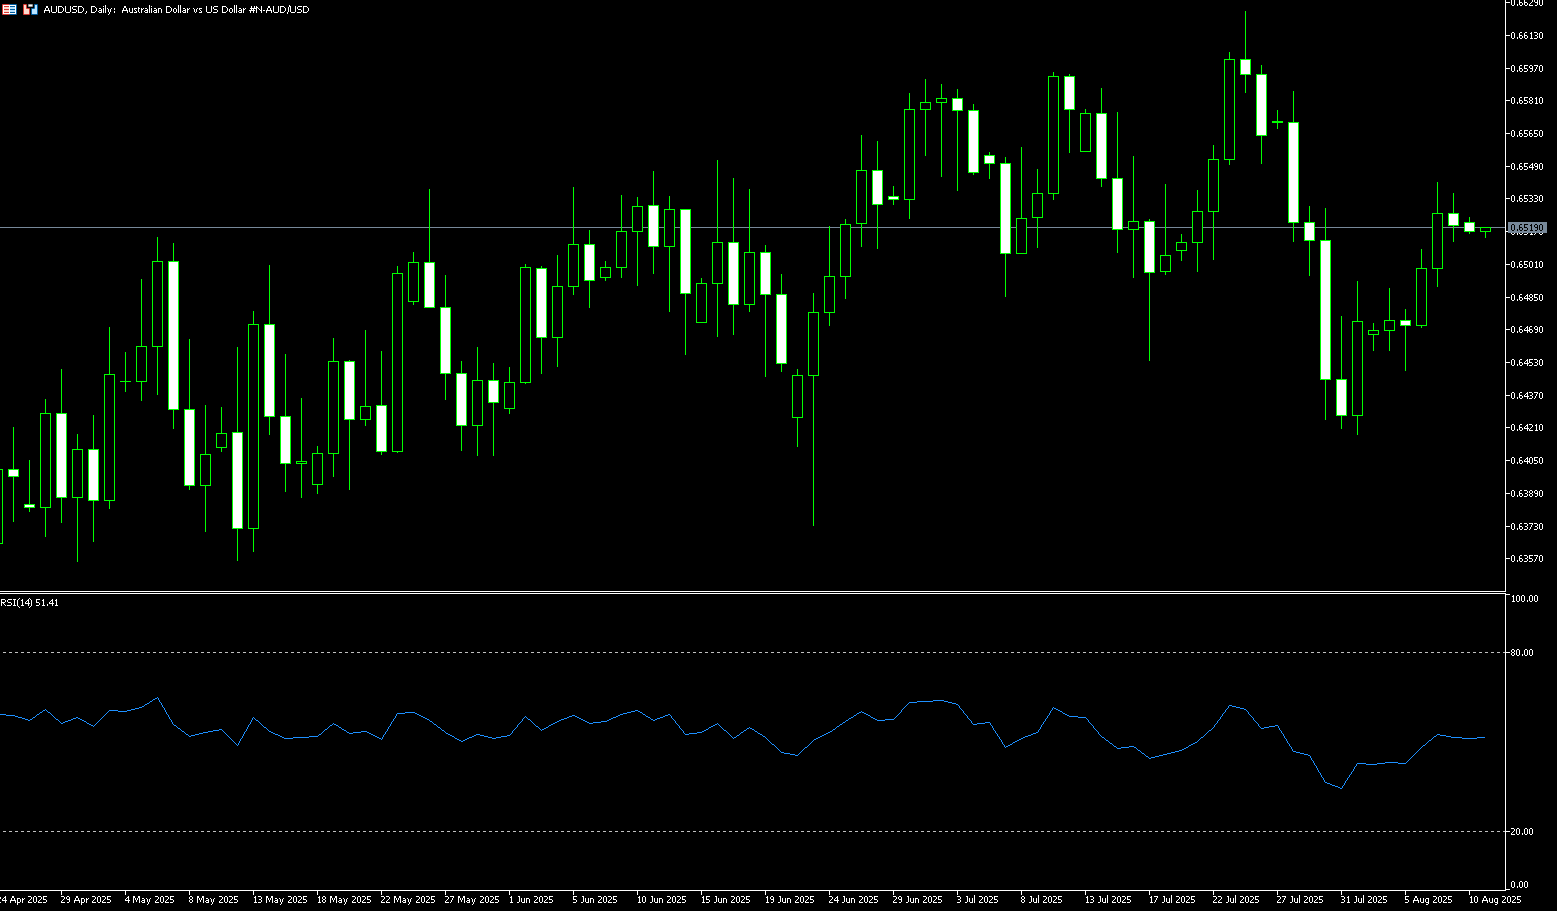
The Australian dollar edged higher against the US dollar on Thursday, following a 0.5% gain in the previous session. AUD/USD gained momentum following the release of trade balance data. The Australian Bureau of Statistics reported that Australia's trade surplus increased month-over-month to $5.365 billion in June, exceeding expectations of $3.250 billion and a previous reading of $1.604 billion. Monthly exports rose 6.0% in June, while imports fell 3.1%. US President Trump warned China, Australia's close trading partner, that he may impose further tariffs, similar to the 25% tariff previously announced against India for its purchases of Russian oil, depending on developments, Reuters reported. The Reserve Bank of Australia is widely expected to cut interest rates by 25 basis points next week, bringing the cash rate to 3.60%.
AUD/USD traded above 0.6520 on Thursday. Technical analysis on the daily chart suggests a bearish bias, with the 14-day relative strength index (RSI) remaining below 50. However, the pair has broken above its nine-day simple moving average at 0.6480, suggesting stronger short-term momentum. On the downside, AUD/USD could test its nine-day simple moving average at 0.6480, aligning with Tuesday's high of 0.6479. A break below these levels could weaken short- and medium-term price momentum and exert downward pressure on the pair, potentially testing the 100-day simple moving average low of 0.6431 and the two-month low of 0.6419 recorded on August 1, followed by the psychological level of 0.6600. On the upside, initial resistance lies at the 34-day simple moving average at 0.6526. A break above these levels could strengthen short- and medium-term price momentum and support the pair's move towards 0.6576 (the 76.4% Fibonacci retracement level from 0.6625 to 0.6420), as well as the 6600 level.
Consider a long AUD at 0.6510 today, with a stop-loss at 0.6500 and targets at 0.6560 and 0.6550.
GBP/USD
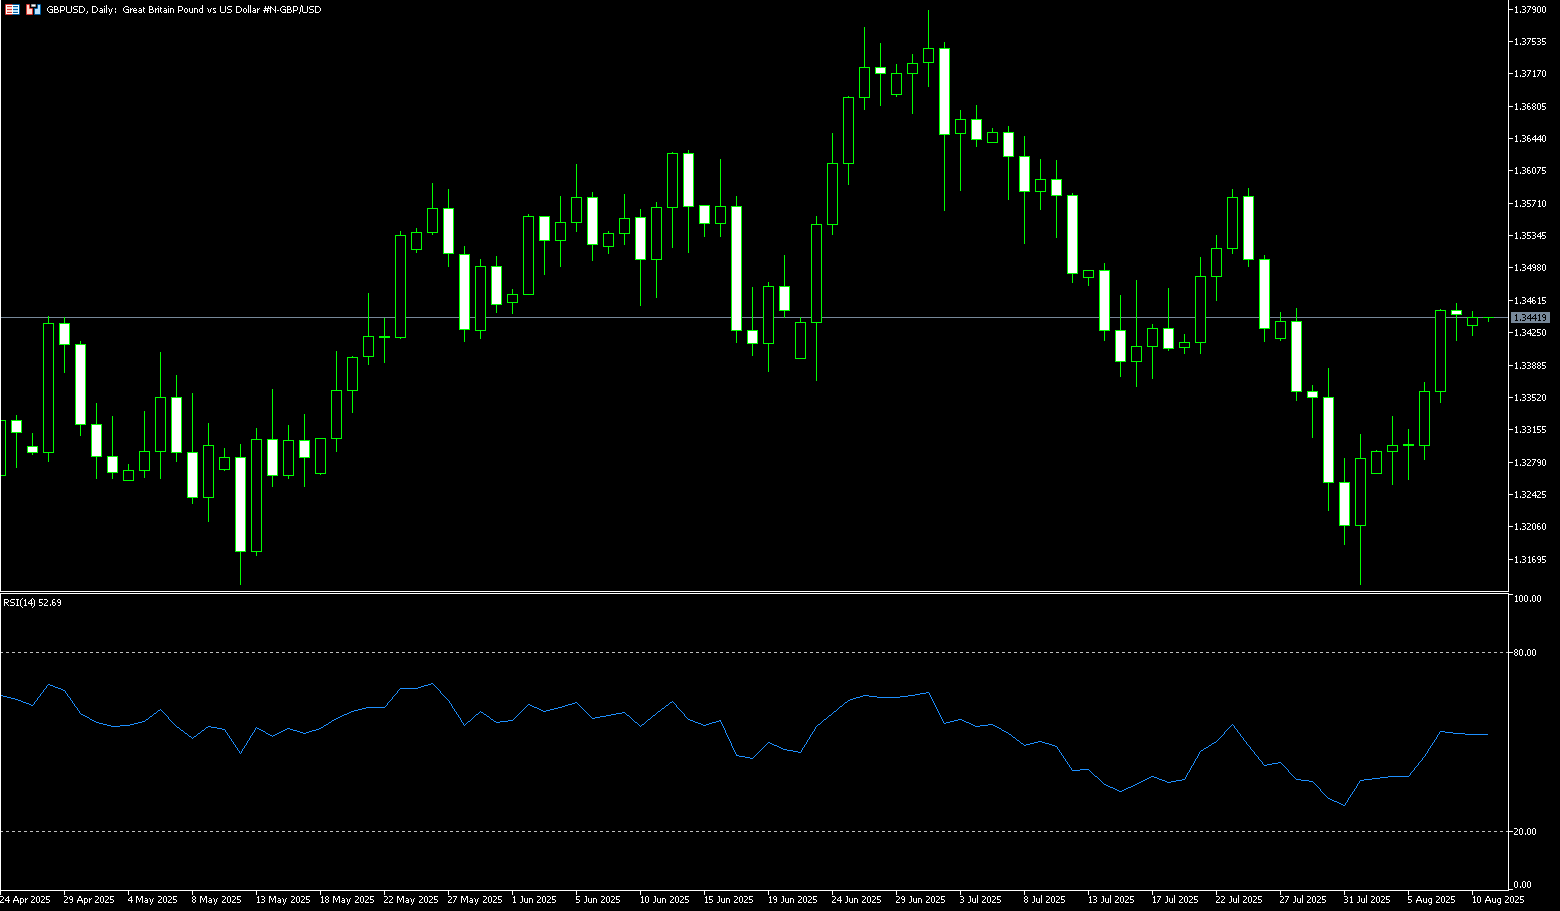
The British pound rose to around $1.3450, its highest level in about two weeks, as traders reacted to the Bank of England's latest monetary policy decision. The central bank implemented a widely expected 25 basis point interest rate cut, lowering the key bank rate to 4%, the lowest level since 2023. However, the decision revealed deep divisions, with the cut approved by a narrow 5-4 majority, compared to a three-way split in the previous vote. This marks the first time a second round of voting was required for a final decision. Governor Bailey added that "interest rates remain on a downward trajectory, but any future cuts will need to be gradual and cautious." The central bank also raised its inflation forecast for September from 3.7% to 4%. In response, traders have scaled back expectations for further rate cuts this year. The market now anticipates only 17 basis points of additional easing in 2025, compared to expectations of another 25 basis points before the announcement.
GBP/USD received a much-needed boost last Wednesday, reclaiming the 1.3400 level as bullish momentum returned after a one-sided decline last week to a 15-week low of 1.3142 and the 142-day simple moving average of 1.3145. GBP/USD has risen in three of the past four trading sessions, rebounding nearly 2.0% from the 142-day simple moving average of 1.3145. With technical support at the 1.3142-1.3145 level confirmed, GBP/USD bulls are poised to continue pushing the pair back towards the 1.3500 level and the 1.3504 50-day simple moving average. A break below this level would target the 1.3550 level.
Consider a long position on the British pound at 1.3432 today, with a stop-loss at 1.3420 and a target of 1.3495 or 1.3500.
USD/JPY
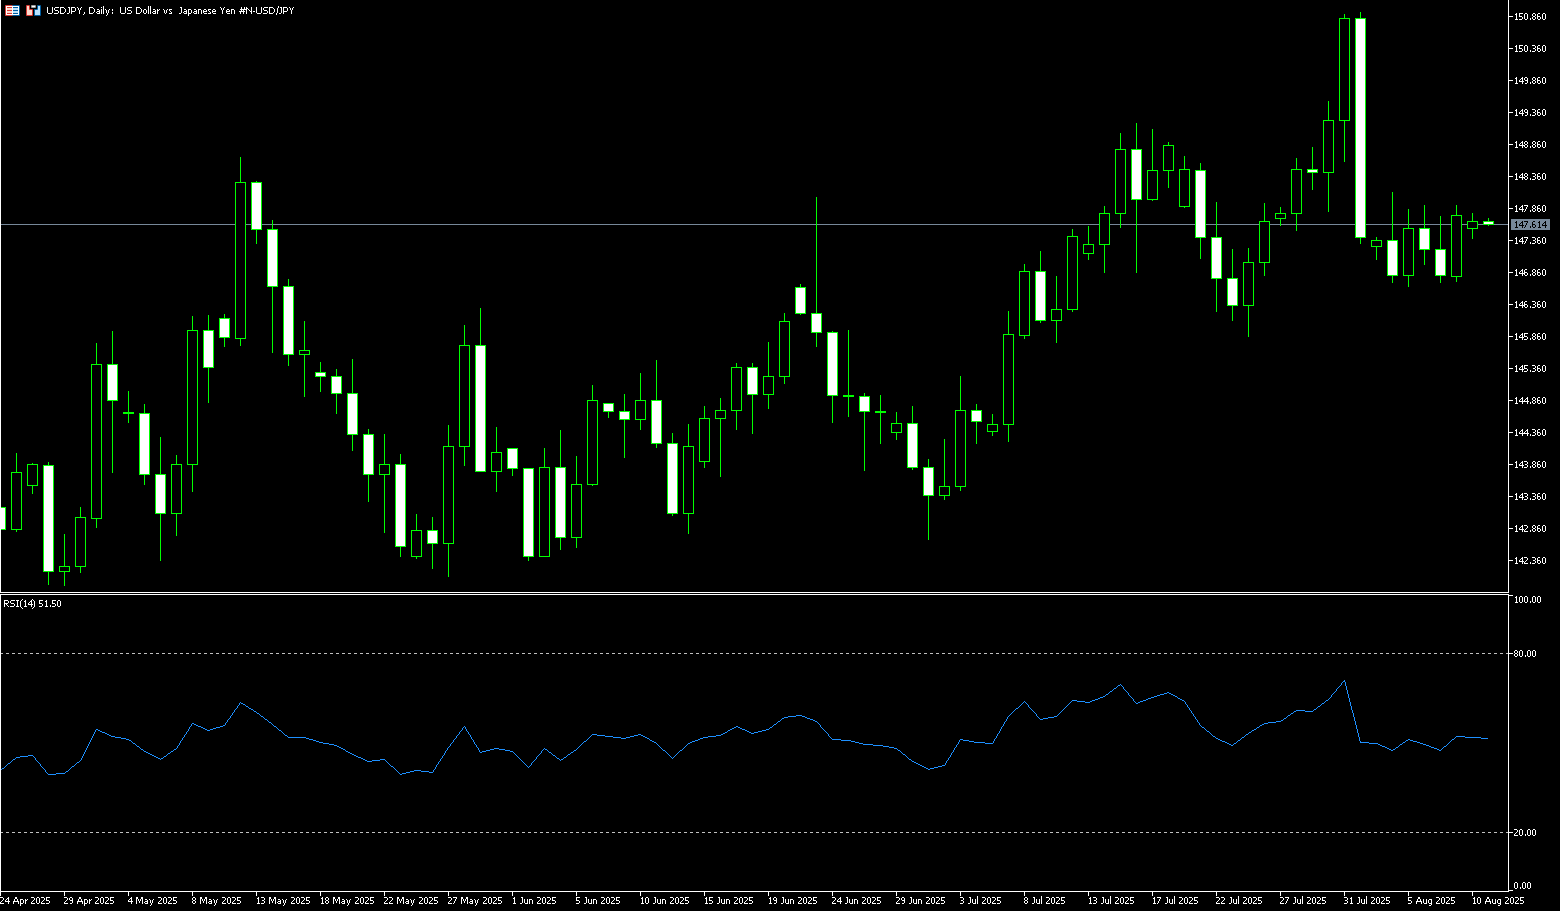
The yen held steady at around 147.30 per dollar on Thursday, trading sideways this week as investors weighed the Bank of Japan's monetary policy stance. Last week, the Bank of Japan kept interest rates unchanged but raised its inflation forecast, while warning of growing downside risks from global trade tensions. The minutes of the June policy meeting showed that officials remain willing to tighten policy further, especially if external risks ease. Furthermore, Ministry of Finance officials emphasized the need for policy flexibility, particularly with bond purchases, to maintain market stability. On the data front, real wages in Japan fell for the sixth consecutive month, and inflation continued to outpace income growth, complicating further policy tightening.
From a technical perspective, this week's rebound from the 134-day simple moving average, around 146.84, favors USD/JPY bulls. However, the oscillators on the aforementioned charts have yet to confirm the positive outlook. Furthermore, the spot price has so far struggled to break above the 38.2% Fibonacci retracement level of the July low. The pair could potentially break above the 148.00 round-figure mark and climb towards the 148.45-148.50 area. Momentum could extend further towards the 149.00 level. On the other hand, the American session low around the 146.69 area, followed by the 147.00 level, could provide immediate support for USD/JPY. This is followed by the 146.50 confluence, which, if decisively broken, could pave the way for a deeper decline. The spot price could accelerate its decline, testing the psychologically important 146.00 level below.
Consider shorting the US dollar at 147.35 today. Stop-loss: 147.55. Target: 146.50, 146.30.
EUR/USD
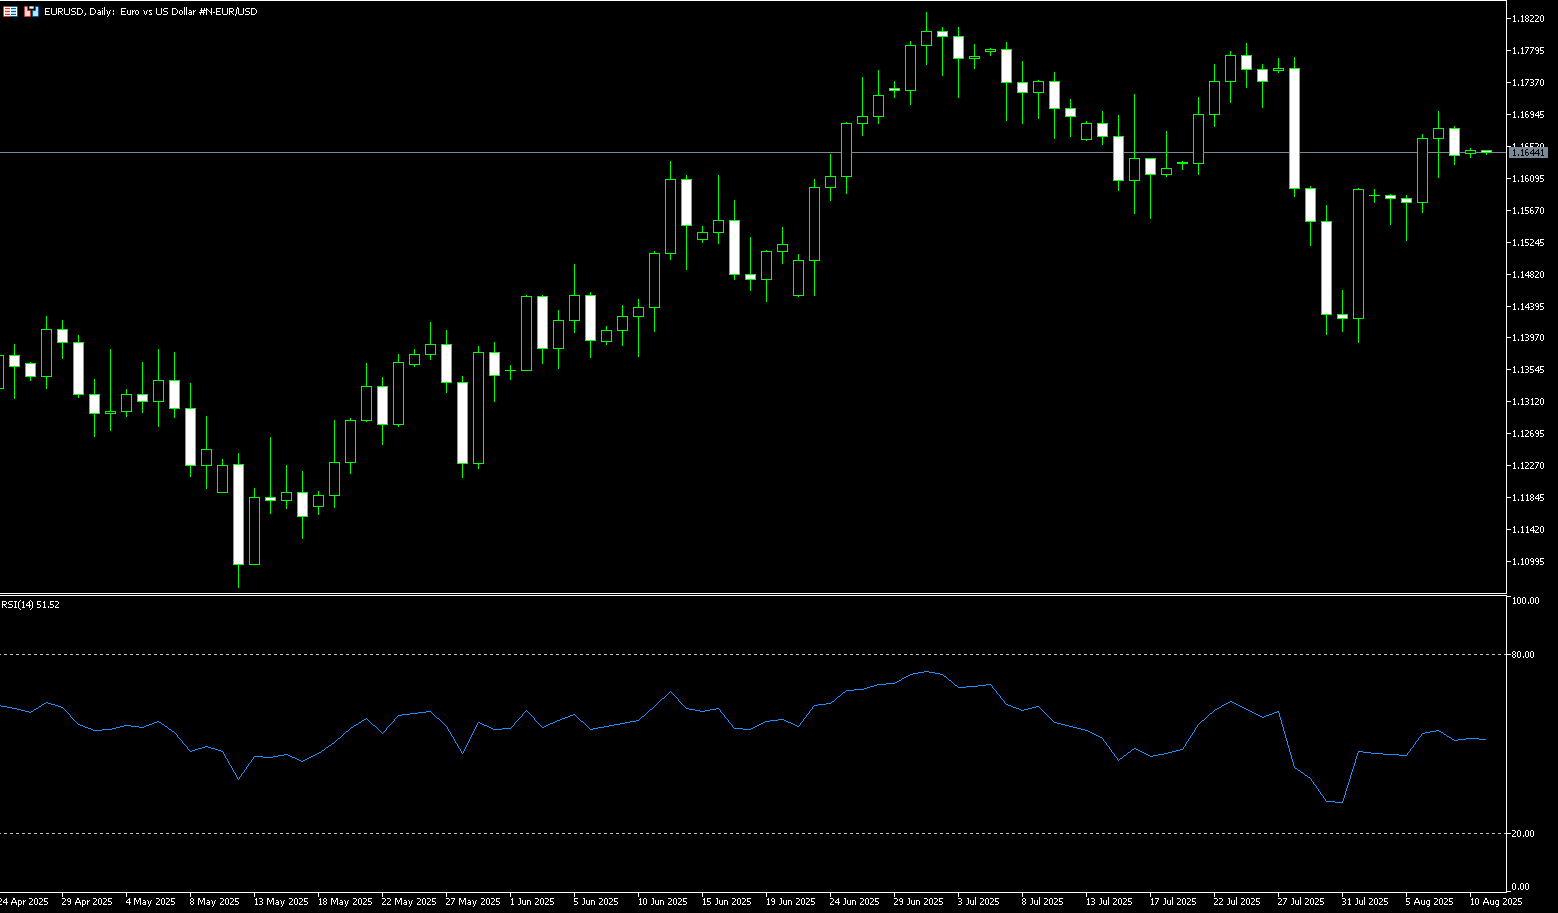
During Thursday's Asian trading session, EUR/USD edged up around 1.1665, supported by a weaker US dollar. Potential upside for the dollar may be limited by rising expectations of a Federal Reserve rate cut and concerns about the independence of the US central bank. Fed fund futures traders increased their bets on a rate cut after Friday's data showed weaker-than-expected US job growth in July. The probability of a 25 basis point cut at the September meeting is 94%. Across the Atlantic, German factory orders slowed in June, while eurozone retail sales improved in the 12 months ending in June. Traders will closely monitor the progress of the Federal Reserve Board replacement. Trump said on Tuesday that he would also soon announce his nominee for the next Fed Chair.
During the trading session, EUR/USD broke through the psychologically critical resistance of 1.1600 and subsequently decisively broke through the 20-day simple moving average of 1.1626. Although the pair exhibits a neutral bias, the 14-day Relative Strength Index (RSI) on the daily chart suggests that buyers are gathering momentum. However, the pair needs to break through the 1.1700 round-figure mark to challenge the July 24 peak of 1.1788. Conversely, a break below 1.1600 and the 50-day simple moving average of 1.1599 would expose this week's low of 1.1528, potentially leading to a move towards the crucial 1.1500 level.
Consider a long EUR at 1.1645 today, with a stop-loss at 1.1630 and a target of 1.1695 or 1.1700.
Disclaimer: The information contained herein (1) is proprietary to BCR and/or its content providers; (2) may not be copied or distributed; (3) is not warranted to be accurate, complete or timely; and, (4) does not constitute advice or a recommendation by BCR or its content providers in respect of the investment in financial instruments. Neither BCR or its content providers are responsible for any damages or losses arising from any use of this information. Past performance is no guarantee of future results.
Lebih Liputan


Pendedahan Risiko:Instrumen derivatif diniagakan di luar bursa dengan margin, yang bermakna ia membawa tahap risiko yang tinggi dan terdapat kemungkinan anda boleh kehilangan seluruh pelaburan anda. Produk-produk ini tidak sesuai untuk semua pelabur. Pastikan anda memahami sepenuhnya risiko dan pertimbangkan dengan teliti keadaan kewangan dan pengalaman dagangan anda sebelum berdagang. Cari nasihat kewangan bebas jika perlu sebelum membuka akaun dengan BCR.

 English
 简体中文
简体中文
 繁體中文
繁體中文
 Bahasa
Melayu
Bahasa
Melayu
 Tiếng
Việt
Tiếng
Việt
 ไทย
ไทย
 日本語
日本語
 한국어
한국어
 ភាសាខ្មែរ
 español