0
The US Dollar Index
The US dollar index traded within a narrow range around 98 last week as renewed tensions between the US and Iran over the Strait of Hormuz kept geopolitical risks high. Three US Navy destroyers reportedly intercepted an Iranian attack and retaliated, despite President Donald Trump stating the ceasefire remained in effect. The Trump administration is awaiting Iran's response to proposals aimed at reopening the Strait of Hormuz and ending nearly 10 weeks of conflict, with reports suggesting Tehran is expected to respond via Pakistan within the next two days.
Meanwhile, stronger US data and hawkish comments from the Federal Reserve pushed up Treasury yields and supported the dollar index. Inflation expectations and jobless claims both exceeded expectations, while Fed officials indicated interest rates could remain high for an extended period, and even rise if the disruption in the Strait of Hormuz continues. In addition to geopolitical headlines, a batch of hawkish US data was also seen, with labor market and inflation figures both exceeding expectations. For example, the latest survey by the New York Fed showed that one-year inflation expectations rose to 3.64% in April (compared to an expected 3.5%), the highest level since September 2023. This boosted market expectations for a more hawkish response from the Fed. Furthermore, strong labor market data also played a role, with initial jobless claims for the week ending May 2nd at 200,000 (compared to an expected 205,000), bringing the four-week moving average down to a two-year low of 2,032,500.
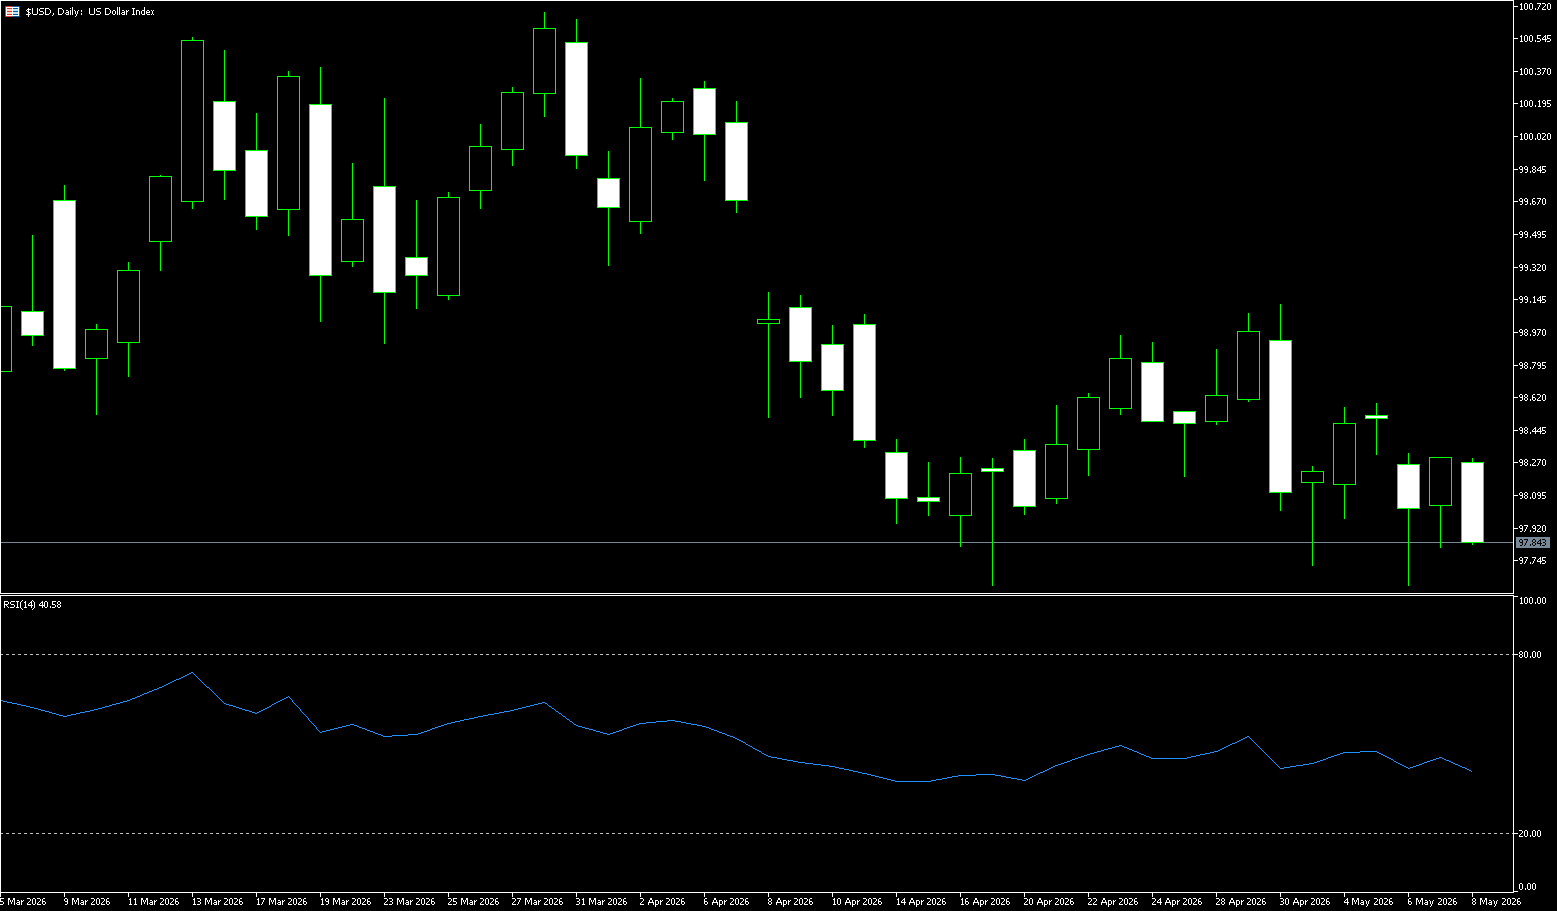
Last week, the US dollar index fluctuated at high levels, initially declining before rising, generally fluctuating between 97.72 and 99.00. Technically, it is in a weak consolidation phase with compressed volatility. Long upper and lower shadows appeared multiple times during the week, indicating intense tug-of-war between bulls and bears, lacking a clear trend. The US dollar index technically showed a weak and volatile trend last week, forming a bottom and awaiting a breakout. 98.00 is the short-term equilibrium level between bulls and bears. The daily chart shows the US dollar index below the 20-day moving average at 98.36, with short-term moving averages in a bearish alignment, indicating overall weakness. The Bollinger Bands are converging, and volatility is compressing, suggesting an impending breakout. Currently, it is repeatedly stabilizing around 98.00, showing signs of low-level consolidation and bottoming. The MACD has formed a golden cross at a low level and continues to rise, but the red bars are gradually shortening, indicating a weakening of short-term rebound momentum. Meanwhile, the RSI indicator has risen to around 40, but market sentiment remains weak.
From the daily chart, the US dollar index has recently maintained a low-level consolidation and repair structure. Previously, the index formed a "double bottom" around 97.62 (June 5th) - 97.63 (April 17th) and found significant support before a technical rebound. However, strong resistance remains in the area around 99.09 (April 30th high) to 99.03 (50-day moving average). From a technical perspective, observing the moving average system, the 5-day and 10-day moving averages are gradually flattening, while the 20-day moving average is around 98.35, forming a key short-term resistance area. If the US dollar index can rebound and stabilize above the 200-day moving average of 98.53 and above 98.58 (last week's high), it may further test the 99.09 (April 30 high) to 99.03 (50-day moving average) area; however, if the US dollar index falls back instead of rising, it may fall back to the 97.62-97.63 area to form a "double bottom," or even near the 97.00 psychological level.
Today, consider shorting the US dollar index at 97.98, with a stop loss at 98.10 and targets at 97.60 and 97.50.
WTI Crude Oil
The international crude oil market experienced a high-level correction, with WTI crude oil prices slightly declining after previous consecutive gains. Previously, the situation in the Middle East had driven oil prices up rapidly, but as the market received signals of easing tensions from Israel and Iran, some funds began to take profits, causing short-term pressure on oil prices. This week, the core focus of the international energy market remains on the escalating geopolitical risks between the United States and Iran. The Strait of Hormuz handles approximately 20% of global seaborne crude oil transport and connects several major oil-producing countries in the Persian Gulf, making it one of the world's most critical energy transport routes. The market generally believes that any sustained military conflict or shipping disruptions in the region could severely impact the global crude oil supply chain. Therefore, even with the current temporary easing of tensions, international oil prices are generally expected to remain high.
Furthermore, the Trump administration is currently awaiting a response from Iran regarding its proposal to reopen the Strait of Hormuz. It is understood that Iran may convey its formal position through Pakistan within the next two days. Market analysts believe that if the two sides can resume limited diplomatic communication, oil prices may see further correction in the short term; however, if negotiations fail or the situation in the Strait deteriorates again, it could reignite risk-taking in the crude oil market. Current market sentiment is generally cautiously optimistic. On the one hand, investors hope the situation in the Middle East can avoid further escalation; on the other hand, energy supply risks remain a real concern. With global crude oil inventories generally low, OPEC+ maintaining production cuts, and rising transportation risks, volatility in the international crude oil market is expected to remain high.
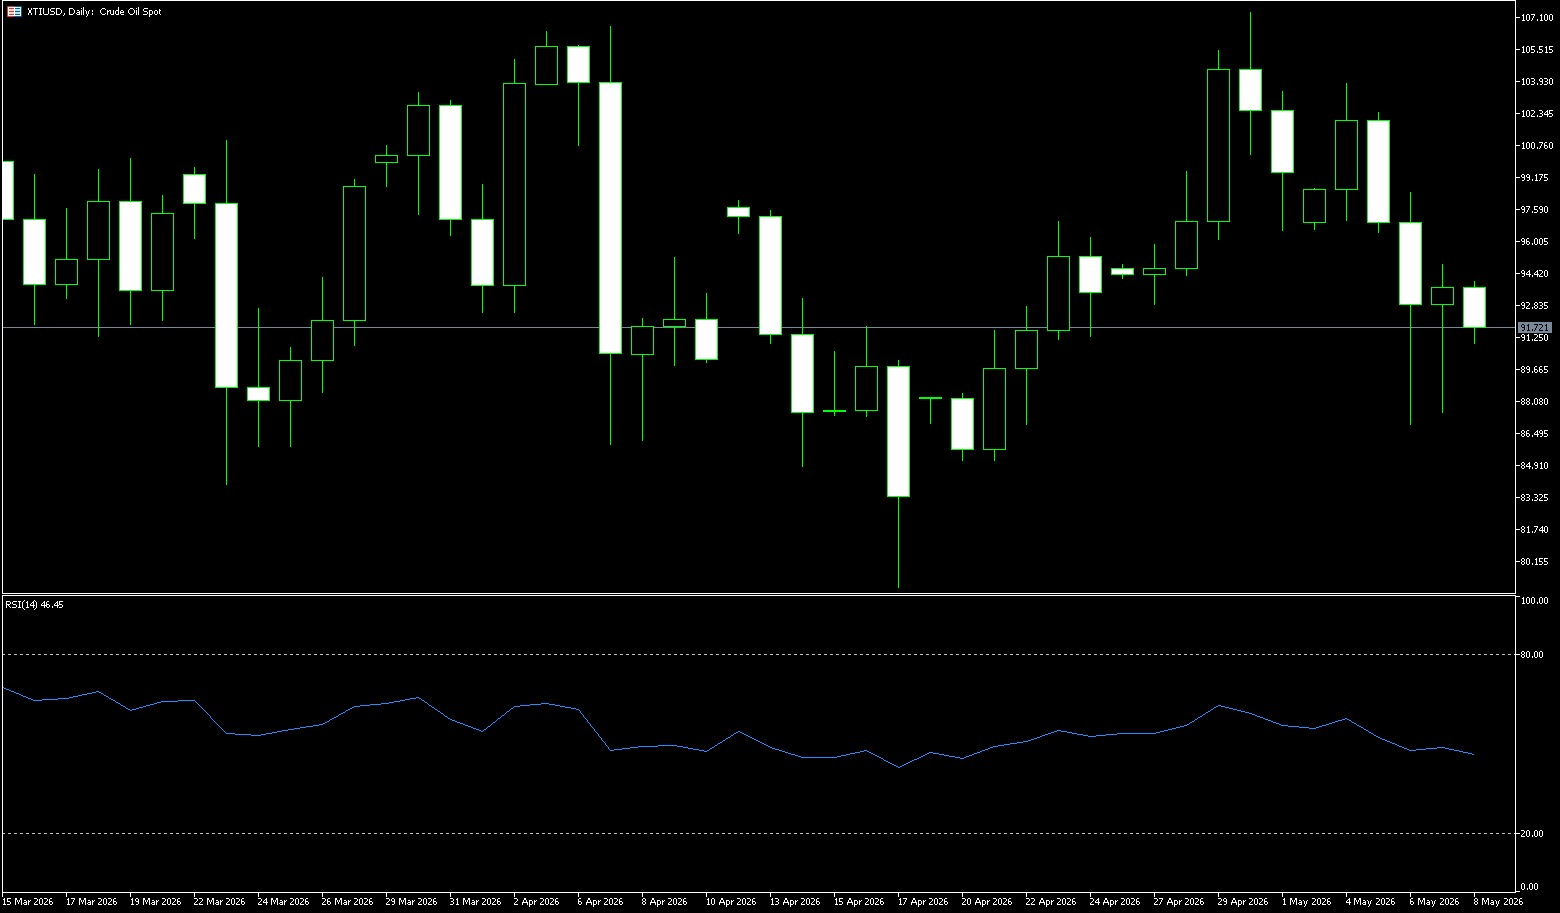
Last week, WTI crude oil exhibited typical characteristics of "news-driven + high-level consolidation": a sharp drop on Monday and Tuesday due to easing geopolitical tensions, followed by a rebound and high-level consolidation on Wednesday and Thursday, indicating a deep correction within a medium-term uptrend, with significantly increased volatility. The medium-term bullish structure remains intact, and the correction is a technical adjustment. The short-term trend is a downward turn from the highs, breaking below the key psychological level of $100 again, entering a correction cycle; $90 is the short-term dividing line between bulls and bears, and a breach of this level would deepen the correction to even lower levels. The medium-term trend, however, remains within an unbroken upward channel, with oil prices still above the 89-day moving average of $78.93, and the medium-to-long-term bullish structure is intact.
From a technical perspective, the daily chart for WTI crude oil still maintains a medium-to-long-term bullish pattern. Oil prices had previously broken through the key resistance zone of $100 and approached the high of $107.35 on April 30, indicating that market risk premium is still dominating short-term trends. The current daily moving average system continues to diverge upwards, and the MACD indicator is in a golden cross below the zero axis with the green bars shortening, indicating that the short-term rebound momentum is strengthening, but a trend reversal has not yet formed. The RSI (14) is around 47.09, indicating that the bullish and bearish forces are in equilibrium and there is no obvious oversold signal. This indicates that the medium-to-long-term upward trend of the market has not been broken. Since geopolitical risks have not been completely eliminated, the bearish forces in the market are still relatively limited. If the situation in the Strait of Hormuz becomes tense again, oil prices may attract safe-haven funds to flow in again; if oil prices can stand above $90, they may further test the $96.39 {5-day simple moving average} to $100 {market psychological level} area; the important support below is at $90 {integer level}. A break below this level would target $86.81 (last Wednesday's low) and the $85.66 (65-day simple moving average) area.
Consider going long on crude oil today at $91.60, with a stop loss at $91.40 and targets at $93.00 and $94.00.
Spot Gold
Gold rose to over $4,760 per ounce last week after experiencing significant volatility, despite renewed tensions between the US and Iran that dampened hopes for a near-term peace agreement and reignited inflation concerns. US Central Command stated that the US military intercepted an Iranian attack and conducted a defensive strike, while missile destroyers sailed in the Strait of Hormuz, emphasizing that the military was not seeking further escalation. Meanwhile, the Trump administration awaits Iran's response to proposals aimed at reopening the Strait of Hormuz and ending nearly 10 weeks of conflict, with reports suggesting Tehran is expected to respond via Pakistan within the next two days. Despite this, gold prices have fallen by more than 10% since the start of the conflict. The effective closure of the Strait of Hormuz triggered a historic surge in energy prices, fueling inflation concerns and reinforcing market expectations that central banks may need to raise interest rates.
While markets are preoccupied with short-term geopolitical and monetary policy factors, a long-term positive factor cannot be ignored. Data shows that the People's Bank of China increased its gold reserves for the eighteenth consecutive month in April. This sustained and firm buying reflects the long-term bullish outlook of major central banks globally on the asset allocation value of gold. Although this news did not dominate the sharp fluctuations in gold prices that day, it provided solid underlying support for gold. Against the backdrop of the "de-dollarization" trend and the diversification of foreign exchange reserves, continued buying from official sectors will be the cornerstone of a long-term bull market for gold.
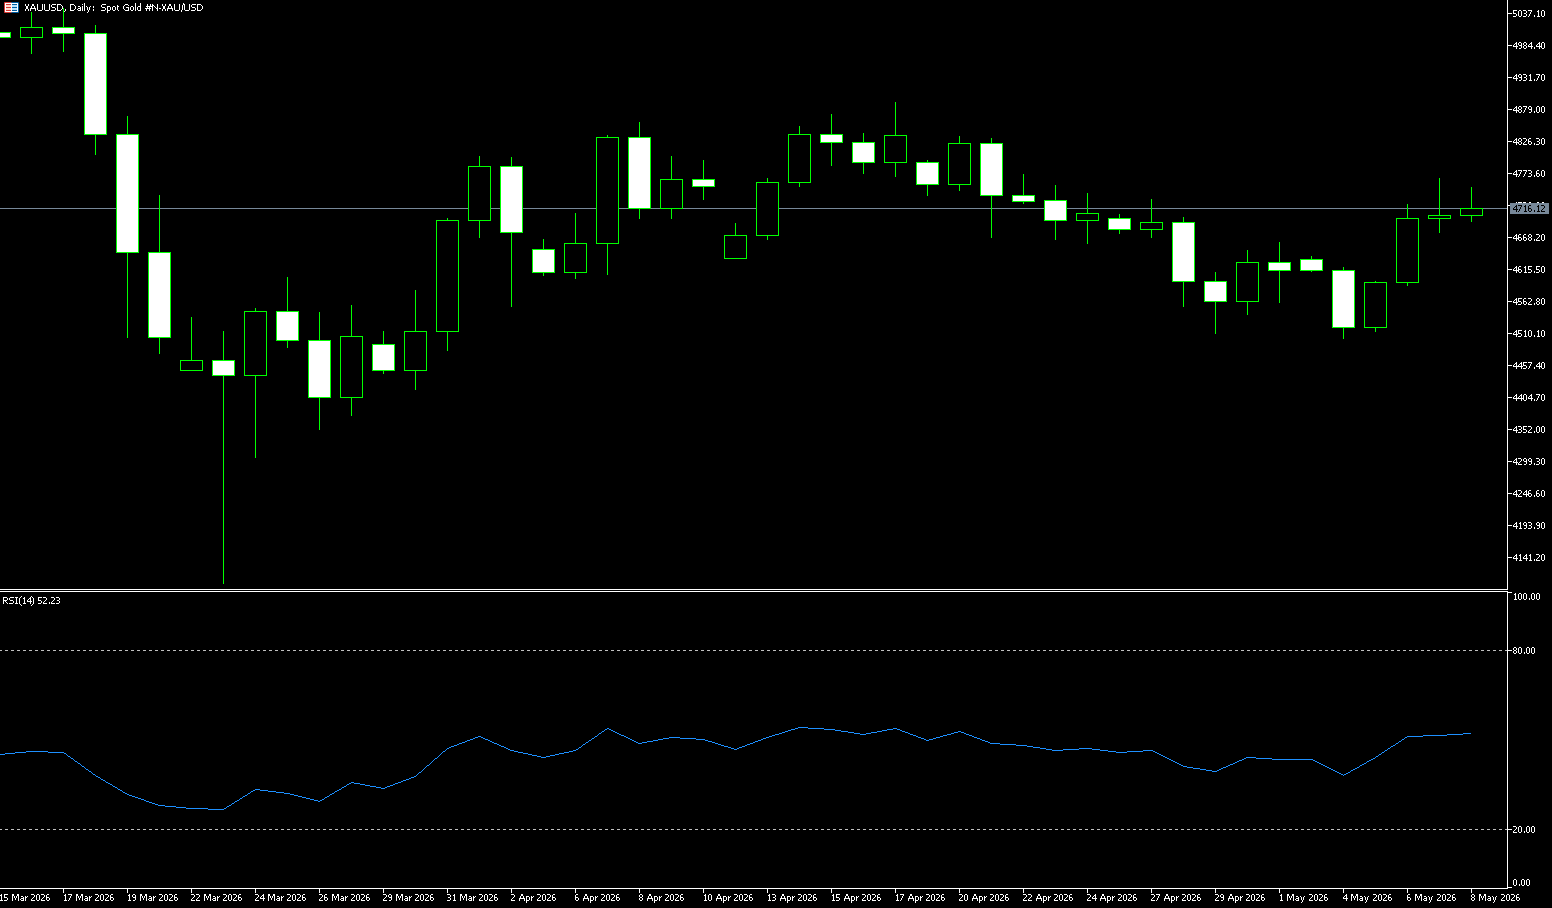
Last week, spot gold exhibited a deep V-shaped reversal pattern, initially declining before rebounding and then falling back on Thursday. Currently, the fundamentals for gold are mixed, with key influencing variables concentrated in four dimensions: the US-Iran geopolitical situation, the Federal Reserve's policy direction, fluctuations in US Treasury yields, and global central bank activities. At the beginning of the week, gold prices dipped to around $4,500/ounce and stabilized. On Wednesday and Thursday, they rebounded strongly to around $4,765 before encountering resistance, and then entered a period of high-level consolidation before the weekend, shifting from a one-sided rebound to range-bound trading. At the beginning of the week, gold prices formed a double bottom reversal (around $4,500), closing positive for two consecutive days. However, before the weekend, prices surged and then fell back, closing with an inverted hammer candlestick, indicating heavy selling pressure and a slowdown in bullish momentum. In terms of moving averages, the 5-day and 10-day moving averages have turned upwards, forming a golden cross; the 20-day moving average is holding the bullish trend line. Technical indicators show that the RSI has fallen from overbought territory, and the MACD histogram is shrinking, forming a bearish divergence signal, indicating a short-term correction phase.
From a short-term perspective, since gold entered a range-bound trading pattern from April 17th to April 19th, 2026, the overall tone has been bearish. The key short-term resistance level is between the 100-day moving average (4,778) and the 50-day moving average (4,780.20). Whether this level is broken or not will directly determine whether the short-term bearish trend can continue. The next resistance level points to the 4,890-4,900 USD/ounce range, which corresponds to the previous high from April 15th to April 17th and is a significant resistance area for any short-term rebound. The bullish overall trend remains unchanged, supported by global central bank gold purchases, geopolitical risks, and stagflation expectations. There is still room for upward movement after any correction. The current support levels for gold are mainly concentrated in the $4,614 (9-day moving average) - $4,600 (psychological level) support zone. If gold closes below this support zone, it will test the next important support levels at $4,509 (lower Bollinger Band) and $4,500 (last week's low), potentially triggering a reassessment of the current upward trend.
Today, consider going long on gold at $4,710, with a stop loss at $4,704 and targets at $4,750 and $4,760.
AUD/USD
The Australian dollar remained above US$0.72 last week, reaching a four-year high of $0.7277. Renewed tensions in the Middle East before the weekend dampened its weekly gains. The currency only saw a modest gain of 0.40% this week as escalating conflict between the US and Iran diminished hopes for a near-term peace agreement, increasing demand for the safe-haven US dollar. The latest escalation comes as the US attempts to end a three-month-long conflict while awaiting Iran's response to its proposal to reopen the Strait of Hormuz, a vital waterway for energy flows. The near closure of the strait and the ensuing energy price shock have raised concerns about rising inflation, potentially leading to a prolonged period of higher interest rates.
However, the Australian dollar continues to receive some support from the Reserve Bank of Australia's (RBA) hawkish stance. In fact, the central bank stated earlier last week that inflation remains too high and did not rule out further policy tightening. In contrast, recent declines in oil prices have lowered investors' expectations for a 2026 rate hike by the US Federal Reserve. This divergence in policy outlook between the RBA and the Fed has limited a significant appreciation of the US dollar and serves as a reminder to investors to exercise caution when shorting the AUD/USD. In Australia, the market now estimates only a 20% chance of another RBA rate hike in June, following a 75 basis point increase to 4.35% over the past three meetings. By August, this probability had risen to approximately 68%, and by September, a terminal rate of nearly 4.6% was almost entirely priced in by the market.
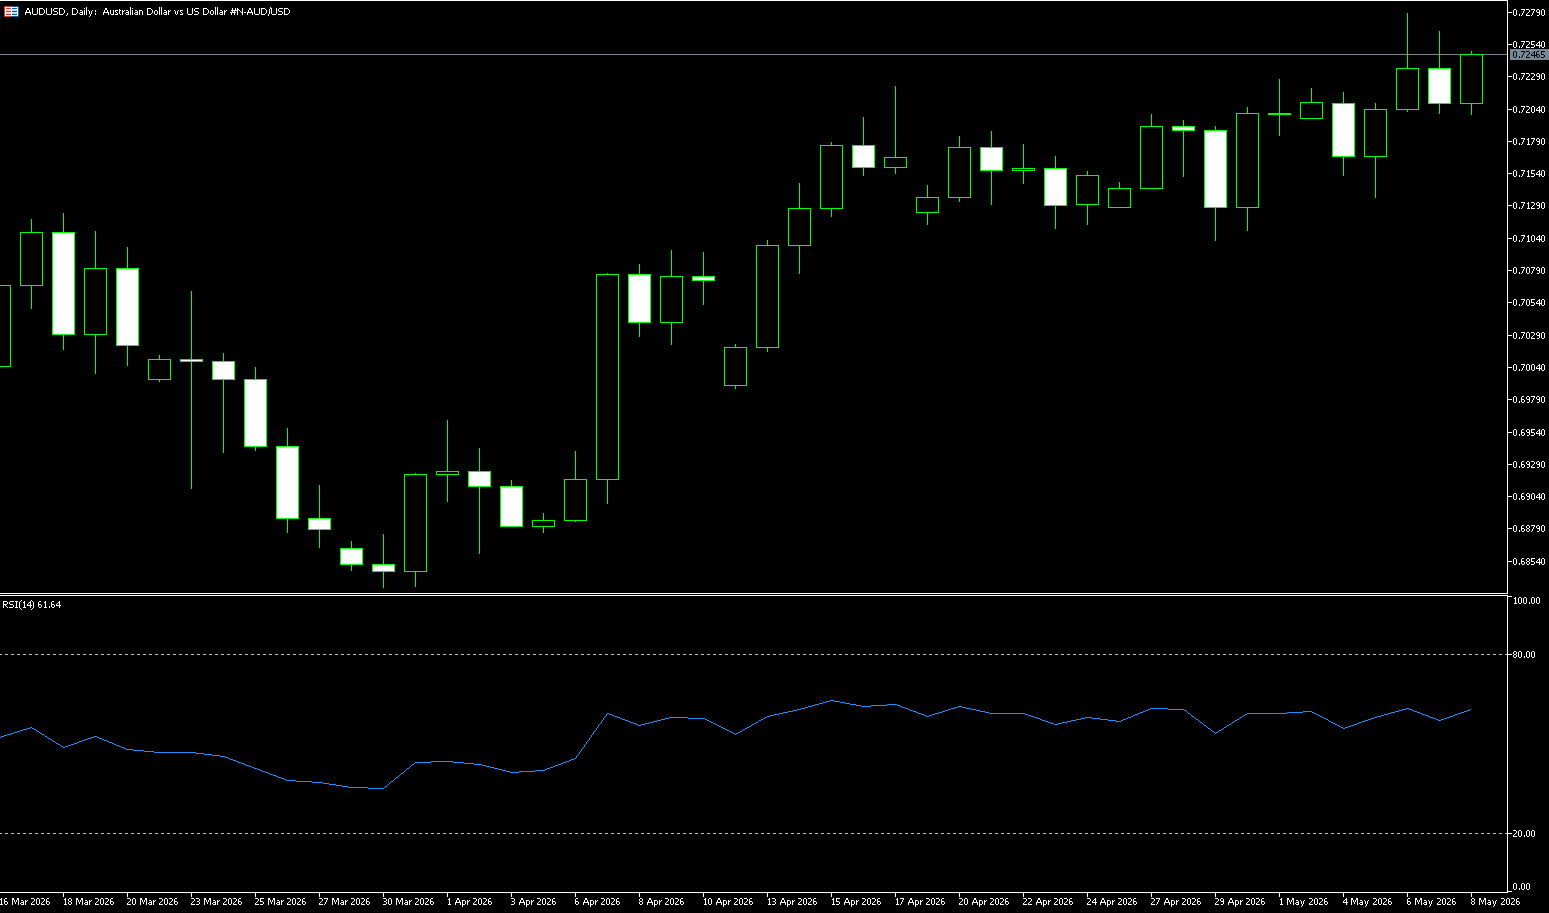
Last week, the Australian dollar traded against the US dollar with a slightly bullish bias, moving slowly at high levels, generally within the 0.7180-0.7280 range, near its highest level in nearly four years. From a technical perspective, after breaking through 0.7200, an upward channel formed, with gradually rising highs and lows, indicating a complete bullish trend. Pullbacks were limited, and the bulls maintained control. The Australian dollar is currently trading above its 5/10/55/100/200-day moving averages, with short-term moving averages in a bullish alignment and medium- to long-term moving averages forming a strong support zone. The 14-day Relative Strength Index (RSI) is around 60, supporting constructive momentum, but has not yet entered overbought territory, suggesting that buying pressure is solid but not excessively strong. The MACD continues its golden cross above the zero line on the daily chart, with the red bars showing a moderate increase in volume, indicating stable upward momentum; however, there is short-term downward pressure. The ADX value is relatively low, suggesting moderate trend strength and a high probability of high-level consolidation rather than a one-sided accelerated market.
Technical analysis of the AUD/USD daily chart shows the pair moving upwards within an ascending channel, indicating continued bullish bias. AUD/USD maintains a clear bullish bias, with the spot price holding above the 9-day (0.7193) and 50-day (0.7073) simple moving averages, suggesting the pair remains in an uptrend after recent gains. AUD/USD could rebound to 0.7277, the highest level since June 2022, which was reached on May 6th. A sustained break above this level would support the pair targeting the upper trendline of the ascending channel, around 0.7430. On the downside, initial support lies at the 9-day simple moving average at 0.7193, followed by last week's low at around 0.7136. Further declines would target the psychological level of 0.7100. A break below the medium-term moving averages would trigger a bearish move and put downward pressure on AUD/USD, potentially testing the area near the 50-day (0.7073) simple moving average.
Consider going long on the Australian dollar at 0.7233 today, with a stop loss at 0.7220 and targets at 0.7280 and 0.7290.
GBP/USD
The pound rose to $1.3635, near its highest level in two months, as investors assessed the impact of the UK local and decentral government elections and growing instability in the Middle East. Preliminary election results showed Nigel Farage's Reform Britain party gaining support in local councils in England, while Prime Minister Keir Starmer's Labour Party lost nearly half of its seats, although the decline was smaller than some had feared. The Conservatives also suffered significant losses, relinquishing more than a quarter of their seats, while the Greens nearly doubled their number, and the Liberal Democrats also made progress. Meanwhile, escalating geopolitical tensions, with Washington and Tehran clashing in southern Iran, pushed Brent crude prices back up to $100 a barrel.
At the same time, optimism about a potential peace deal between the US and Iran eased concerns that persistent inflation could keep interest rates high. This followed President Trump's insistence that the ceasefire remained "effective" despite the recent clashes. Financial markets continue to anticipate two interest rate hikes by the Bank of England before the end of the year. With US President Donald Trump confirming that the ceasefire agreement with Iran remains in effect despite clashes near the Strait of Hormuz, the attractiveness of risk-sensitive assets has been restored.
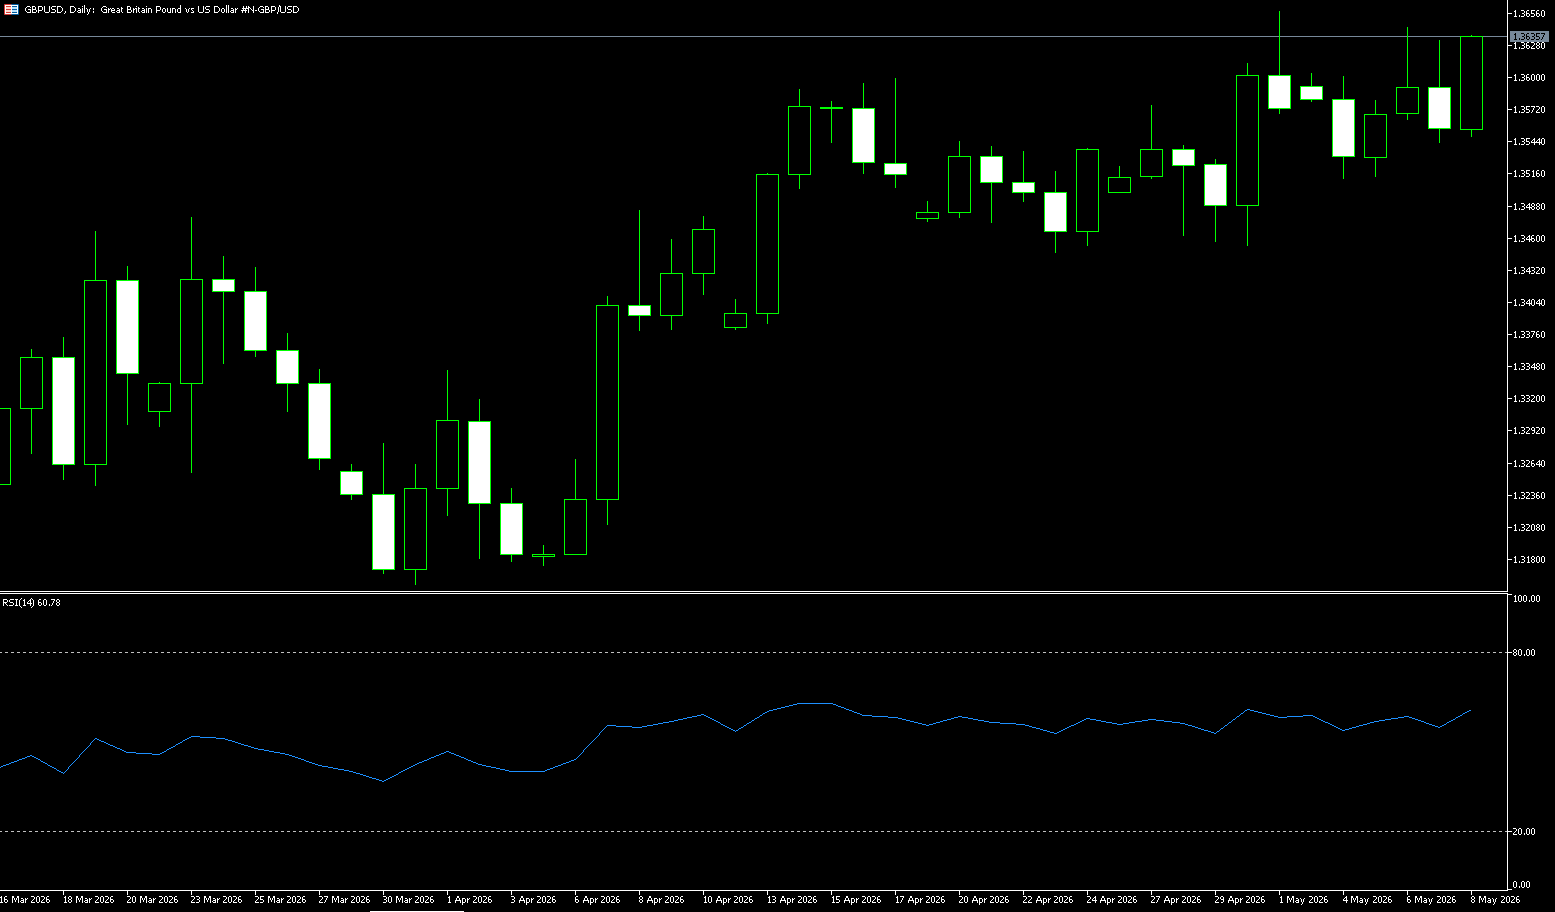
Last week, the British pound traded against the US dollar with a slightly bullish bias, generally moving within a medium-term upward channel. Supported by moving averages, it steadily rose, trading around 1.3630 by the close of Asian trading on Friday, with a cumulative weekly gain of approximately 0.5%. Last week, the exchange rate rebounded along the lower channel support, facing resistance at the upper channel, maintaining a healthy medium-term bullish structure. Moving averages are in a bullish alignment: the price has stabilized above the 5/10/20-day moving averages, with strong support from the 9-day (1.3558) and 25-day (1.3504) simple moving averages. The RSI (14) is at 60-65 on the daily chart, neutral to slightly bullish, with no overbought divergence, indicating ample upward momentum. The MACD shows a golden cross above the zero line, with the red bars continuing to expand, indicating that bullish momentum has not weakened.
Currently, GBP/USD is trading around 1.3630, maintaining a constructive bullish stance, with the price holding above the 25-day simple moving average (1.3504) and the 50.0% Fibonacci retracement level at 1.3512. The pair has broken above a key retracement range, with the 61.8% Fibonacci level at 1.3595 and the 1.3599 area (April 17 high) providing immediate support, indicating solid but not overextended upward momentum. On the upside, this would open the door to the 1.3700 psychological level, as well as the 78.6% Fibonacci resistance at 1.3715, followed by the recent cycle high of 1.3864. Initial support is located at the 9-day simple moving average at 1.3588, supplemented by the 50.0% retracement level at 1.3512; further pullback could test the 1.3500 psychological level.
Today, consider going long on GBP at 1.3620, with a stop-loss at 1.3610 and targets at 1.3670 and 1.3680.
USD/JPY
The yen traded near 156.50 per dollar on Friday and is expected to remain largely unchanged by the end of the week, as intervention concerns and renewed verbal warnings from Tokyo failed to sustain the recent rally. Japan's chief currency diplomat stated last week that the country has no limit to the frequency of intervention in the foreign exchange market and maintains daily communication with US authorities. Meanwhile, data showed that real wages in Japan rose for the third consecutive month in March, reinforcing market expectations that the Bank of Japan may continue to tighten policy. Externally, the yen faces upward pressure from a strong dollar as geopolitical tensions escalate due to the conflict between the US and Iran in the Strait of Hormuz.
On the other hand, USD/JPY experienced its first intervention by the Japanese Ministry of Finance since breaking through the 160.00 level on April 30, falling more than 400 points in a single day. This level is considered the limit of yen weakness that Japanese authorities can tolerate. Reuters confirmed that Japan may have spent over 5 trillion yen (approximately $32 billion) to boost its currency, and recent price action suggests further smaller-scale interventions are likely this week. These actions have temporarily curbed yen selling, although fundamental factors have raised questions about the policy's sustainability. The Bank of Japan's relatively low interest rates, coupled with the risks to the Japanese economy from rising oil prices and the country's fragile fiscal stability, have kept the yen vulnerable. On the other hand, the escalating situation in the Middle East provided safe-haven buying support for the dollar on Friday, weakening previous expectations of a swift end to the US-Iran war.
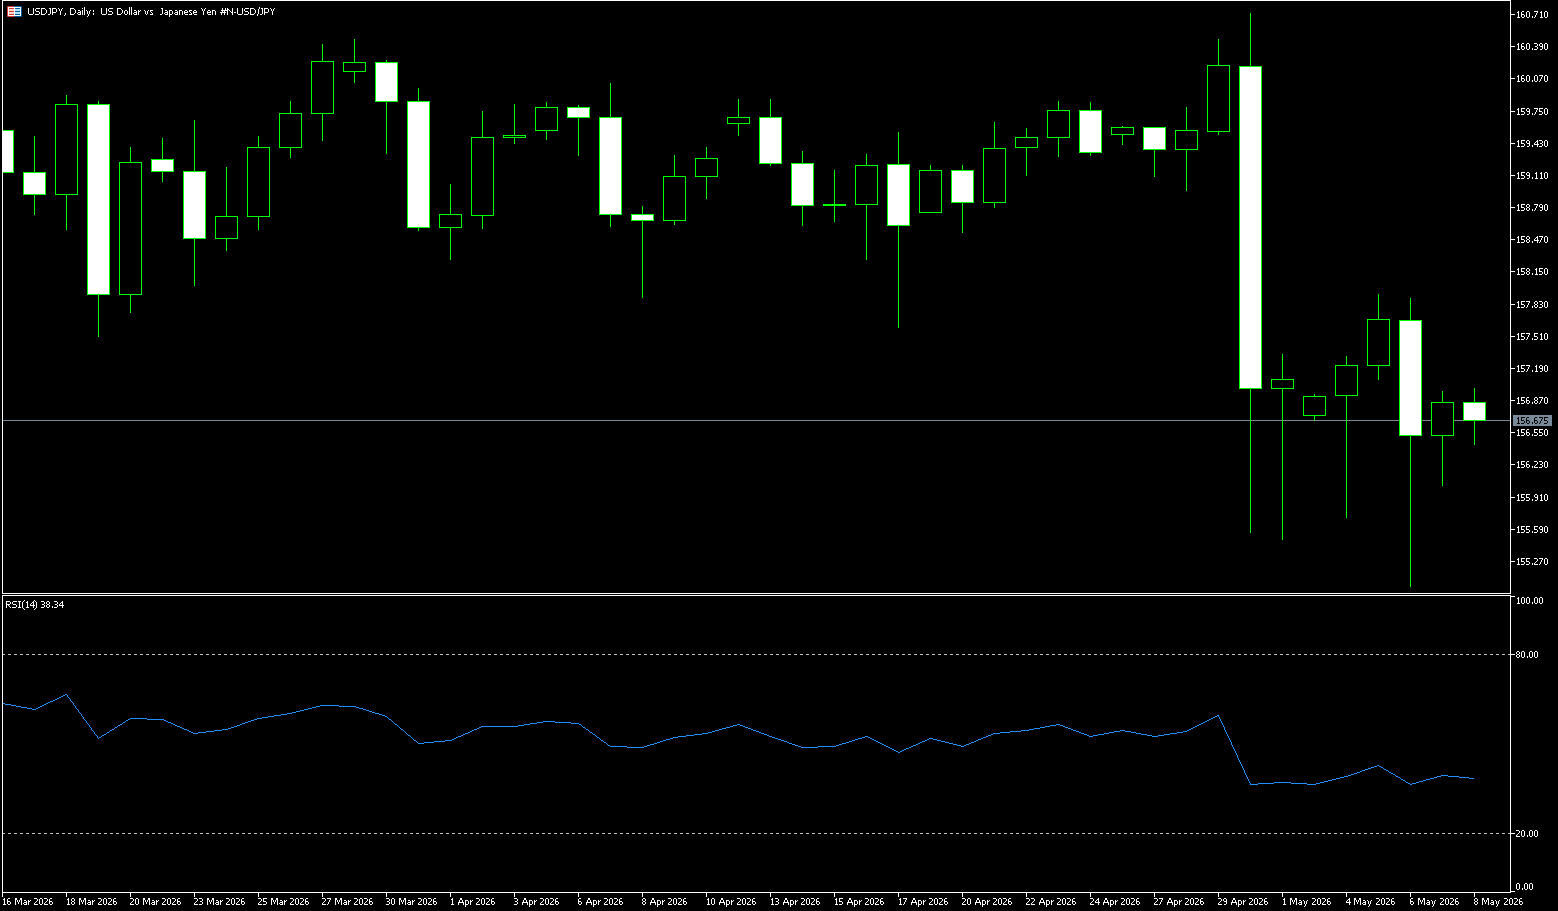
Last week, the USD/JPY pair exhibited a wide range of high-level fluctuations, weakening bullish momentum, and limited upside potential due to intervention expectations. It rose and then fell back during the week, ultimately settling below the 157 level. The core trading range for the week was 155.00–158.00, with 160 (a psychological level) acting as strong resistance for policy intervention and 154.32 (the 200-day moving average) providing strong short-term support. Since Japan's intervention (approximately 5 trillion yen) at the end of April, market expectations for intervention at the psychological level of 160 have been strong, limiting upward potential and creating a "high-to-low" technical pattern. The exchange rate remains above the 200-day moving average of 154.32 and last week's low of 155.05, maintaining a healthy medium-to-long-term bullish trend. The RSI (14) has fallen from the overbought zone (70+) to around 40, indicating a neutral-to-bearish bias and weakening bullish momentum. Meanwhile, the MACD histogram above the zero line has shortened and turned green, indicating a moderate expansion of downward momentum; the 4-hour chart shows a golden cross below the zero line at a low level, suggesting a short-term oversold rebound.
From the daily chart, USD/JPY currently maintains a clear medium-to-long-term bullish structure, but the pace of the rise has begun to slow. After several attempts to break through the 160 level, suspected intervention by Japanese authorities caused a rapid decline, indicating that the 160 area has become an extremely sensitive policy defense zone for the market. From the perspective of moving average structure, the 5-day and 10-day moving averages are starting to flatten, while 156.00 (the psychological level) and 155.98 (the 160-day moving average) have become important medium-term support areas. If the exchange rate breaks below these areas, it may retest 155.05 (last week's low) and then head towards 154.32 (the 200-day moving average). However, if the US dollar rebounds significantly, USD/JPY may further test 157.64 (the 9-day moving average) and even the vicinity of the 158.00 level. A retest of 158.00 would then challenge the 158.71 (the 50-day moving average) level.
Today, consider shorting the US dollar at 156.85, with a stop loss at 157.05 and targets at 156.00 and 155.80.
EUR/USD
The euro traded above $1.17 against the dollar for most of last week, near its highest level since April 20, as markets became more hawkish on the European Central Bank's policy outlook, driven by renewed inflation concerns. Brent crude prices rose again above $100 a barrel following the conflict between the US and Iran near the Strait of Hormuz, adding to concerns about further instability in the region's fragile ceasefire. Meanwhile, US President Donald Trump warned the EU that he would impose "higher" tariffs on EU goods if the group did not remove tariffs on US goods by July 4. The currency market expects the ECB to tighten by more than 50 basis points by the end of the year, or at least two rate hikes, with a greater than 75% probability of a first rate hike in June. Several ECB officials have recently indicated that a rate hike is more likely due to persistent inflationary pressures.
Money markets anticipate the European Central Bank (ECB) will tighten interest rates by more than 50 basis points by the end of the year, or at least raise rates twice, with a greater than 75% probability of a first rate hike in June. Several ECB officials recently indicated that a rate hike is more likely due to persistent inflationary pressures. Despite escalating tensions with Iran and weak German data released earlier in the day triggering moderate risk aversion, the euro managed to shrug off, remaining trapped within its three-week trading range, below the 1.1800 area. Prior to the weekend, reports of clashes between the US and Iran in the Strait of Hormuz dampened risk appetite, casting a shadow over hopes for a peace agreement.
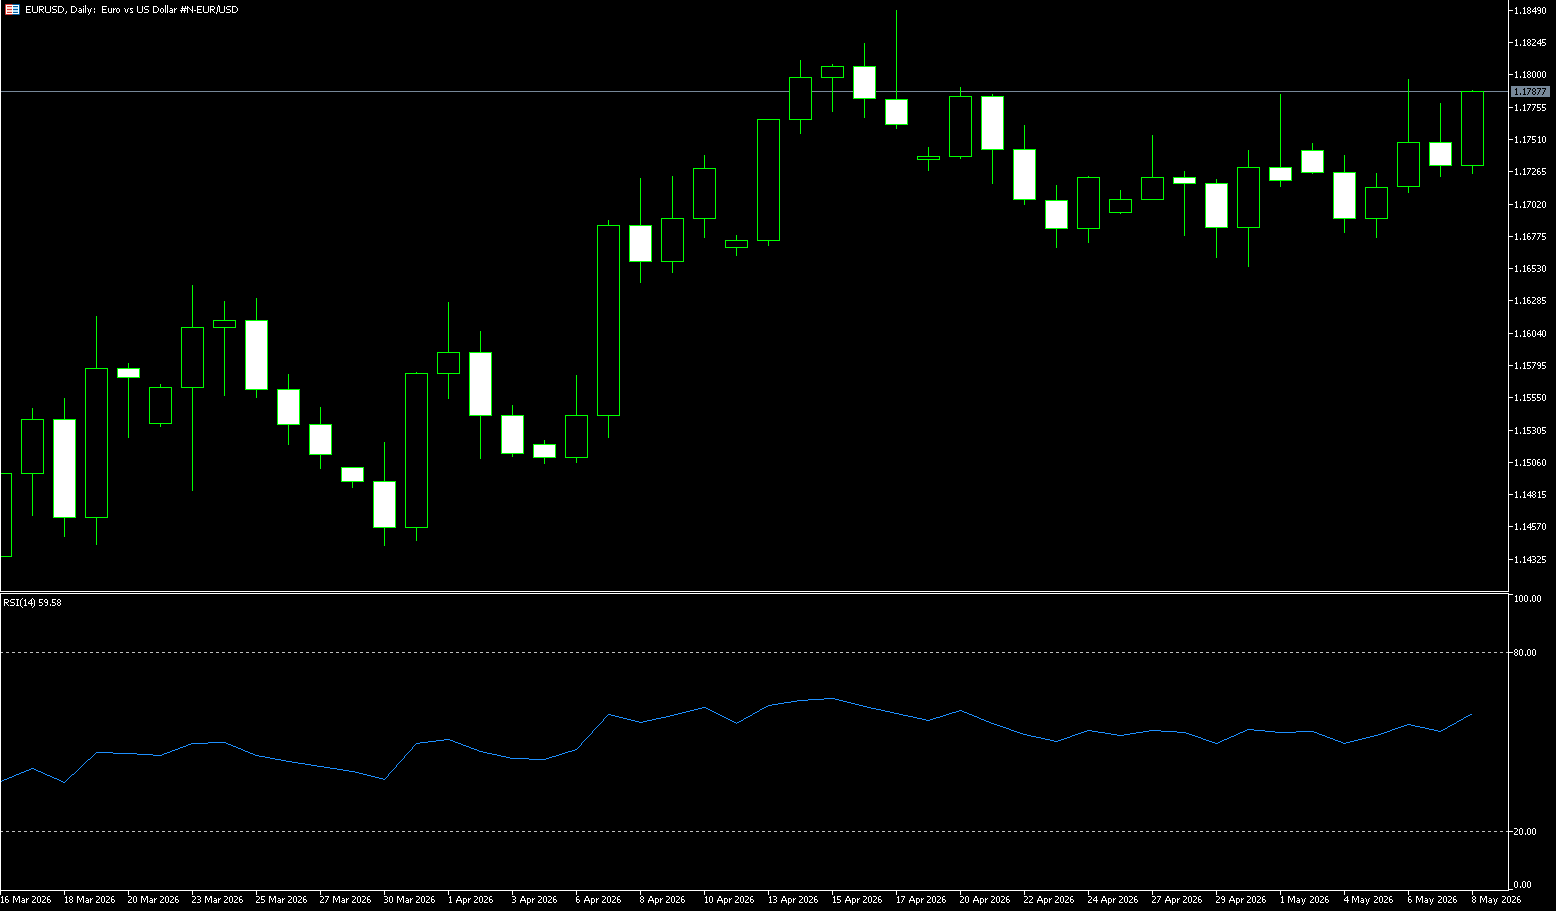
Last week, the euro traded in a narrow, slightly bullish range against the US dollar, consolidating at higher levels. A weaker US dollar index, support from expectations of higher ECB interest rates, and a recovery in risk appetite contributed to the gains; however, concerns about the Eurozone recovery limited the overall gains, resulting in low volatility and a slightly bullish bias. Technically, the pair has seen consecutive small gains, trending upwards with a rising center of gravity; the upward trend continues, with higher highs and higher lows, indicating the bullish trend remains intact. Meanwhile, the exchange rate has stabilized above the 5/10/50-day moving averages, showing a bullish trend and solid support; the RSI (14) is currently at 59.72, neutral to bullish, with no overbought conditions; and the MACD indicator continues its golden cross above the zero line, with the red bars showing moderate volume, indicating stable upward momentum.
In the short term, EUR/USD maintains a moderately bullish bias, stabilizing above the 1.1700 level, but momentum indicators are mixed. The 4-hour Relative Strength Index (RSI) hovers around 54, while the MACD indicator has slightly turned negative and flattened, suggesting weakening upward momentum. More broadly, the pair is fluctuating within the 1.1681 (200-day moving average) - 1.1796 (last week's high) range, with the resistance zone between 1.1796 (May 6 high) and 1.1800 (psychological level) posing a challenge to the bulls. The currency pair appears to need additional momentum to break through these levels, shifting focus to the April highs around 1.1850. A break above that level would target 1.1900. On the downside, 1.1723 (last Friday's low) could provide support for a potential bearish reversal, although the key area for the bears lies between 1.1681 (200-day moving average) and 1.1666 (38.2% Fibonacci retracement), a range that repeatedly resisted selling in April.
Consider going long on the Euro today at 1.1774, with a stop-loss at 1.1760 and targets at 1.1830 and 1.1840.
Disclaimer: The information contained herein (1) is proprietary to BCR and/or its content providers; (2) may not be copied or distributed; (3) is not warranted to be accurate, complete or timely; and, (4) does not constitute advice or a recommendation by BCR or its content providers in respect of the investment in financial instruments. Neither BCR or its content providers are responsible for any damages or losses arising from any use of this information. Past performance is no guarantee of future results.
Lebih Liputan


Pendedahan Risiko:Instrumen derivatif diniagakan di luar bursa dengan margin, yang bermakna ia membawa tahap risiko yang tinggi dan terdapat kemungkinan anda boleh kehilangan seluruh pelaburan anda. Produk-produk ini tidak sesuai untuk semua pelabur. Pastikan anda memahami sepenuhnya risiko dan pertimbangkan dengan teliti keadaan kewangan dan pengalaman dagangan anda sebelum berdagang. Cari nasihat kewangan bebas jika perlu sebelum membuka akaun dengan BCR.
BCR Co Pty Ltd (No. Syarikat 1975046) ialah syarikat yang diperbadankan di bawah undang-undang British Virgin Islands, dengan pejabat berdaftar di Trident Chambers, Wickham’s Cay 1, Road Town, Tortola, British Virgin Islands, dan dilesenkan serta dikawal selia oleh Suruhanjaya Perkhidmatan Kewangan British Virgin Islands di bawah Lesen No. SIBA/L/19/1122.
Open Bridge Limited (No. Syarikat 16701394) ialah syarikat yang diperbadankan di bawah Akta Syarikat 2006 dan berdaftar di England dan Wales, dengan alamat berdaftar di Kemp House, 160 City Road, London, City Road, London, England, EC1V 2NX. Entiti ini bertindak semata-mata sebagai pemproses pembayaran dan tidak menyediakan sebarang perkhidmatan perdagangan atau pelaburan.

 English
 简体中文
简体中文
 繁體中文
繁體中文
 Bahasa
Melayu
Bahasa
Melayu
 Tiếng
Việt
Tiếng
Việt
 ไทย
ไทย
 日本語
日本語
 한국어
한국어
 ភាសាខ្មែរ
 español