0
US Dollar Index
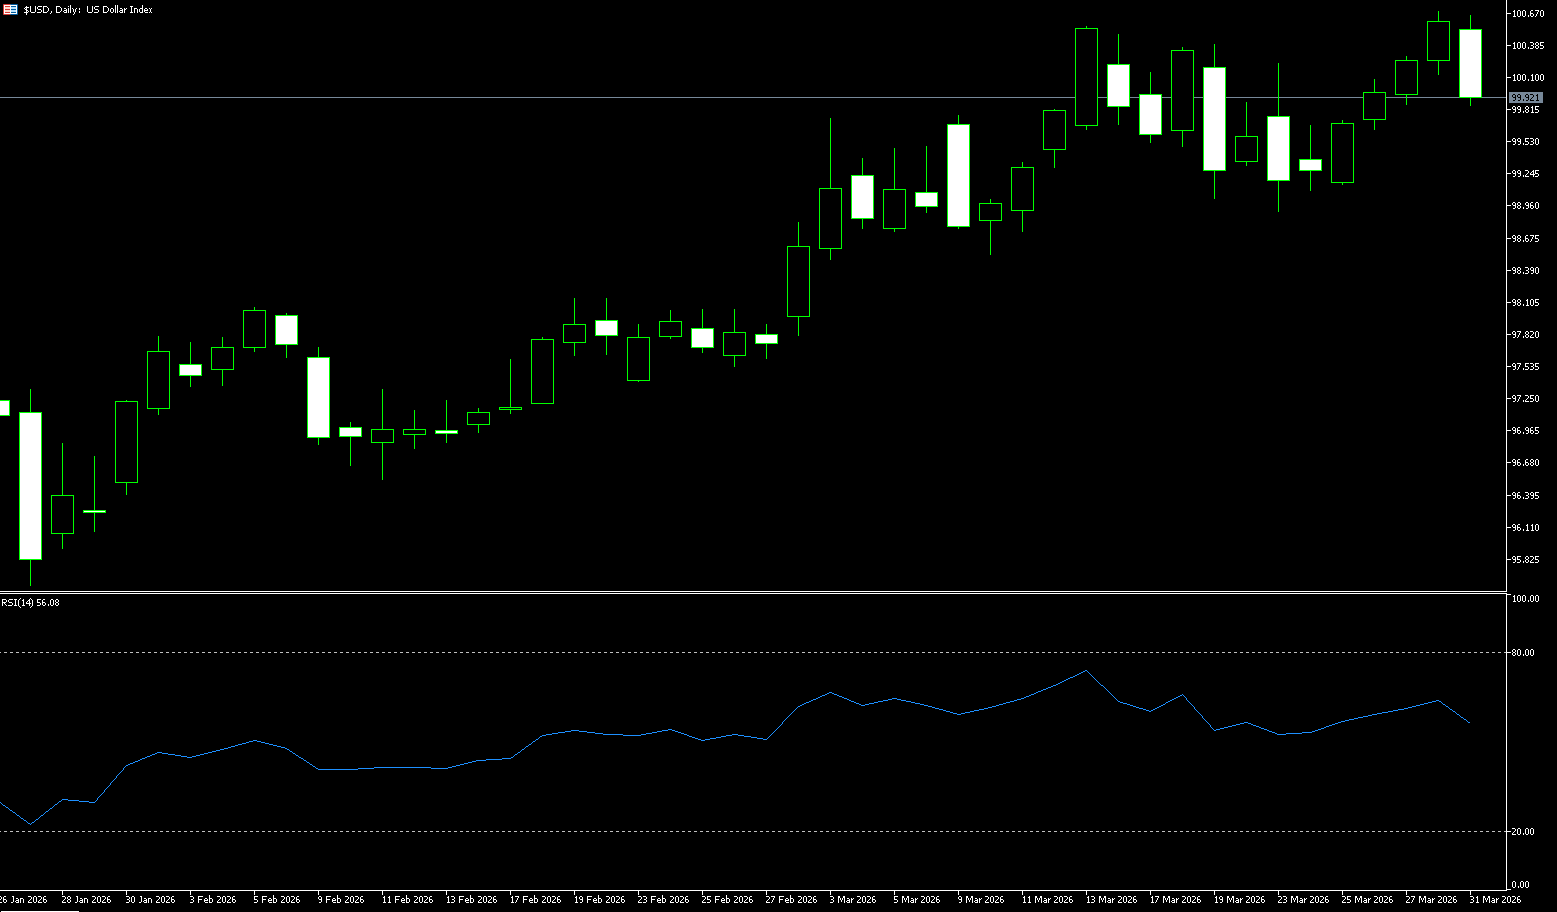
The US dollar index rose 0.22% at the start of the week, reaching a high of 100.65, its highest level since May 19th. On Tuesday (March 31st), during the European and American trading sessions, the dollar index plunged rapidly from the key level of 100.50, currently trading at 99.87, breaking below the psychological level of 100. The core reason for this round of dollar weakness stems from the rapid easing of geopolitical risks in the Middle East, leading to a significant withdrawal of safe-haven funds from dollar assets. Meanwhile, gold did not strengthen in tandem with the dollar's plunge, suggesting that the logic of easing geopolitical concerns holds true. US President Trump threatened to destroy Iran's energy facilities if it did not open the Strait of Hormuz, and rising oil prices exacerbated inflation concerns while also raising worries about energy costs harming consumers and economic growth. Investors are beginning to focus on growth, particularly concerned about the prospects of more vulnerable economies such as the UK and the EU.
Given that geopolitical conflict and inflation have completely dominated the market, unless Iran releases clear signals of reconciliation, the dollar's gains this month are unlikely to be quickly reversed. Macroeconomic geopolitical risks and the Fed's policy shift are currently far more significant than labor market data (non-farm payrolls). Daily chart structure and pattern: The US dollar index has successfully stabilized above the psychological level of 100, approaching the top of its 11-month range, showing a potential five-wave upward pattern. After breaking through the 100.25-100.50 resistance zone, the upside potential is expected to open to 101.00-101.20; key support lies at 99.50-99.80, and a break below this level would test the 9.00 level. Moving average system and technical indicators: Prices are trading above all major moving averages (5/10/20 days), and the Bollinger Bands are narrowing, indicating reduced short-term volatility but no change in the bullish trend. The RSI (14) is around 58.43, neutral to bullish, not yet overbought, and the MACD histogram remains positive with the golden cross continuing.
Today, consider shorting the US Dollar Index at 99.98, with a stop-loss at 100.10 and targets of 99.50 and 99.40.
WTI Crude Oil
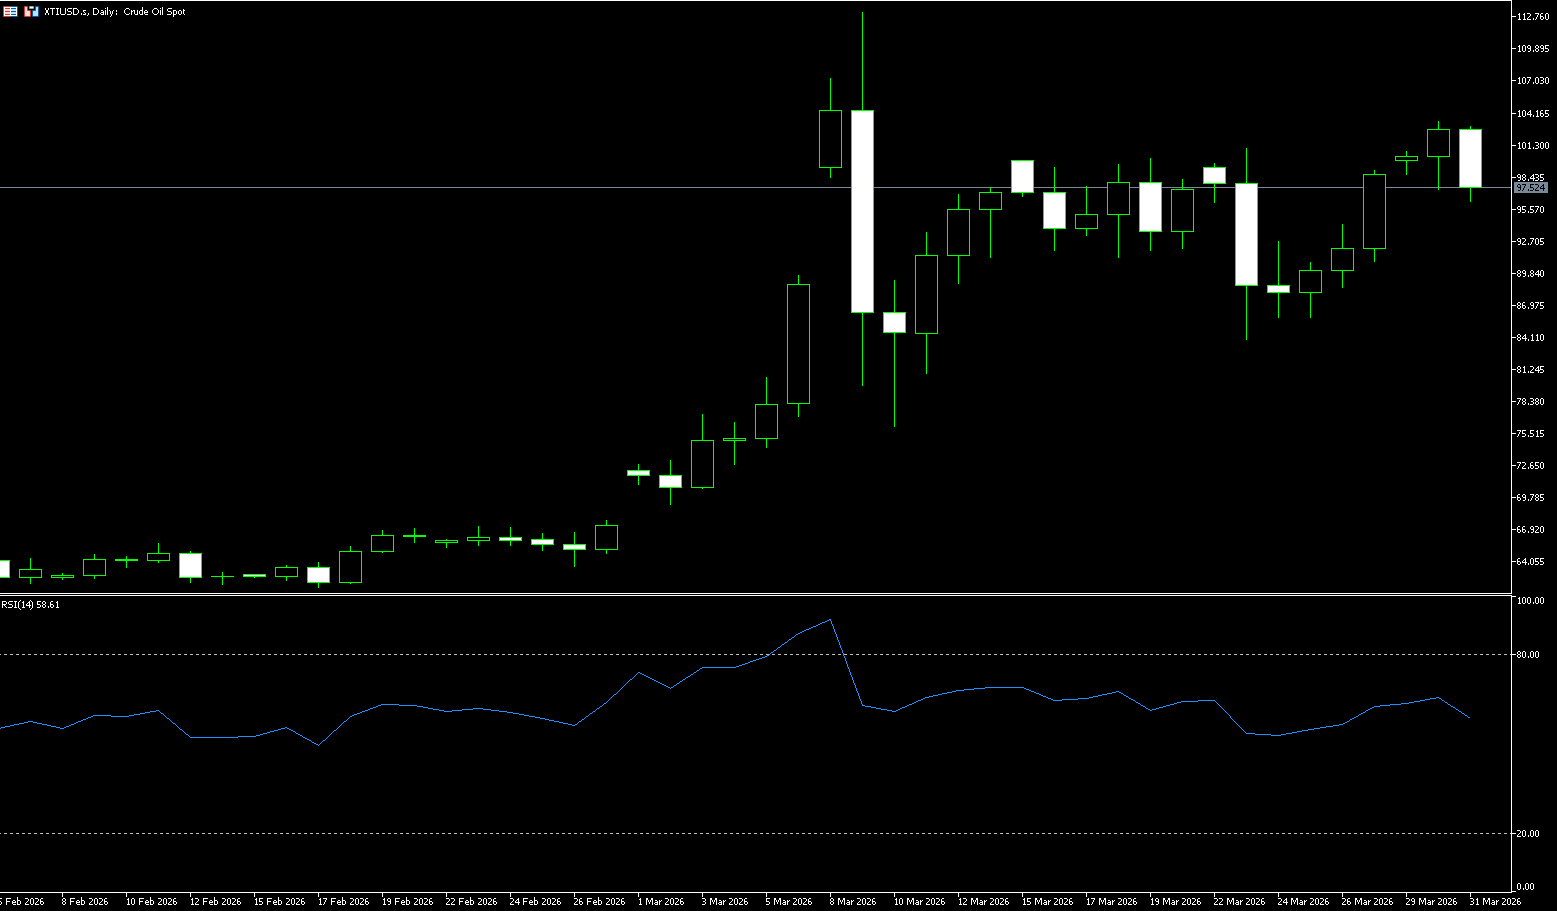
US WTI crude oil prices fell below $100 on Tuesday, paring a surge to $103.40 earlier in the day, after the Iranian president stated he was prepared to end the war if Iran's conditions were met. This statement coincided with US President Trump's de-escalation attempt to halt attacks on the country and could help eventually restore tanker traffic from major Gulf Cooperation Council (GCC) oil producers in the Strait of Hormuz. While hopes for restored supply limited downward pressure on crude prices, the slight pullback reflected skepticism about the impending peace, given Iran's previously rigid demands and the risk of escalation from the deployment of US troops to the Middle East. Global oil prices are expected to rise by about 40% in March, reaching their highest level since 2022, as the outbreak of war disrupts supplies in the region and damages energy infrastructure in major OPEC members.
The global situation will be highly volatile over the next 24 months, and the current crude oil forward price curve has not yet fully priced in the impending escalation of hostility. Currently, long positions are highly concentrated, while short positions continue to exit. Significant changes have occurred in the "Other Reporting Traders" category, with these funds closing out 15,538 short positions, a 29% decrease week-on-week. If the situation reverses, oil prices will plummet. This week's weekly chart structure is crucial for oil price movements: if oil prices fail to hold above the $100/barrel (psychological level) area, they will at least fall back to the $96.37 (early weekly low) and the previous range of $94.71 (9-day moving average); however, if oil prices stabilize above $100/barrel, the probability of further upward movement is higher, reaching $105.84 (upper Bollinger Band) and the previous high of $113.28.
Today, consider going long on spot crude oil at 97.15, with a stop-loss at 97.00 and targets at 100.00 and 99.70.
Spot Gold
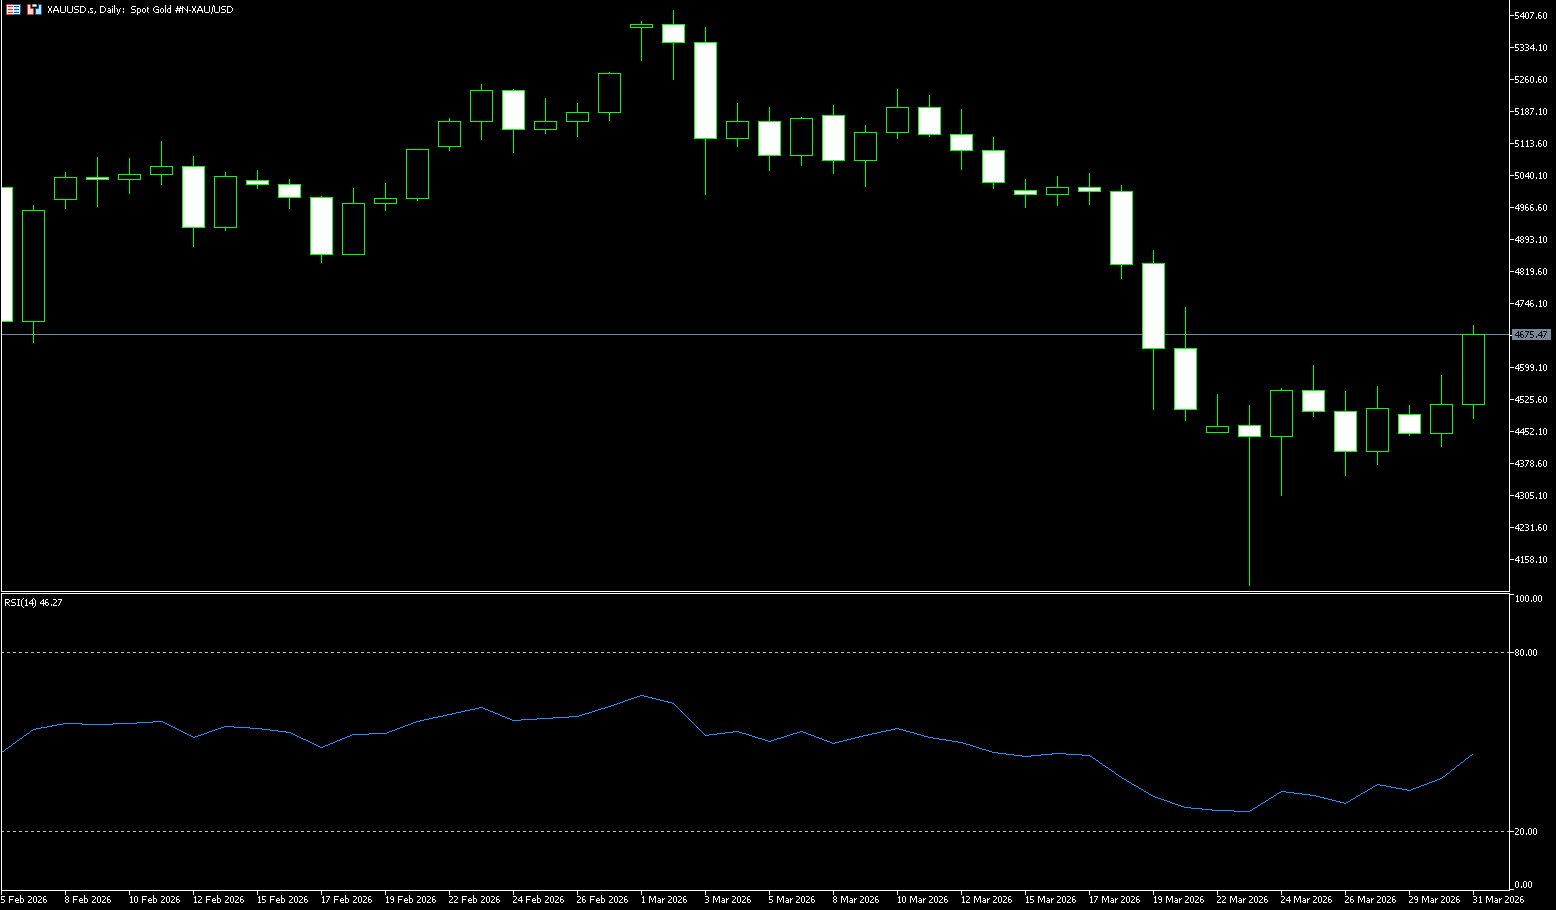
On Tuesday, spot gold traded around $4,675 per ounce. Gold prices rose for the second consecutive trading day on Monday, primarily driven by safe-haven demand fueled by the ongoing conflict in the Middle East. The war continues with no end in sight, pushing up gold prices as safe-haven demand rebounds. Although the market no longer expects the Federal Reserve to cut interest rates this year; despite the recent rebound, gold prices have fallen more than 14% so far in March, on track for their worst monthly performance since 2008, as soaring energy prices have prompted the market to reassess interest rate expectations. In the short term, the movements of gold and other precious metals remain highly dependent on the progress of the Middle East war (especially the ongoing military confrontation between the two sides), oil price dynamics, and the Federal Reserve's further assessment of the balance between inflation and growth. This week, the US will release a series of important economic data, including job openings, retail sales, the ADP employment report, and non-farm payrolls, which the market will use to further assess economic resilience.
Looking ahead, gold prices are expected to initially test resistance through consolidation, followed by a divergence depending on the evolution of the conflict. In the short term, with continued uncertainty surrounding the war and no quick solution, safe-haven demand will continue to support gold prices. This week's upcoming US job openings, retail sales, ADP employment report, and non-farm payroll data will be the market focus. If economic data shows resilience, coupled with high oil prices, inflation concerns may persist, limiting the upside potential for gold prices. Support levels to watch are $4,500 (psychological level), $4,502 (9-day moving average), and then $4,420 (this week's low). Conversely, if data shows signs of slowing growth, declining Treasury yields, and increased safe-haven demand, gold prices may challenge the short-term resistance levels of $4,673 (14-day moving average) – $4,700 (psychological level). A break below this level would target the $4,800 level.
Consider going long on spot gold today at $4,670, with a stop-loss at $4,664 and targets at $4,720 and $4,700.
AUD/USD
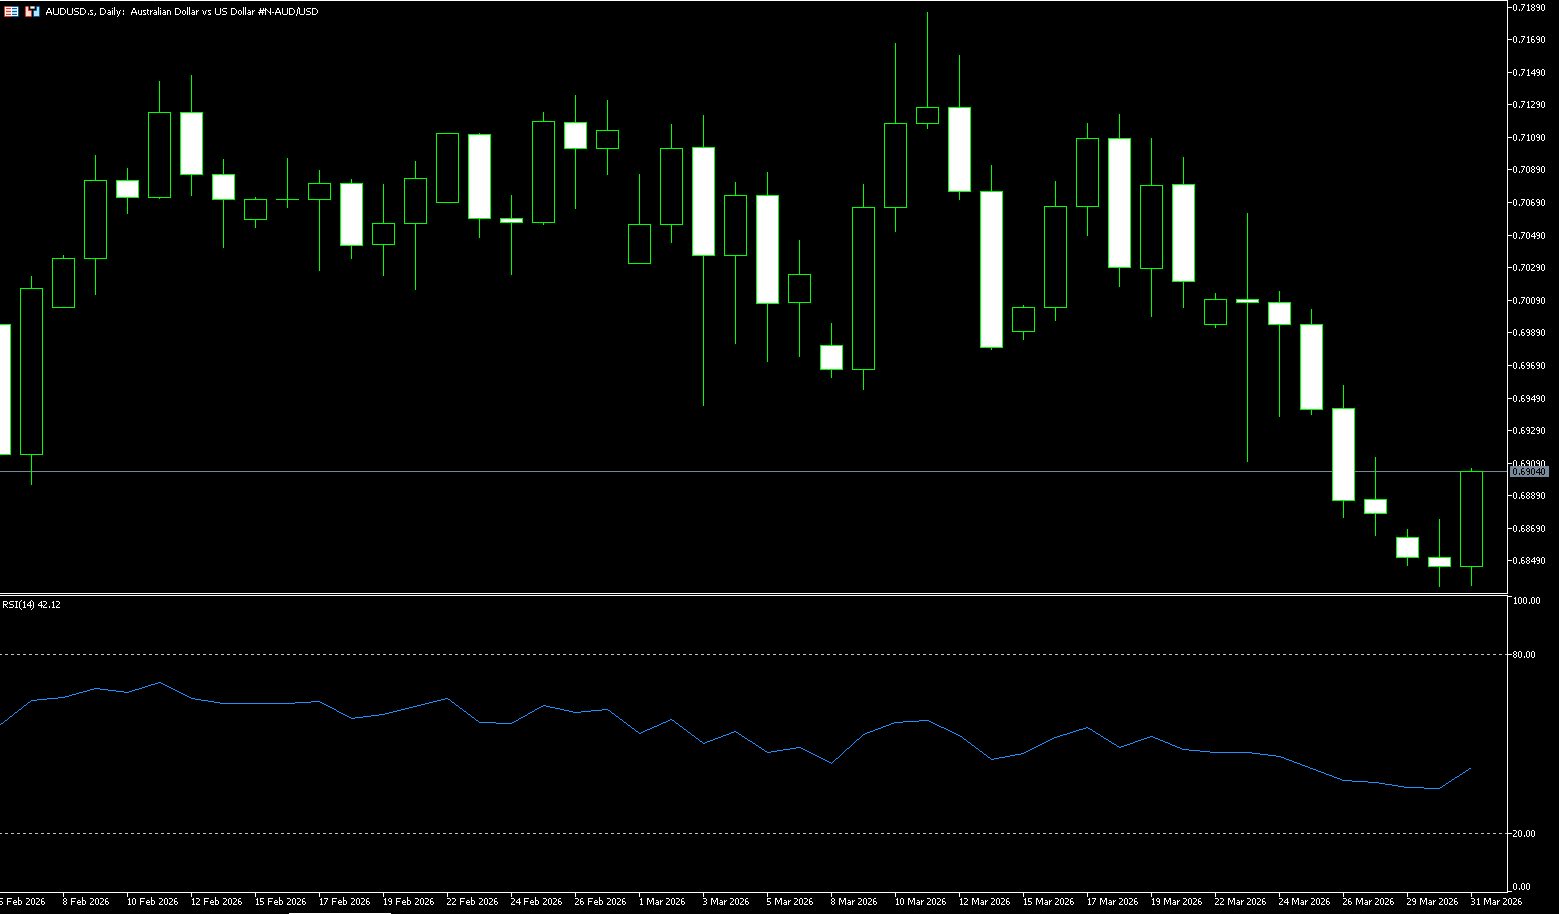
According to the latest data released by the National Bureau of Statistics (NBS) on Tuesday, China's manufacturing Purchasing Managers' Index (PMI) jumped to 50.4 in March, up from 49 in February. This reading was significantly higher than the market expectation of 50.1. The NBS non-manufacturing PMI rose to 50.1 in March, from 49.5 in February. The market consensus was 49.9. The AUD/USD pair remained near 0.6875, up 0.30% on the day. Investors turned to the US dollar as a safe haven due to a sharp rise in energy prices caused by tensions in the Middle East, casting a shadow over the global economic outlook. Last week, the Australian dollar fell 2.1%, its worst week since April, and is currently expected to decline by about 3.8% this month, the largest drop since December 2024. The focus now shifts to the release of the Reserve Bank of Australia's latest meeting minutes, following a very close vote to raise interest rates to 4.1%, with policymakers weighing persistent inflation against a slowing growth outlook.
On the daily chart, the Australian dollar is trading at 0.6900 against the US dollar. The short-term bias is slightly bearish, as the spot price has retreated from the 0.7150 area and broken below the 23.6% Fibonacci retracement level of 0.6976, calculated from the low of 0.6421 to the high of 0.7147. The pair is currently below the 50-day simple moving average (0.7020) but remains well above the rising 100-day simple moving average around 0.6822, constituting a corrective decline within a broader uptrend. The 14-day Relative Strength Index (RSI) is at 38, indicating strengthening bearish momentum, while the Average Directional Index (ADX) has rebounded to the mid-20, suggesting that this downward phase is gaining directional strength after the previous trend paused. Immediate resistance is at 0.6949 (9-day simple moving average), with stronger upside resistance at the 23.6% Fibonacci retracement level around 0.6976. A daily close above 0.6976 would alleviate downward pressure and pave the way for a rebound to the psychological level of 0.70. Initial support is at 0.6822 (100-day simple moving average), followed by 0.6784, corresponding to the 50.0% Fibonacci retracement target of the 0.6421 to 0.7147 rally.
Consider going long on the Australian dollar at 0.6890 today, with a stop loss at 0.6880 and targets at 0.6940 and 0.6960.
GBP/USD
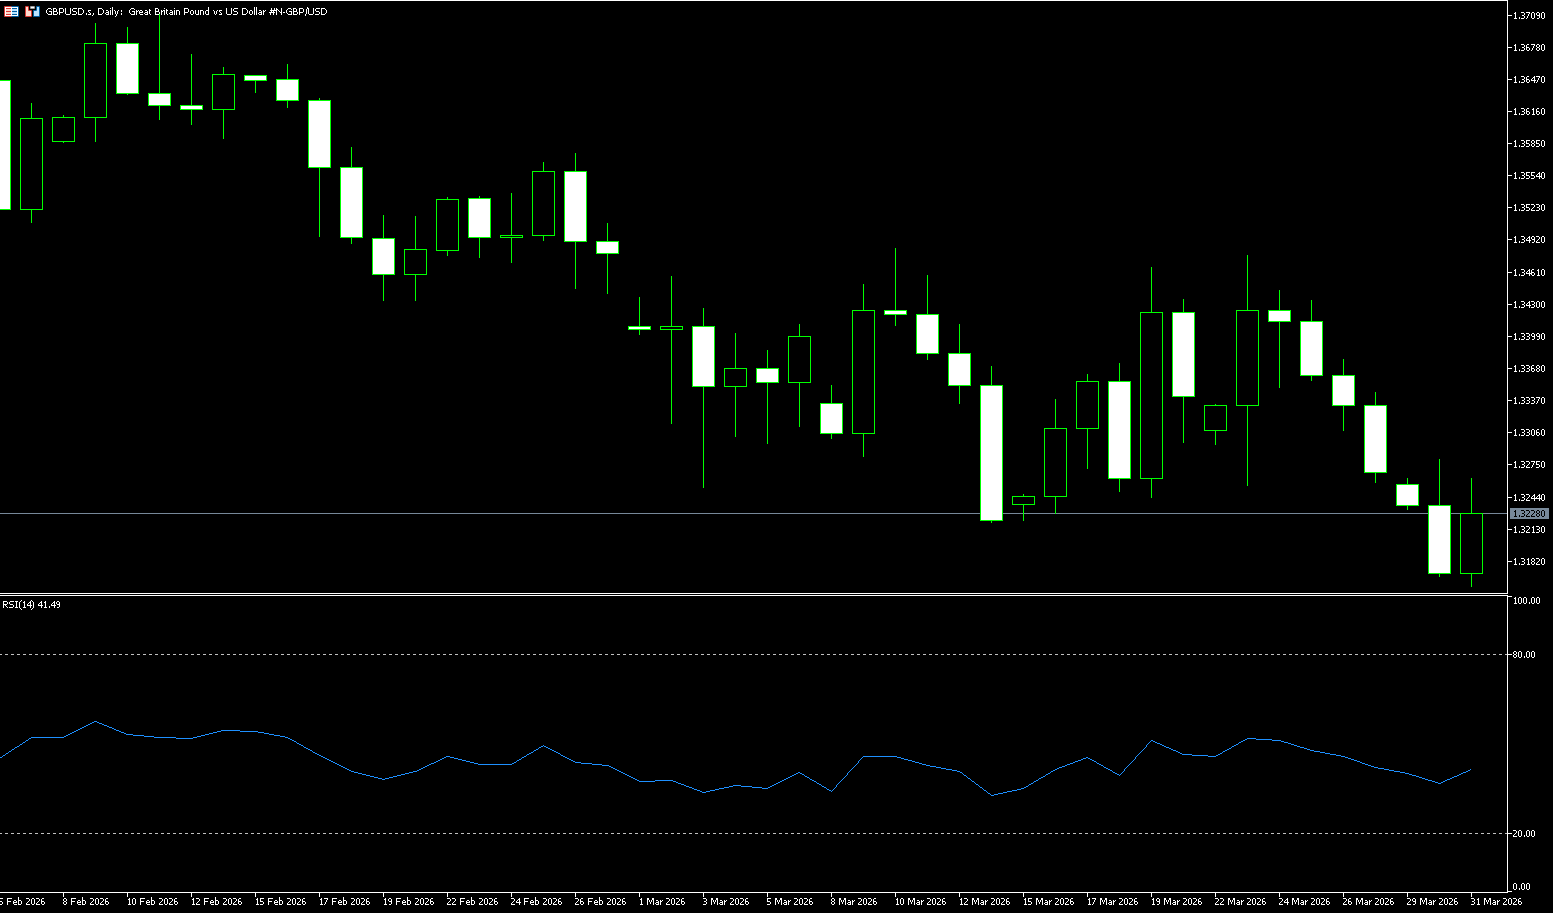
GBP/USD has rebounded slightly from the 1.3160-1.3155 range (over four-month low) reached during Tuesday's Asian session and appears to have ended its five-day losing streak. Spot prices rebounded above the 1.3200 level, but upside appears limited due to escalating tensions in the Middle East. US President Trump stated on Monday that significant progress had been made in negotiations to end US military action in Iran. Trump also indicated that an agreement with a more rational Iranian regime, as he described it, remained possible. In response, Iran expressed reluctance to engage with the US, emphasizing the fragility of diplomatic progress and undermining hopes for a de-escalation of Middle East tensions. This supported high energy prices, fueled inflation concerns, and fueled hawkish expectations from the Federal Reserve. In fact, traders currently expect a greater than 50% probability of a Fed rate hike in 2026, which pushed the dollar to a new high for the year on Tuesday and should limit the gains in GBP/USD. Meanwhile, hawkish signals from the Bank of England, suggesting a possible rate hike as early as April due to inflation concerns, increased downside risks to the economy. This, in turn, could dampen traders' aggressive bets on the pound and limit upside for GBP/USD, thus requiring caution before betting on any substantial rebound.
The pound showed some resilience, maintaining the gains it had made against the dollar after the Bank of England's hawkish hold last week. Given the continued uncertainty surrounding US-Iran negotiations on a potential de-escalation or ceasefire, the outlook for this currency pair remains slightly bearish. On the daily chart, GBP/USD is slightly bearish in the short term, as the spot price remains below the flattening 9-day simple moving average at 1.3330 and trading below the Bollinger Band middle line {1.3342}, keeping the pair's movements in the lower half of its trading range. The 14-day Relative Strength Index (RSI) is around 39, reinforcing the loss of bullish momentum rather than significant selling pressure, indicating that sellers still have the upper hand, but the declines are restrained rather than impulsive. Near-term support lies near the psychological low of 1.3200; a break below this area would expose the next downside target around 1.3160. Initial resistance is below the 9-day simple moving average at 1.3330 and trading around the Bollinger Band middle line {1.3342}; a daily close above this resistance would help neutralize the bearish sentiment and pave the way for a further challenge of 1.3400.
Today, consider going long on GBP at 1.3220, with a stop-loss at 1.3210 and targets at 1.3270 and 1.3280.
USD/JPY
USD/JPY continued its rebound from the 159.35-159.30 range to around 158.75, gaining some positive momentum during Tuesday's Asian session. Spot prices maintained a modest rise, influenced by weak Tokyo consumer inflation data, but gains were capped before the psychological level of 160.00. A government report released earlier today showed that Tokyo's overall consumer price index slowed to 1.4% in March from 1.5% last month, the lowest level since March 2022. This data weakened the yen. Meanwhile, a bullish dollar provided tailwinds for the USD/JPY pair. Traders have completely ruled out the possibility of further rate cuts by the Federal Reserve, pushing the dollar to a new high for the year. Meanwhile, Japan's Deputy Finance Minister for International Affairs, Akio Mimura, issued his strongest signal yet on Monday, indicating that authorities are prepared to take decisive action if speculative activity in the currency markets continues. Furthermore, Bank of Japan Governor Kazuo Ueda stated that the central bank will closely monitor foreign exchange market movements, limiting new short positions in the yen and limiting upside potential for USD/JPY.
On the daily chart, USD/JPY is trading at 158.75. The short-term bias is bullish, as the pair has firmly established itself above the rising 50-day simple moving average (156.70), and the 50-day is significantly above the 200-day simple moving average, confirming the established uptrend. Recent candlestick patterns show only a shallow pullback, suggesting limited correction within a broader uptrend, while the Stochastic Relative Strength Index (SRSI) has retreated from previous overbought levels but not broken below, indicating cooling momentum rather than a reversal. This combination suggests the market is consolidating gains at higher levels rather than forming a clear top pattern. Initial resistance is located in the 160.46 area, which is the high of this week's fluctuations. A sustained break above this level would open up space towards the 161.00 psychological level. On the downside, the recent rebound low of 158.50 forms the first support. Further down, the 157.30 area aligns with the previous consolidation range and is not far from the 50-day moving average at 156.70, making it a more significant downside support; a daily close below this level would begin to weaken the current bullish structure.
Consider shorting the US dollar at 159.00 today, with a stop loss at 159.20 and targets at 158.00 and 157.80.

EUR/USD
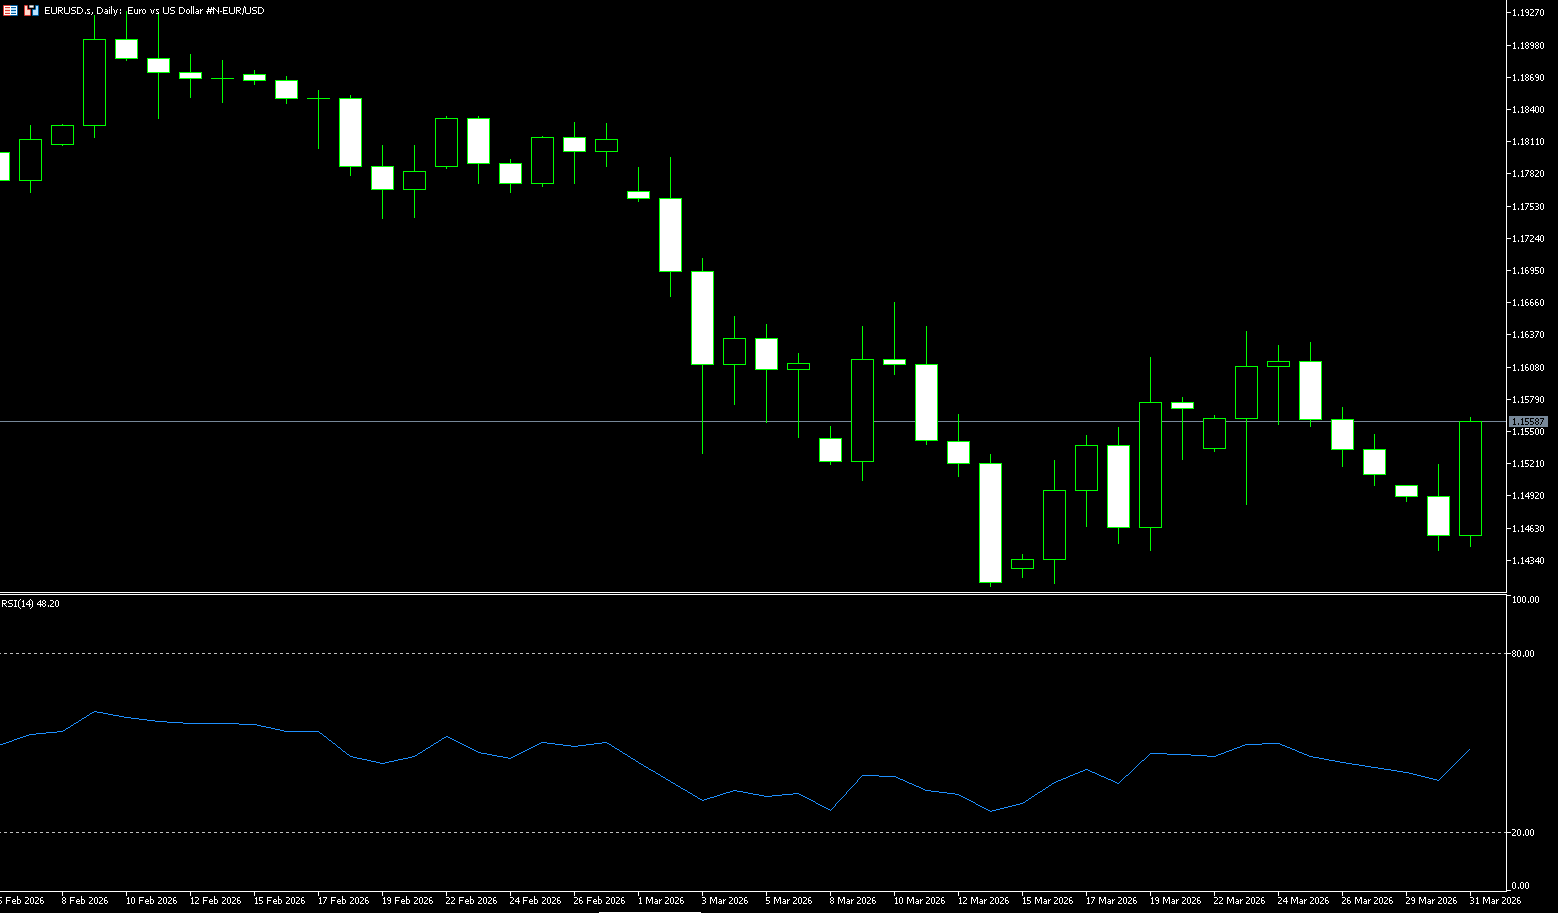
The euro/dollar pair rose slightly after five consecutive days of declines, trading around 1.1550 on Tuesday. Bank of France Governor François Villeroy de Gallo said on Monday that policymakers are prepared to act if energy-driven inflation spreads. He added that the energy shock related to the Iranian conflict could push up inflation in the short term, but the ECB would be unable to prevent the initial price increase. The euro/dollar exchange rate rose as the dollar retreated after five consecutive days of gains. However, the dollar may rebound as safe-haven demand rises due to tensions in the Middle East. Federal Reserve Chairman Jerome Powell noted on Monday that despite increased uncertainty in the Middle East, long-term inflation expectations in the United States remain solid, and emphasized that the Fed's policy stance allows officials to assess the economic impact of the Iranian conflict.
The euro faced further selling pressure against the dollar, approaching the 1.1400 level, bringing it back to near its lowest level this year. The euro/dollar pair started the week quite weakly, facing additional downward momentum, near its year-to-date low of around 1.1411, marking its fifth consecutive day of decline. On the daily chart, EUR/USD is slightly bearish in the short term as the spot price continues to trade below the 9-day (1.1546) and 20-day (1.1550) simple moving averages, which are all above 1.16 and have flattened after previous tops, indicating persistent downward pressure below a broad resistance zone. Momentum indicators reinforce this trend, with the 14-day Relative Strength Index (RSI) sliding towards the mid-39 after failing to hold above the 50 neutral level. Immediate resistance lies at the 9-day (1.1546) and 20-day (1.1550) simple moving averages, followed by the 1.1600 level. Initial support is located at the 1.1411 (this year's low) and 1.400 (psychological level) area; a clear break below this level would pave the way for the next bearish target of the 1.1300 area.
Consider going long on the Euro today at 1.1530, with a stop-loss at 1.1520 and a target of 1.1580 ; 1.1590.
Disclaimer: The information contained herein (1) is proprietary to BCR and/or its content providers; (2) may not be copied or distributed; (3) is not warranted to be accurate, complete or timely; and, (4) does not constitute advice or a recommendation by BCR or its content providers in respect of the investment in financial instruments. Neither BCR or its content providers are responsible for any damages or losses arising from any use of this information. Past performance is no guarantee of future results.
Lebih Liputan


Pendedahan Risiko:Instrumen derivatif diniagakan di luar bursa dengan margin, yang bermakna ia membawa tahap risiko yang tinggi dan terdapat kemungkinan anda boleh kehilangan seluruh pelaburan anda. Produk-produk ini tidak sesuai untuk semua pelabur. Pastikan anda memahami sepenuhnya risiko dan pertimbangkan dengan teliti keadaan kewangan dan pengalaman dagangan anda sebelum berdagang. Cari nasihat kewangan bebas jika perlu sebelum membuka akaun dengan BCR.
BCR Co Pty Ltd (No. Syarikat 1975046) ialah syarikat yang diperbadankan di bawah undang-undang British Virgin Islands, dengan pejabat berdaftar di Trident Chambers, Wickham’s Cay 1, Road Town, Tortola, British Virgin Islands, dan dilesenkan serta dikawal selia oleh Suruhanjaya Perkhidmatan Kewangan British Virgin Islands di bawah Lesen No. SIBA/L/19/1122.
Open Bridge Limited (No. Syarikat 16701394) ialah syarikat yang diperbadankan di bawah Akta Syarikat 2006 dan berdaftar di England dan Wales, dengan alamat berdaftar di Kemp House, 160 City Road, London, City Road, London, England, EC1V 2NX. Entiti ini bertindak semata-mata sebagai pemproses pembayaran dan tidak menyediakan sebarang perkhidmatan perdagangan atau pelaburan.

 English
 简体中文
简体中文
 繁體中文
繁體中文
 Bahasa
Melayu
Bahasa
Melayu
 Tiếng
Việt
Tiếng
Việt
 ไทย
ไทย
 日本語
日本語
 한국어
한국어
 ភាសាខ្មែរ
 español