


0
US Dollar Index
The US dollar rose slightly against major currencies as investor appetite for risk assets remained subdued amid continued uncertainty surrounding the Middle East conflict. The dollar had previously strengthened significantly due to soaring oil prices caused by the war, but President Trump's suggestion that the conflict might end sooner than expected eased market concerns and pushed oil prices down, which in turn reduced buying pressure on the dollar. This reflects the foreign exchange market's direct reaction to the decline in energy prices; continued lower energy prices will alleviate inflationary pressures in major economies. Nevertheless, the market remains highly vigilant, with strategists warning that optimism about a quick resolution may be premature, and Iran has dismissed Trump's remarks as "nonsense" and vowed to continue blocking the Strait of Hormuz. In terms of specific currencies, the euro fell slightly against the dollar to around $1.1625, while the pound was also pressured by weak economic data and domestic political turmoil. Commodity currencies such as the Australian dollar and the Canadian dollar rose, with the Canadian dollar benefiting from improved risk appetite, partially offsetting the impact of falling oil prices.
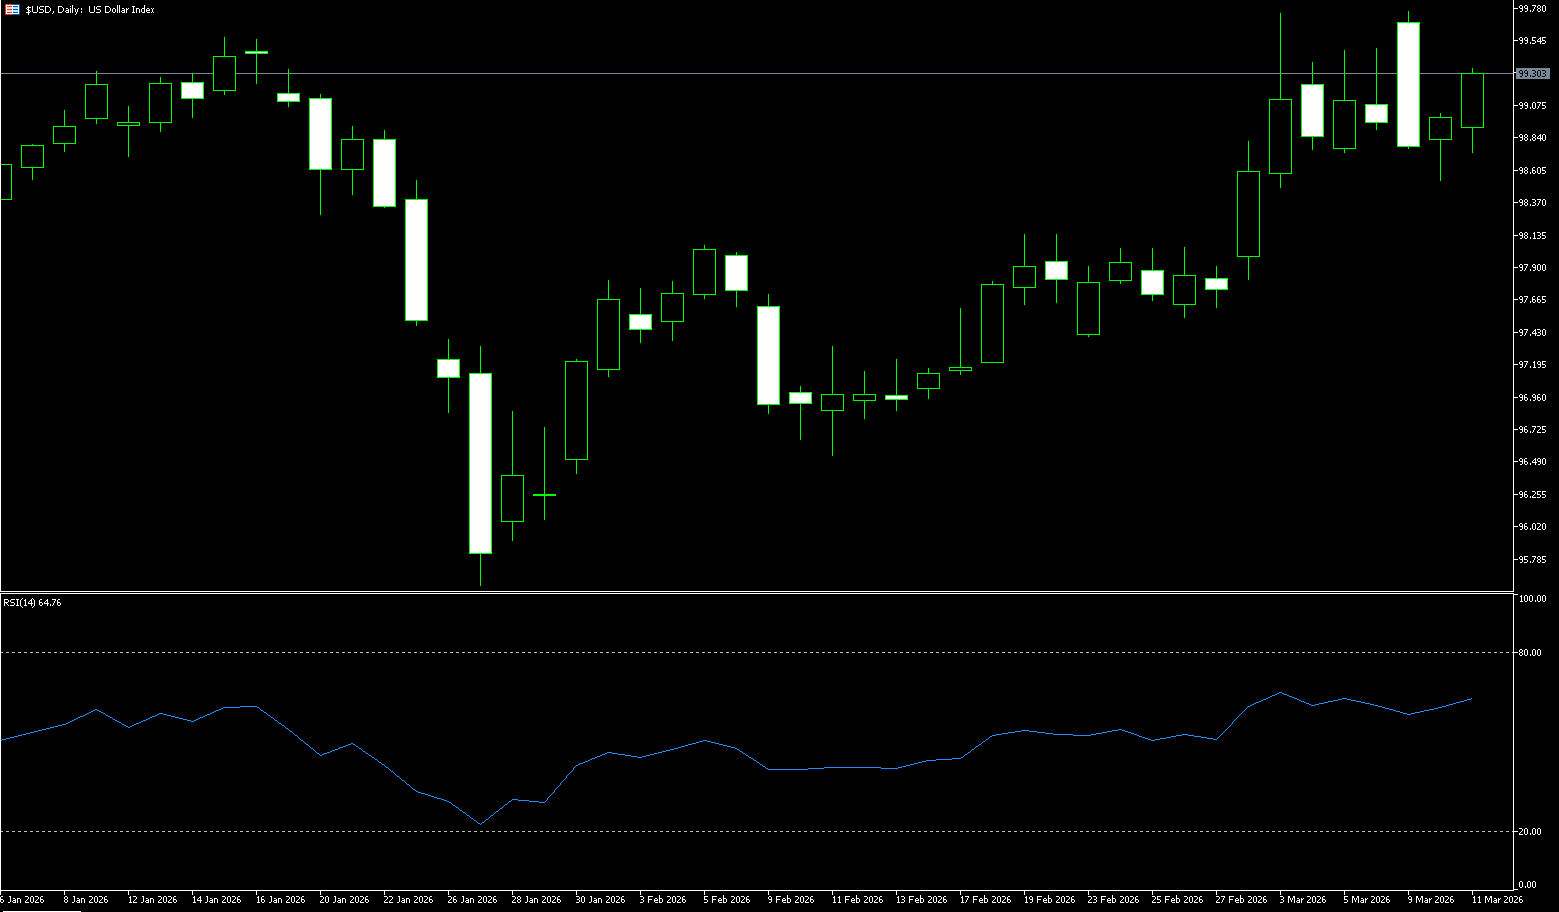
Despite the Fed's interest rates remaining relatively high, adjustments in market expectations regarding other central bank policy paths have led to a marginal narrowing of the real interest rate differential, reducing the attractiveness of the US dollar. Analysis indicates that the narrowing interest rate differential is pushing the dollar to retest the lower end of its range since June 2025. This structural change, coupled with the fading risk premium in crude oil, creates a double pressure. The daily chart shows the US dollar index has fallen from a high of 99.70 and is testing the psychological level of 98.00. The MACD indicator remains in a golden cross, but the histogram is narrowing, indicating a gradual weakening of upward momentum; the RSI (14) reading is at 60.54, in a neutral-to-bullish range and not yet in overbought territory. If the 98.39 level (14-day moving average) is effectively breached, it will open up downside potential towards the lower end of the range around 98; conversely, a sustained move above 99 could restart a rebound to 99.52 (Bollygate upper rail) and the 99.70 (previous high) area.
Today, consider shorting the US Dollar Index around 99.37; Stop loss: 99.48; Target: 98.90; 98.80
WTI Crude Oil
US crude oil traded around $89.00 per barrel on Wednesday. Prices fell to a low of around $76 per barrel on Tuesday and may test the $80 per barrel level again today, as US President Trump predicted a swift end to the war with Iran, easing market concerns about a long-term disruption to global oil supplies. As we enter the crucial mid-March window, geopolitical premiums are dominating the pricing of core assets such as crude oil, the US dollar, and gold, influenced by the ongoing "Rashomon" effect of the Iranian situation. Current market performance indicates that the market is not only digesting the sudden attacks on energy infrastructure in the past 24 hours but also betting on a possible intervention window by the new US administration. While risk aversion has not completely spiraled out of control, the delayed release of key satellite imagery data has increased information asymmetry, leading investors to exercise extreme restraint in their decision-making. This "restraint" is not indifference, but rather a vigilance against liquidity risks and a breakdown in pricing logic before a major storm.
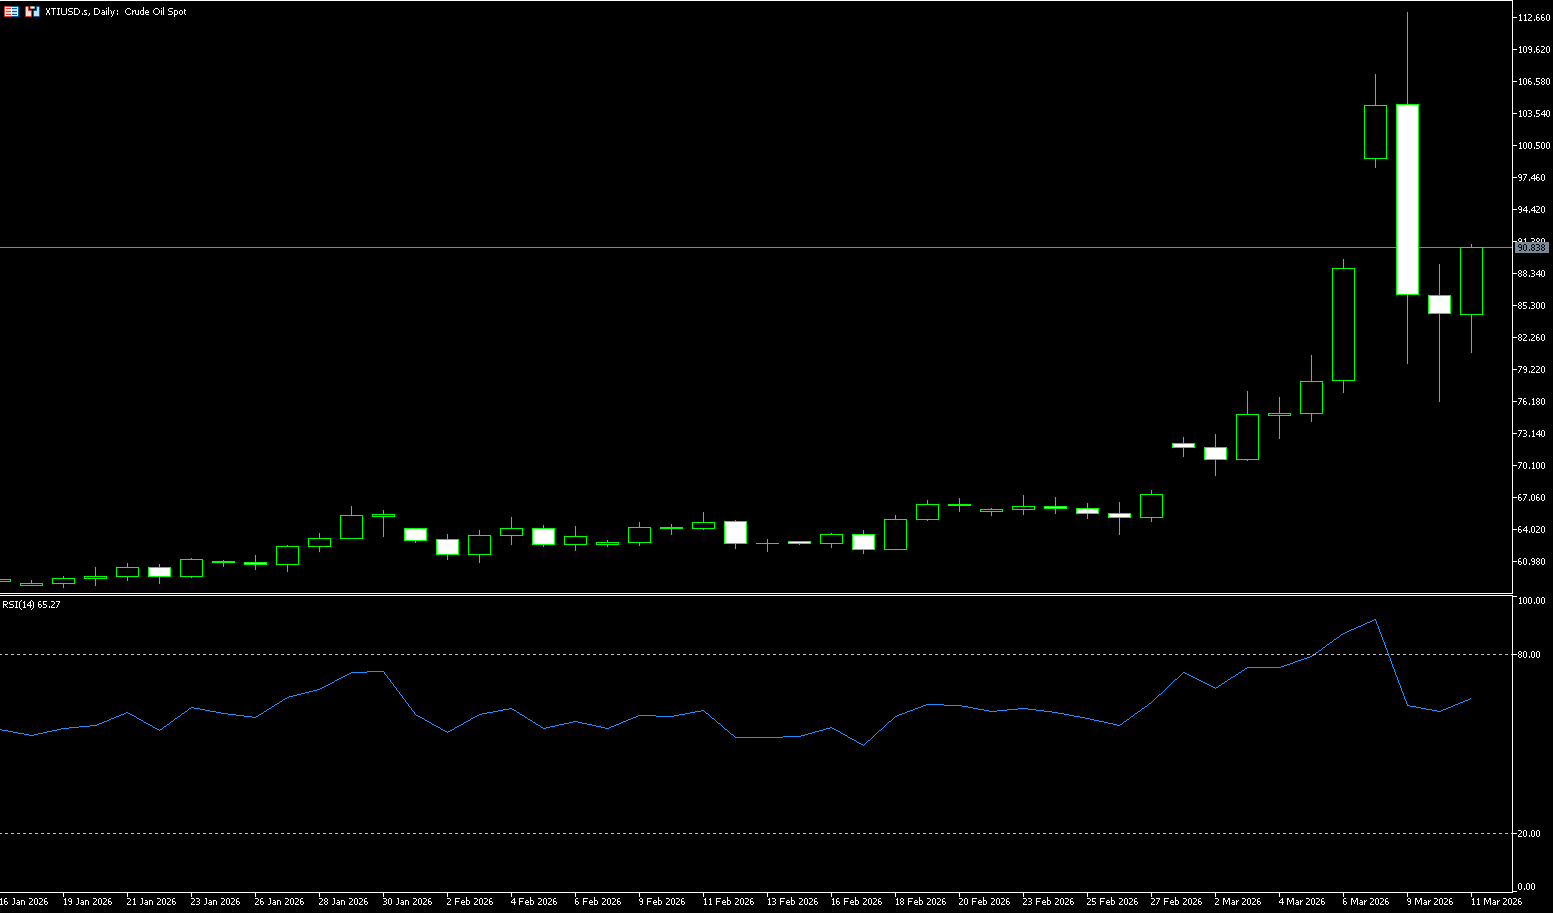
From a technical chart perspective, the crude oil market is currently in a low-level, wide-range consolidation phase following a sharp drop. The WTI crude oil futures contract fell sharply after reaching a peak of $113.28, and is currently fluctuating around $86-88 per barrel. Resistance level logic: In the short term, WTI crude oil faces significant resistance around the $90.00 (psychological level) and $92.00 levels. While the MACD histogram is shortening, the DIFF and DEA lines remain below the zero line, indicating that the bullish counterattack is still weak. The RSI indicator is currently hovering around 69, in a slightly bullish range, suggesting that the market is awaiting a clearer report on infrastructure damage. Support level prediction: Strong support lies around $80.00 (a psychological level), which coincides with the previous high of the consolidation platform. Once this level is broken by the bears, the next target will be $78.27 (the 9-day moving average).
Today, consider going long on crude oil around 88.80; Stop loss: 88.60, Target: 91.00; 92.00
Spot Gold
In early Asian trading on March 11th (Beijing time), spot gold was trading around $5,177 per ounce. Gold prices rose on Tuesday, mainly driven by a weaker dollar and easing inflation concerns; gold prices rose by more than 1%, primarily driven by a weaker dollar and easing inflation concerns. Although the conflict in the Middle East showed no signs of abating, and there were even reports of Tehran experiencing its heaviest bombing since the start of the conflict, comments from US President Trump suggesting that the Middle East war might end soon caused oil prices to plummet, which to some extent alleviated market concerns about inflation, thus weakening some of gold's appeal as a traditional hedging tool. However, the weakening dollar provided key support for gold prices, making dollar-denominated gold more attractive to holders of other currencies. Meanwhile, due to flight restrictions caused by geopolitical risks, there was a backlog of gold in the Dubai market, where it traded at a lower price than in London.
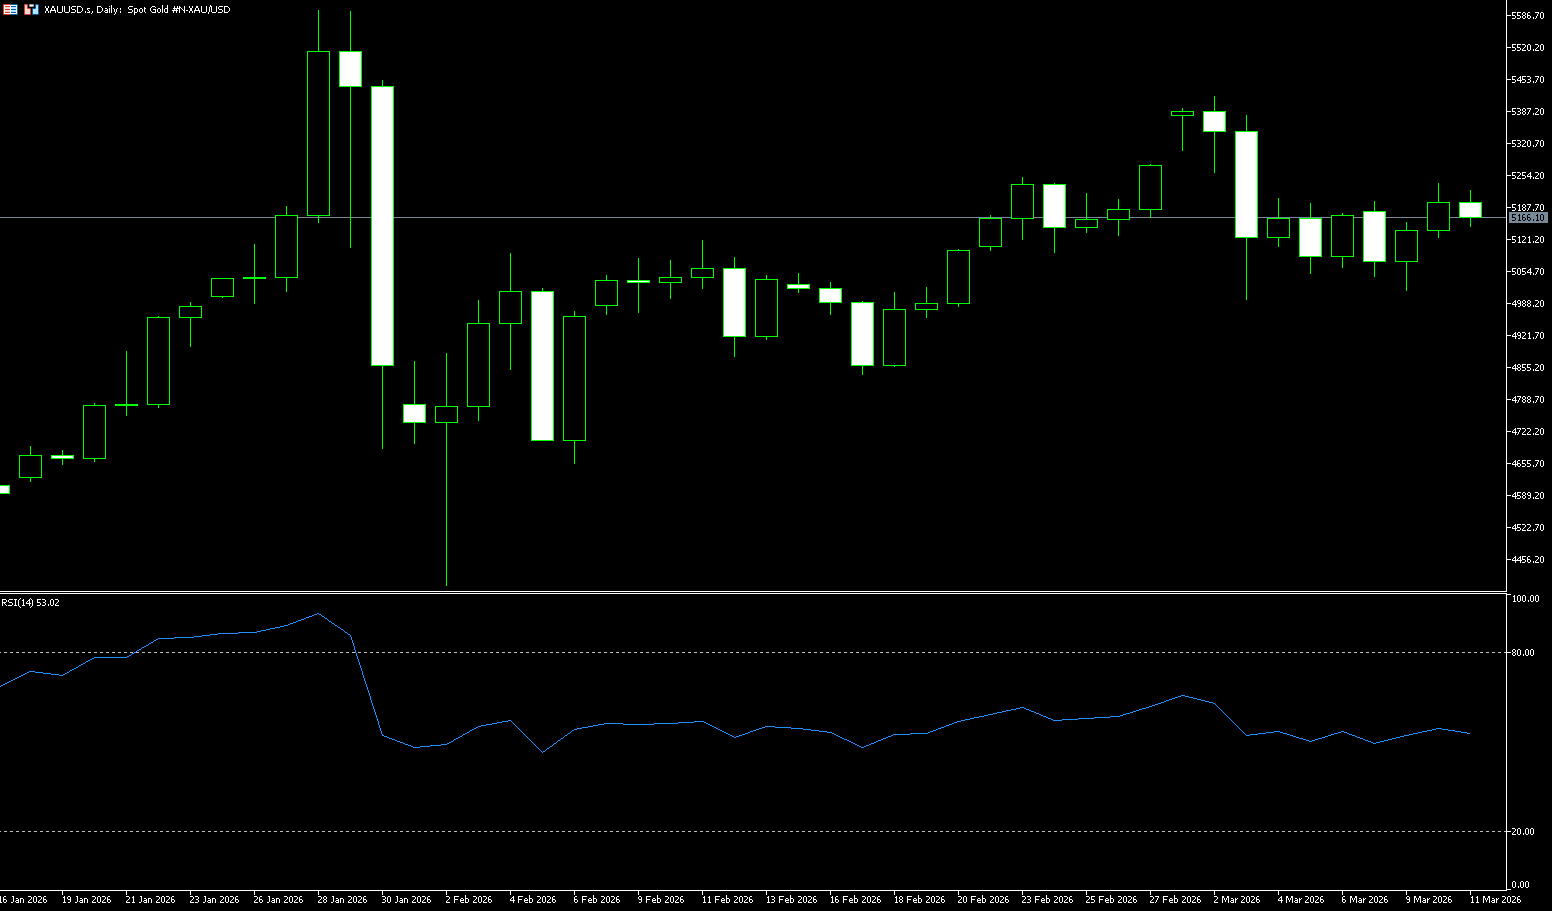
Unlike the indecisive movement of crude oil, spot gold has shown a stronger independent rebound. It is currently priced at $5,178. Technically, gold prices are currently trading along the upper Bollinger Band, exhibiting a typical rebound trend. The MACD histogram continues to expand, and the RSI is in the relatively strong range of 57.38, indicating that safe-haven funds are accelerating their inflow into the gold market to hedge against uncontrollable "black swan" risks in the geopolitical situation. Resistance level logic: Short-term resistance is at the previous high of $5,238.60. A break above this level would retest $5,300. However, this resistance level is at risk of being breached as the narrative of a potentially protracted conflict intensifies. As for support level predictions: The first support level is at the Bollinger Band midline at $5,112.50, with further support seen near the 34-day moving average at $5,076.
Consider going long on gold around 5,170 today; Stop loss: 5.165; Target: 5,230; 5,240
AUD/USD
The Australian dollar appreciated to around US$0.7150, reaching its highest level since May 2022, driven by rising expectations of an interest rate hike next week. The Reserve Bank's deputy governor stated that rising oil prices could push inflation higher, increasing pressure for a rate hike at the March 17 meeting, which he described as an "active" rate hike meeting. The market reacted quickly, doubling the probability of a rate hike to around 65%, and bets on a 25 basis point rate hike in May are now fully priced in. Overall, the market expects a tightening of around 58 basis points this year, which could bring the cash rate back to its post-pandemic peak of 4.35%, a level last seen when inflation exceeded 7%. Currently, headline inflation is at 3.8%, expected to exceed 4% as petrol prices continue to rise, while core inflation remains high at 3.4%, well above the Reserve Bank's target range of 2-3%. Elsewhere, markets remained tense due to conflicting reports of the Middle East conflict and increasing uncertainty.
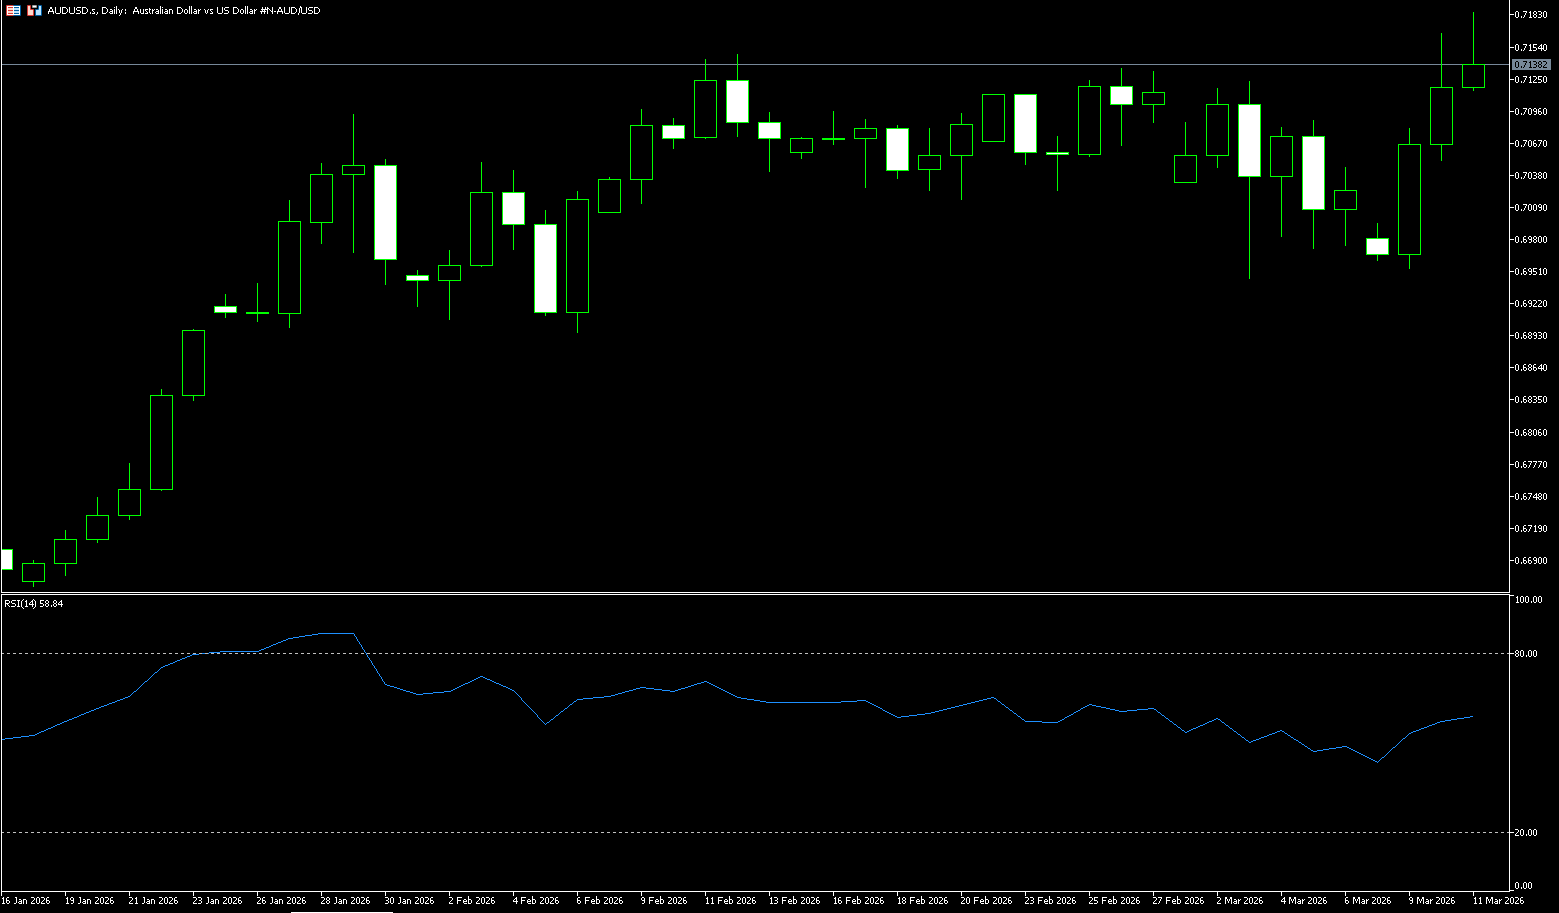
The Australian dollar rose nearly 1% on Tuesday as markets speculated that the Reserve Bank of Australia might raise interest rates at its March meeting. The AUD/USD pair traded above 0.7150, after reaching a three-year high of 0.7168. The technical outlook for AUD/USD is bullish, and after hitting its highest level since June 2022, a daily close above 0.7100 would open the door for further gains. The 14-day Relative Strength Index (RSI) shows bullish momentum, but it needs to break above the previous high of 61.93, which could open the door for further gains. If AUD/USD breaks above 0.7168, the next resistance level will be 0.7200. A break above the latter would expose the 0.7250 level, followed by the 0.7300 mark. Conversely, a break below 0.7100 would open the door for a pullback. The first support level is 0.7053, the low of March 10th, followed by the psychological level of 0.7000.
Consider going long on the Australian dollar today near 0.7143; Stop loss: 0.7133; Target: 0.7190; 0.7200
GBP/USD
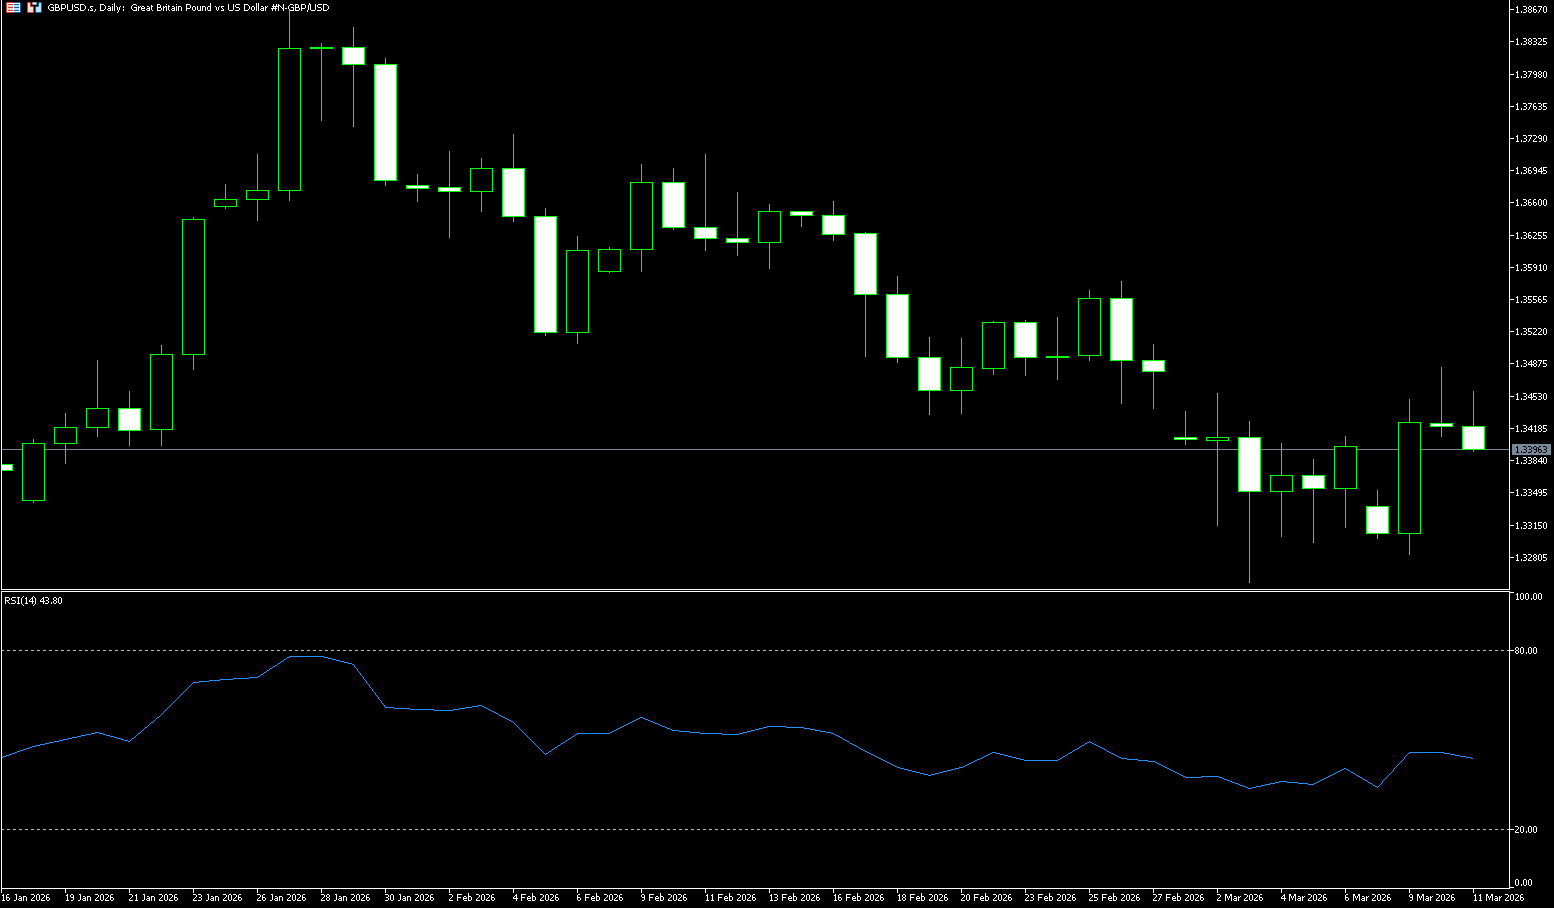
The GBP/USD pair attracted new buyers during Wednesday's Asian session, halting the previous day's pullback from the 1.3485 area, or above a one-week high. Spot prices are currently trading in the 1.3420 area. Crude oil prices retreated sharply after a significant rebound earlier this week, easing inflation concerns. This, combined with generally positive sentiment in equities, put pressure on the safe-haven dollar, which is seen as a key supporting factor for the GBP/USD pair. On the other hand, the pound benefited from the repricing of expectations for Bank of England interest rates. In fact, market bets on three Bank of England rate cuts have now been replaced by a roughly 70% probability of a rate hike by the end of the year. This provides additional support for the GBP/USD pair. However, further escalation of geopolitical tensions in the Middle East and the economic consequences of a closure of the Strait of Hormuz could support the US dollar's status as the global reserve currency. This could discourage traders from making aggressive bullish bets on the GBP/USD pair and limit its upside potential.
Intraday movement above the lower Bollinger Band at 1.3308 is considered a key trigger for GBP/USD bulls, although the subsequent rally stalled near the 200-day moving average at 1.3442. Therefore, it would be prudent to wait for some sustained buying above the psychological level of 1.3500 before moving further towards the 50-day simple moving average and converging on the February 24 high in the 1.3526–1.3535 area. Momentum signals support the upside: The MACD line has crossed above its signal line in positive territory, accompanied by a moderately widening bar, while the Relative Strength Index (RSI) remains around 46.29, indicating solid but not excessive bullish momentum. On the downside, initial support lies at the psychological level of 1.3400, followed by stronger support at 1.3350, where the recent consolidation base aligns with the latest pullback low. This would weaken the current upside bias and target the 1.3300 area.
Consider going long on GBP/USD around 1.3400 today; Stop loss: 1.3385, Target: 1.3450; 1.3460
USD/JPY
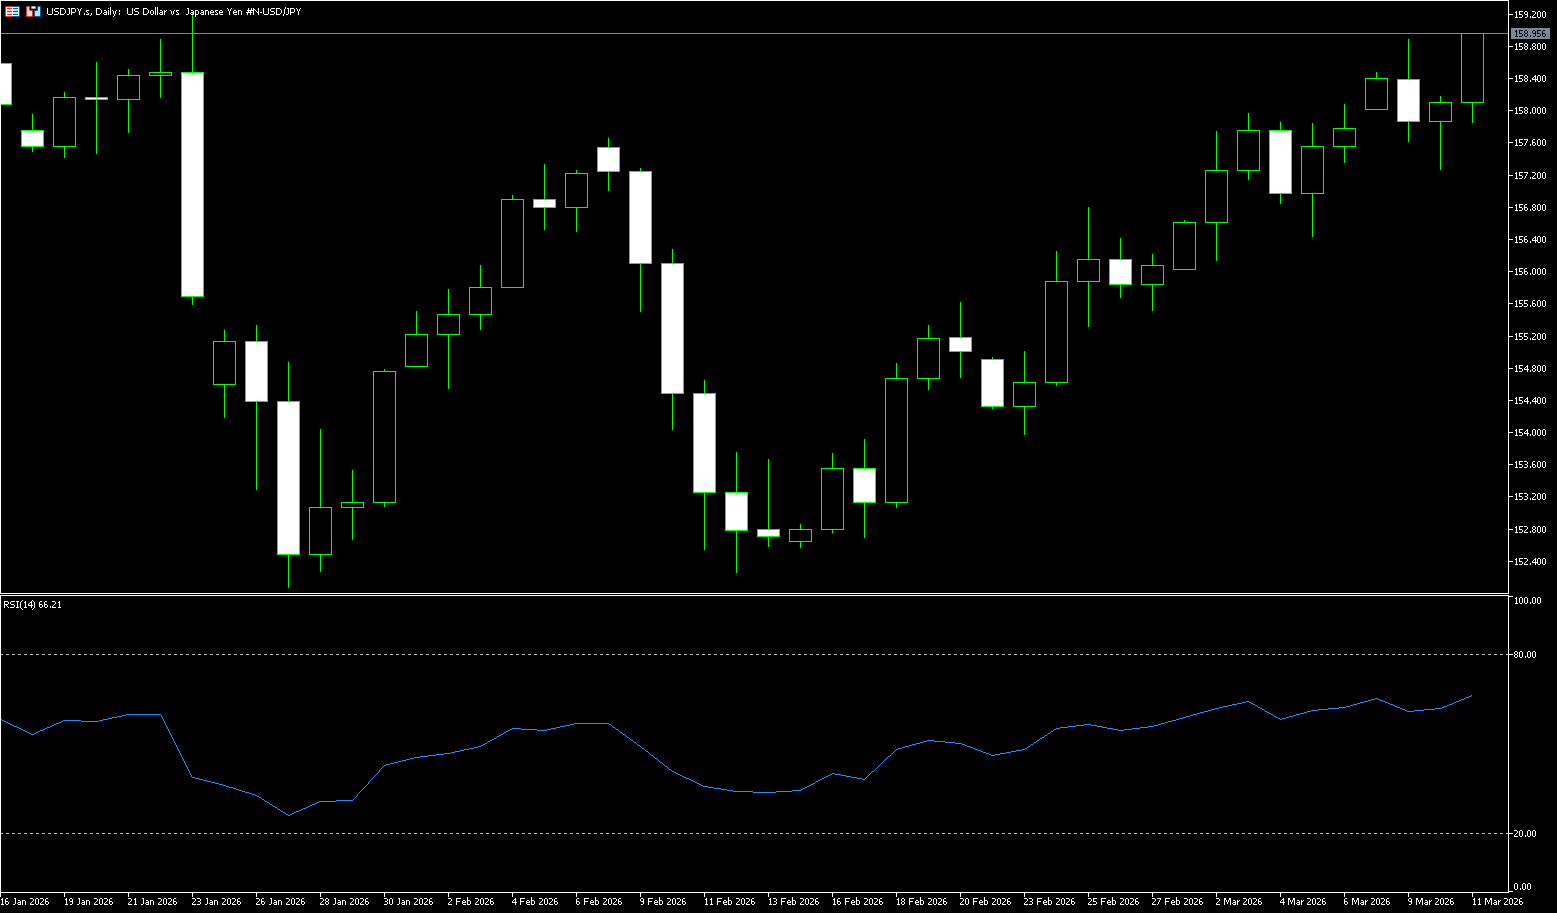
The yen continued to weaken on Wednesday, falling to over 158.90 per dollar, as heightened uncertainty surrounding the Middle East conflict continued to support the dollar. The Trump administration sent mixed signals regarding the war with Iran, with President Trump suggesting the conflict could end soon, while senior officials indicated military action was escalating and diplomatic negotiations remained unlikely. Iran's Revolutionary Guard dismissed Trump's claims, warning the blockade would continue until attacks by the US and Israel ceased. Meanwhile, oil prices fell further after the International Energy Agency (IEA) proposed the largest release of oil reserves in history to help stabilize the market. Japan, heavily reliant on energy imports, is highly vulnerable to oil price shocks, but the country is prepared to use emergency reserves to offset supply risks. Meanwhile, data showed Japanese producer prices rose 2% in February, the most modest increase in nearly two years.
The technical picture is slightly bearish, with USD/JPY forming a shooting star candlestick pattern on Monday. Despite Tuesday's bullish candlestick pattern, selling pressure pushed prices down to a three-day low of 157.27, opening the door for further downside. The 14-day Relative Strength Index (RSI) shows buyers gathering strength, approaching overbought territory. If USD/JPY resumes its uptrend, the first area to watch will be the March 9 high of 158.90. A break above this level would place the pair within the potential intervention range of Japanese authorities and the Bank of Japan, around 159.45 (January 14) and 160.00 (a psychological level). Conversely, if sellers intervene, pushing USD/JPY below 158.00, it would clear the way for further downside. The next area to watch will be 157 (a psychological level), the March 5 swing low of 156.46, followed by the March 5 swing low of 156.46 and the 50-day simple moving average level of 156.23.
Today, consider shorting the US dollar around 159.10; Stop loss: 159.30; Target: 158.00; 157.90
EUR/USD
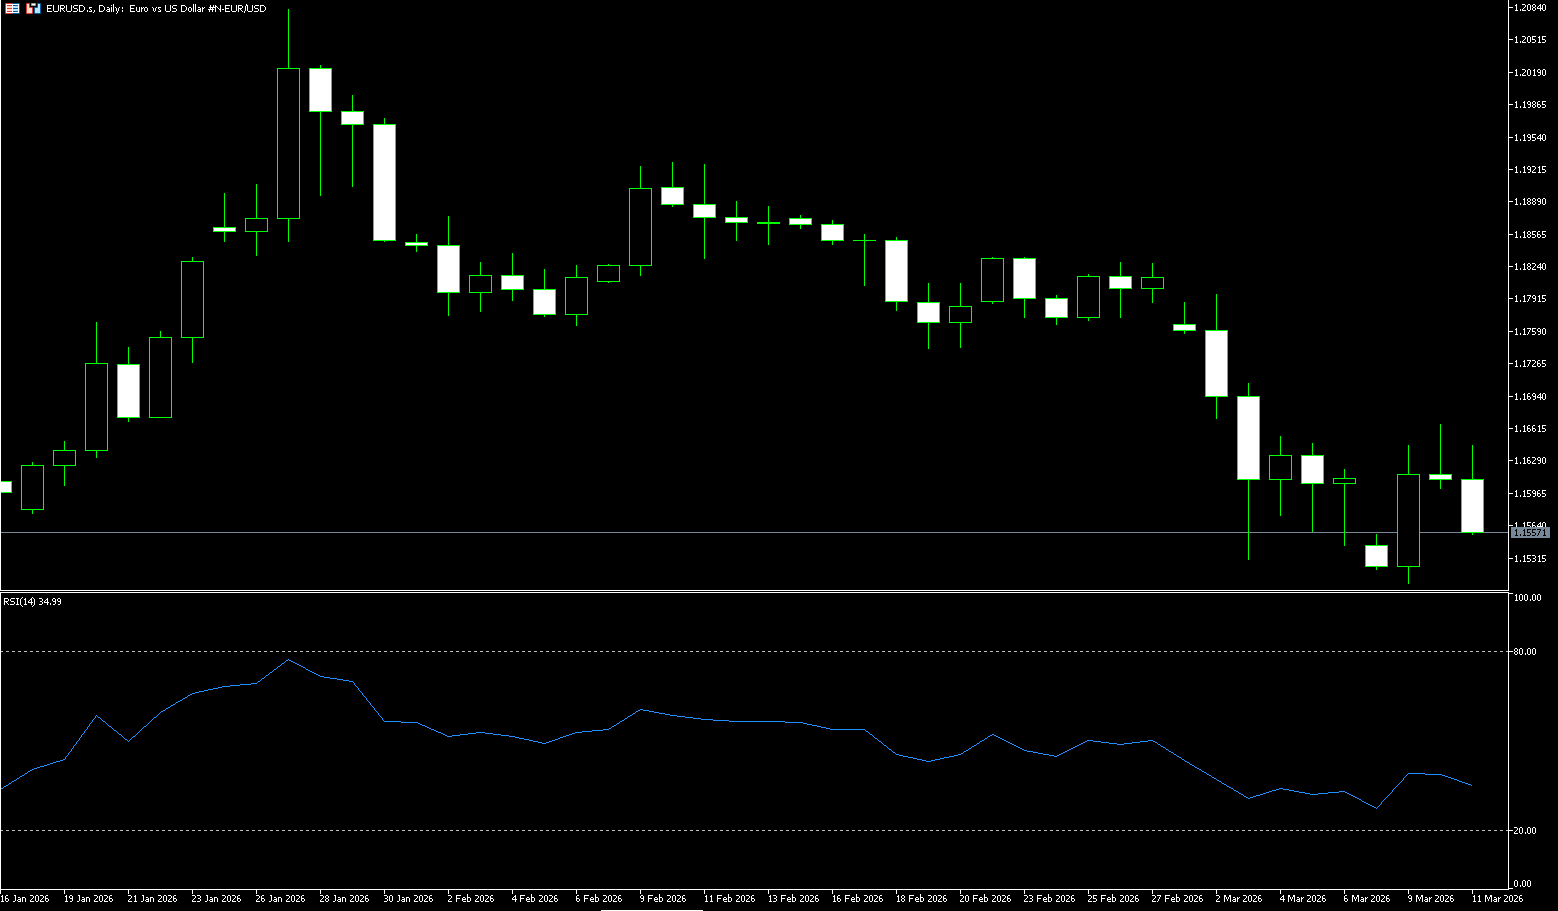
In early Asian trading on Wednesday, the euro/dollar pair maintained a positive trend around 1.1570. The euro rebounded from a four-month low of 1.1507 against the dollar as safe-haven demand eased. US President Donald Trump stated on Tuesday that the conflict was “very complete, essentially” and that military action was “far beyond” the initial four-to-five-week timeframe, Bloomberg reported. His comments eased concerns about the ongoing Middle East conflict and improved market sentiment. However, Trump did not provide a clear timetable for halting the attacks that have shaken markets in the Middle East and globally, so uncertainty remains. Meanwhile, the Israel Defense Forces announced a new round of strikes against Iran and launched more missiles into Lebanon. The Israeli military stated that the targets were infrastructure belonging to the Iranian-backed Hezbollah south of the Lebanese capital. Signs of continued tension in the Middle East could increase safe-haven demand for the dollar and put resistance on this major currency pair.
On the daily chart, EUR/USD is trading at 1.1570. The short-term bias is slightly bearish, as the spot price has broken below the 50-day and 100-day simple moving averages, which are now limiting upside around 1.1755–1.1696, while the rising 200-day simple moving average is around 1.1676 above the price but has lost its immediate impact. The 14-day Relative Strength Index (RSI) remains around 37.13, indicating continued downward momentum after the recent decline, while the Average Directional Index (ADX) has risen back to 30, suggesting that trend conditions in favor of sellers are strengthening rather than a range-bound phase. Initial resistance is seen at 1.1700 (the psychological level), and a break above this area would help alleviate bearish pressure and open the way for resistance at 1.1755 (the 50-day simple moving average). On the downside, immediate support is at 1.1546 (lower Bollinger Band). A decisive break below this level would expose the support zone below 1.1500.
Consider going long on the Euro today around 1.1560; Stop loss: 1.1550; Targets: 1.1620, 1.1630
Disclaimer: The information contained herein (1) is proprietary to BCR and/or its content providers; (2) may not be copied or distributed; (3) is not warranted to be accurate, complete or timely; and, (4) does not constitute advice or a recommendation by BCR or its content providers in respect of the investment in financial instruments. Neither BCR or its content providers are responsible for any damages or losses arising from any use of this information. Past performance is no guarantee of future results.
Lebih Liputan


Pendedahan Risiko:Instrumen derivatif diniagakan di luar bursa dengan margin, yang bermakna ia membawa tahap risiko yang tinggi dan terdapat kemungkinan anda boleh kehilangan seluruh pelaburan anda. Produk-produk ini tidak sesuai untuk semua pelabur. Pastikan anda memahami sepenuhnya risiko dan pertimbangkan dengan teliti keadaan kewangan dan pengalaman dagangan anda sebelum berdagang. Cari nasihat kewangan bebas jika perlu sebelum membuka akaun dengan BCR.
BCR Co Pty Ltd (No. Syarikat 1975046) ialah syarikat yang diperbadankan di bawah undang-undang British Virgin Islands, dengan pejabat berdaftar di Trident Chambers, Wickham’s Cay 1, Road Town, Tortola, British Virgin Islands, dan dilesenkan serta dikawal selia oleh Suruhanjaya Perkhidmatan Kewangan British Virgin Islands di bawah Lesen No. SIBA/L/19/1122.
Open Bridge Limited (No. Syarikat 16701394) ialah syarikat yang diperbadankan di bawah Akta Syarikat 2006 dan berdaftar di England dan Wales, dengan alamat berdaftar di Kemp House, 160 City Road, London, City Road, London, England, EC1V 2NX. Entiti ini bertindak semata-mata sebagai pemproses pembayaran dan tidak menyediakan sebarang perkhidmatan perdagangan atau pelaburan.

 English
 简体中文
简体中文
 繁體中文
繁體中文
 Bahasa
Melayu
Bahasa
Melayu
 Tiếng
Việt
Tiếng
Việt
 ไทย
ไทย
 日本語
日本語
 한국어
한국어
 ភាសាខ្មែរ
 español