


0
The US Dollar Index
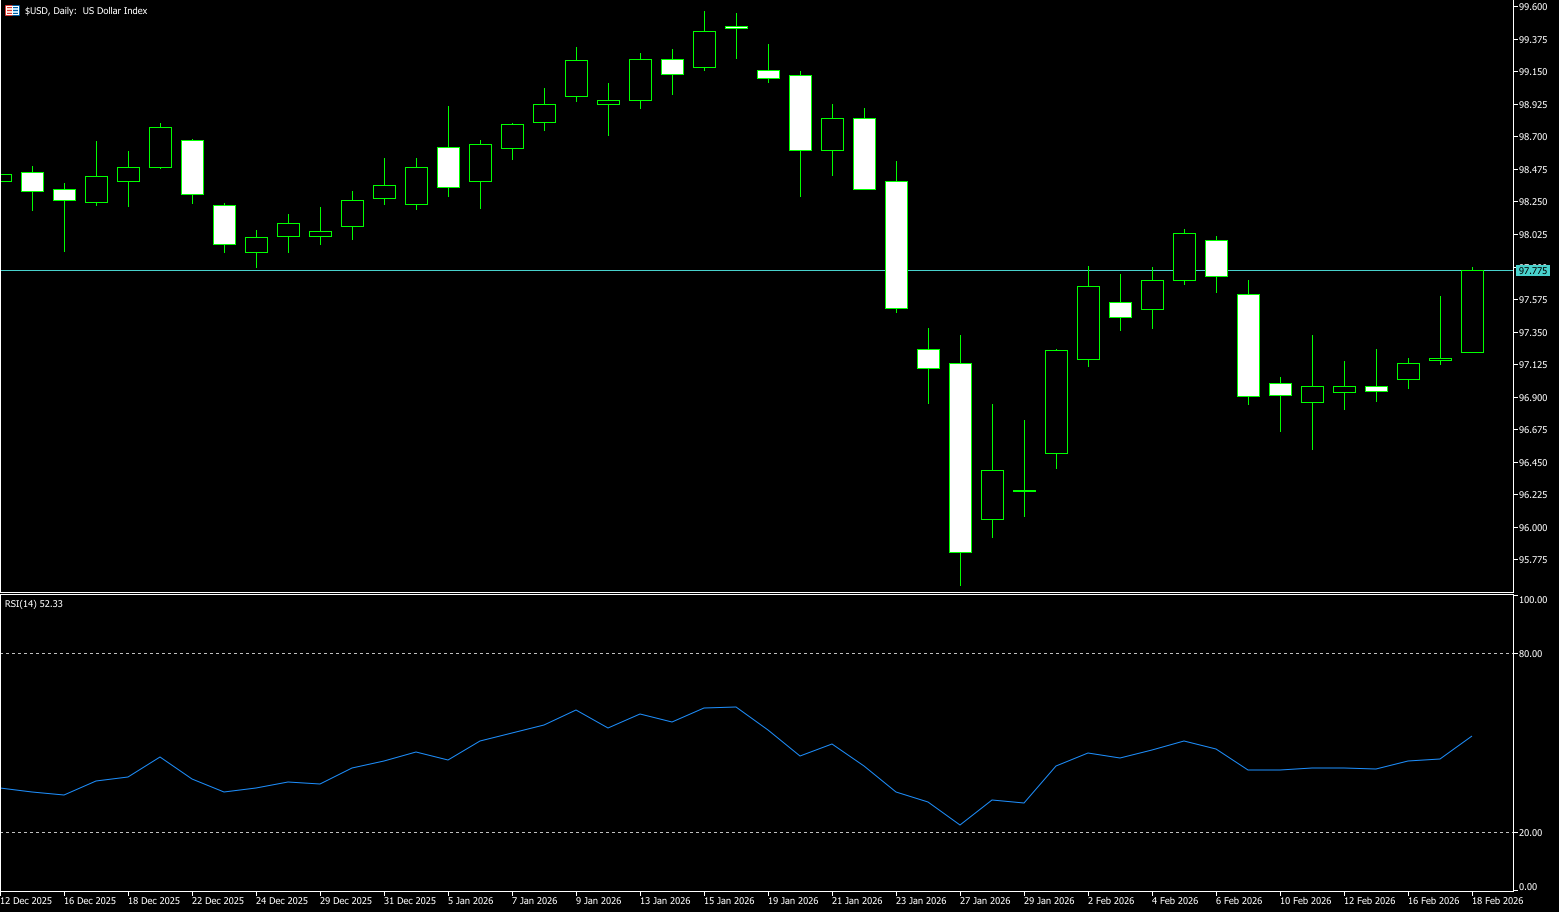
The US dollar index rose above 97.70 on Wednesday, extending its upward momentum since hitting a near four-year low of 96 at the end of February, as global markets reconsidered their aversion to the dollar and lowered expectations for the extent of Federal Reserve rate cuts this year. Minutes from the Fed's last meeting showed that many members believed the deleveraging process could take longer than previously anticipated, with a few even suggesting that rate hikes might be necessary to prevent inflation from stabilizing above the 2% target. The delayed January Consumer Price Index reflected an annual growth rate of 2.4%, lower than expected but still firmly above the target. Meanwhile, aversion to dollar-denominated assets eased from its peak at the end of January, driven by signs of improved US-EU relations and the nomination of Kevin Warsh as Fed chairman (a hawkish supporter of balance sheet reduction). The dollar index was also supported by weakness in the pound, yen, and Canadian dollar.
From the 4-hour chart, the dollar index has formed a V-shaped reversal. After rebounding from the low of 95.56, it has recently closed with consecutive small positive candles, showing a steady pace and indicating active buying at lower levels. The price is currently trading above the Bollinger Bands' middle line at 97.08 and upper line at 97.35, indicating a short-term bullish consolidation pattern. On the other hand, the US dollar index has stabilized above its 40-period moving average (96.94), with short-term moving averages trending upwards, suggesting bullish momentum is dominant and mitigating the risk of a rapid pullback. The MACD indicator shows both lines crossing above the zero line, with the red bars continuing to expand, indicating that bullish momentum is accumulating, but the rebound has not yet entered a strong phase, suggesting that more catalysts are needed to drive the upward movement. The first resistance level to watch is 97.76 (last week's high); followed by the 98.00 level. Support is initially seen at the middle Bollinger Band at 97.51 (the 25-day moving average); a break below this level could lead to a test of the 97.00 level (a psychological level).
Today, consider shorting the US Dollar Index around 97.82; Stop loss: 97.93; Target: 97.40; 97.30
WTI Crude Oil
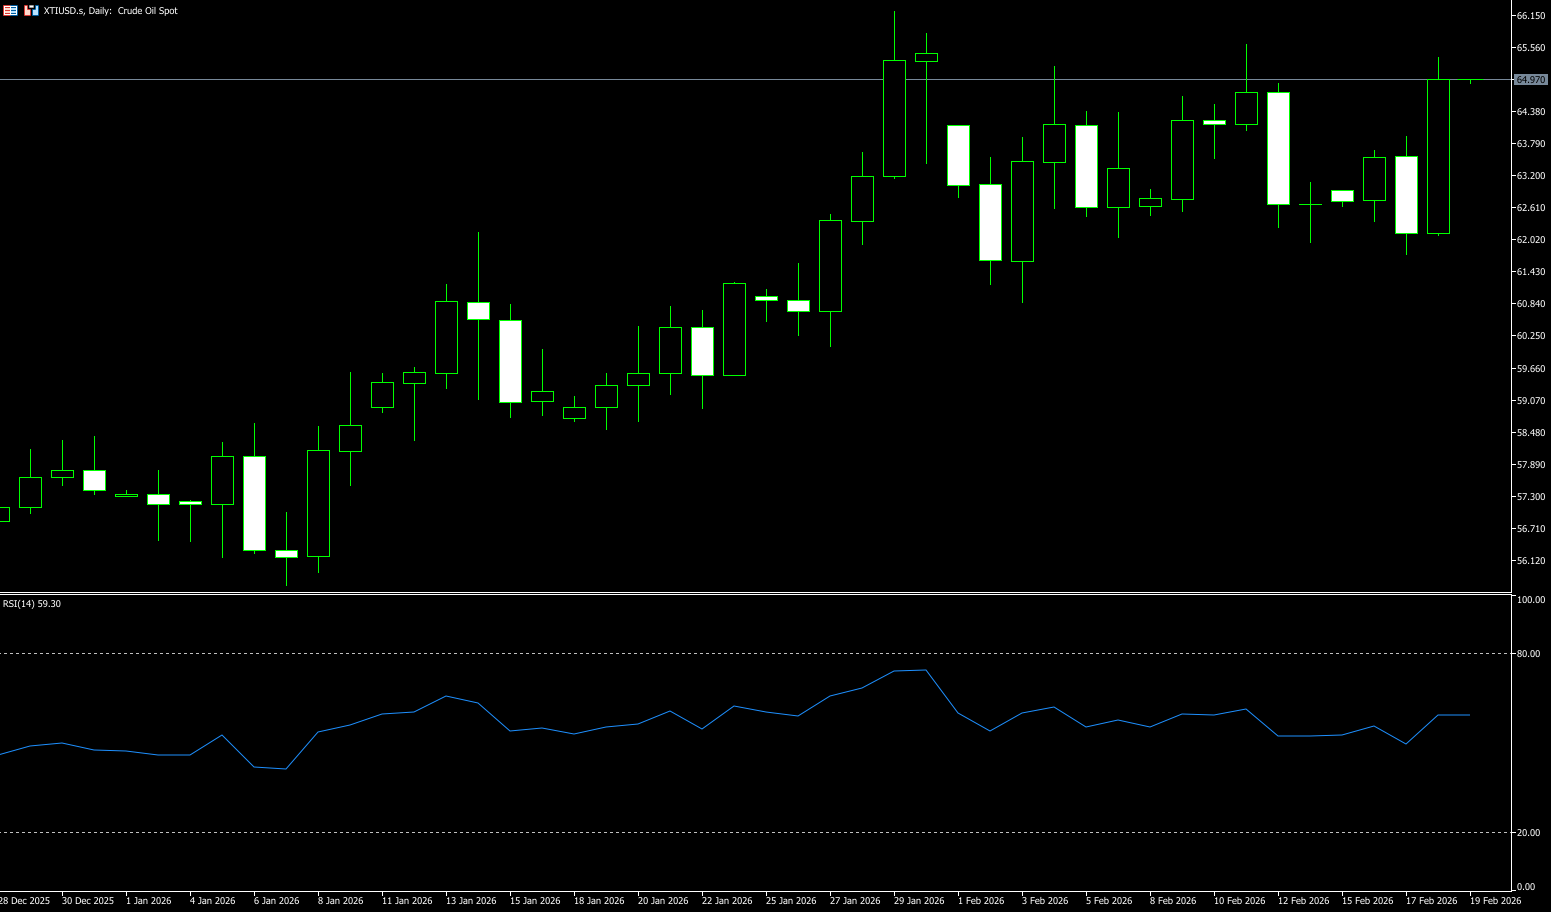
WTI crude oil futures rose more than 4%, breaking through $65.2 per barrel and testing monthly highs. Despite mixed production signals, tightening supply and strong Asian demand squeezed the physical market. The International Energy Agency's latest monthly report showed that winter shutdowns and export restrictions reduced global supply by approximately 1.2 million barrels per day in January. Meanwhile, strong demand from China and India absorbed the additional barrels, reducing available export flows. Renewed geopolitical tensions in the Middle East, including disruption risks around the Strait of Hormuz, have contributed a substantial premium to prices due to threats to key seaborne crude oil transport routes. On the other hand, OPEC+ is considering a gradual increase in production starting in April, while initial steps to resume Venezuelan exports are unlikely to provide immediate volume due to licensing and logistical constraints.
In the short term, oil prices are likely to continue their upward trend or stabilize briefly within a support range. However, the long-term downward trend is unlikely to reverse, and the global oversupply remains the core issue. The 14-day Relative Strength Index (RSI) is above the midline {58} but is showing a downward turn, which may provide slight support for oil prices. On the downside, the first support level is the main support range: $61.29 {34-day simple moving average} - $61.00 (a psychological level). Currently, oil prices are still above this range; a break below would open further downside potential to $60.00 {a psychological level}. Upside expectations are weak, with short-term resistance levels at $66.27 {the upper trendline of the daily chart's Bollinger Bands} and the $67.00 {psychological level} area.
Today, consider going long on crude oil around 65.00; stop loss: 64.85, target: 66.50; 66.70
Spot Gold
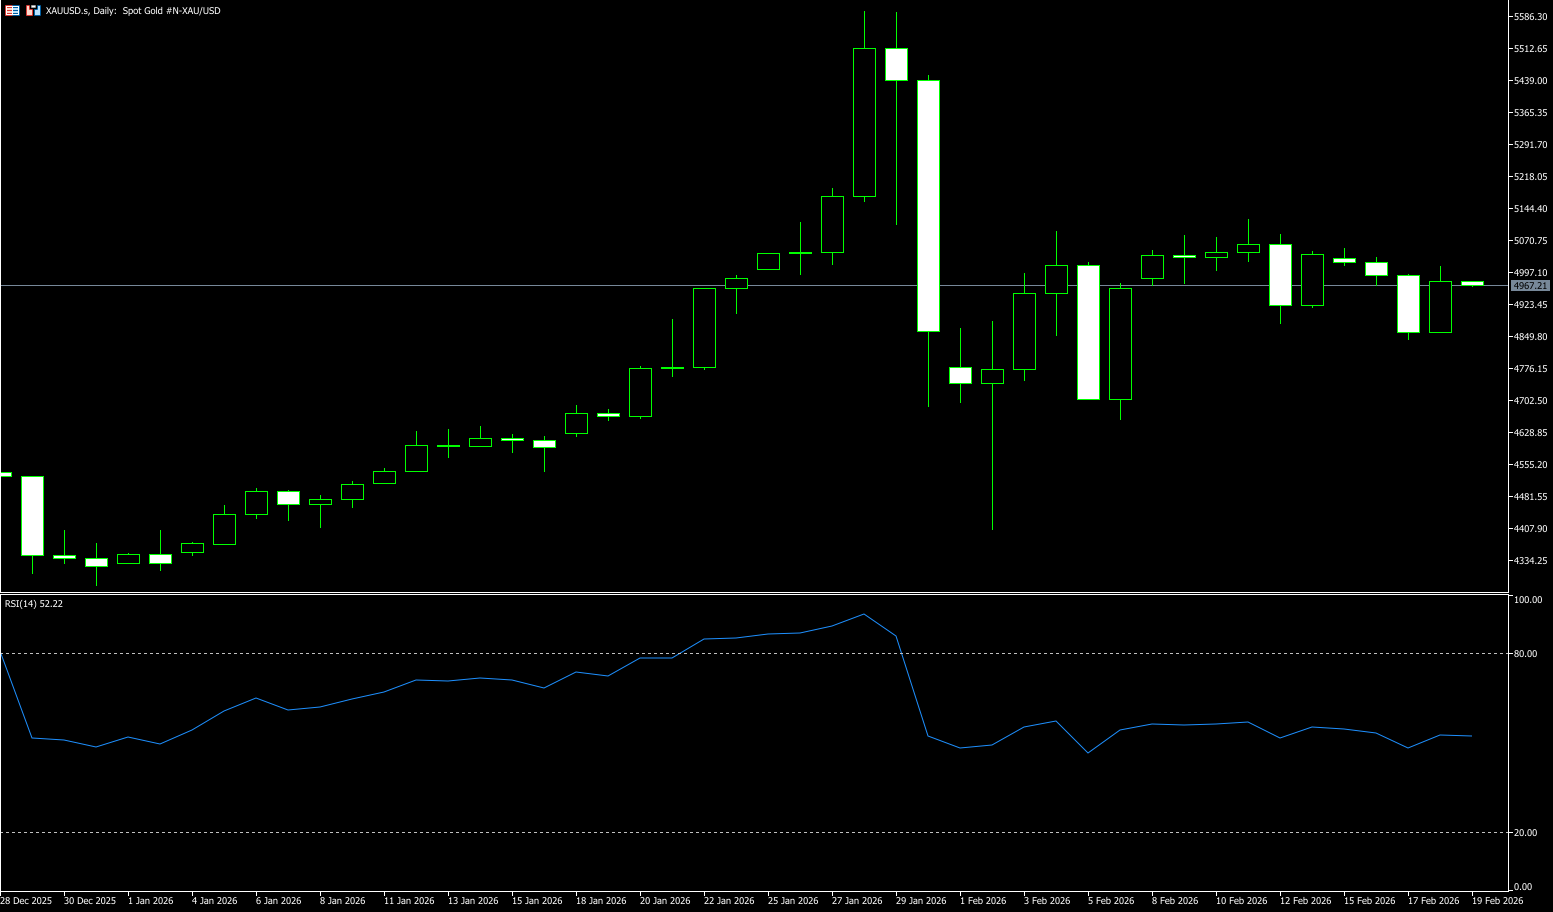
On Wednesday, gold prices traded at $4,990 per ounce, extending gains as investors digested the latest Federal Open Market Committee (FOMC) meeting minutes and readjusted their expectations for U.S. monetary policy. The FOMC minutes revealed a divergence of opinion among participants, with some considering rate cuts during the deleveraging process, while others favored maintaining or tightening policy given persistent inflation. Fed Governor Michael Barr favored keeping rates unchanged for some time, while Chicago Fed President Austan Goolsby indicated that future rate cuts were possible if data allowed. Despite the Fed keeping benchmark interest rates unchanged at 3.5%-3.75% and stating that progress toward the 2% target could be slower and more uneven, the market is still pricing in a data-dependent path, leaving room for easing later this year. This ambiguity maintains gold's appeal as a hedge against policy missteps and macroeconomic uncertainty, even as improved risk sentiment in the stock market and ongoing geopolitical negotiations have lessened the urgency for safe-haven inflows.
Gold is currently caught in a triple battle between the Fed's policy pace, the geopolitical situation in Iran and Ukraine, and short-term consolidation does not change the medium-term support logic. This week is a key data week; the Fed meeting minutes and subsequent macroeconomic data will provide clear direction. From a trading perspective, it is crucial to focus on policy signals and geopolitical developments, and to capitalize on trend opportunities after consolidation breakouts. From a technical perspective, spot gold has broken below $5,000 (a psychological level) and $4,955 (the 6.18% Fibonacci retracement level of the recent rise), indicating an overall bearish trend. The market is betting on a de-escalation of tensions between the US and Iran, and negative factors such as non-PCE growth. Going forward, attention should be paid to the support levels at the 34-day moving average of $4,821 and the psychological level of $4,800. Resistance levels are at $4,994 (the 20-day simple moving average), $5,000 (a psychological level), and then $5,100.50 (the high from February 12th).
Consider going long on gold around 4,975 today; Stop loss: 4,970; Target: 5,050; 5,070
AUD/USD
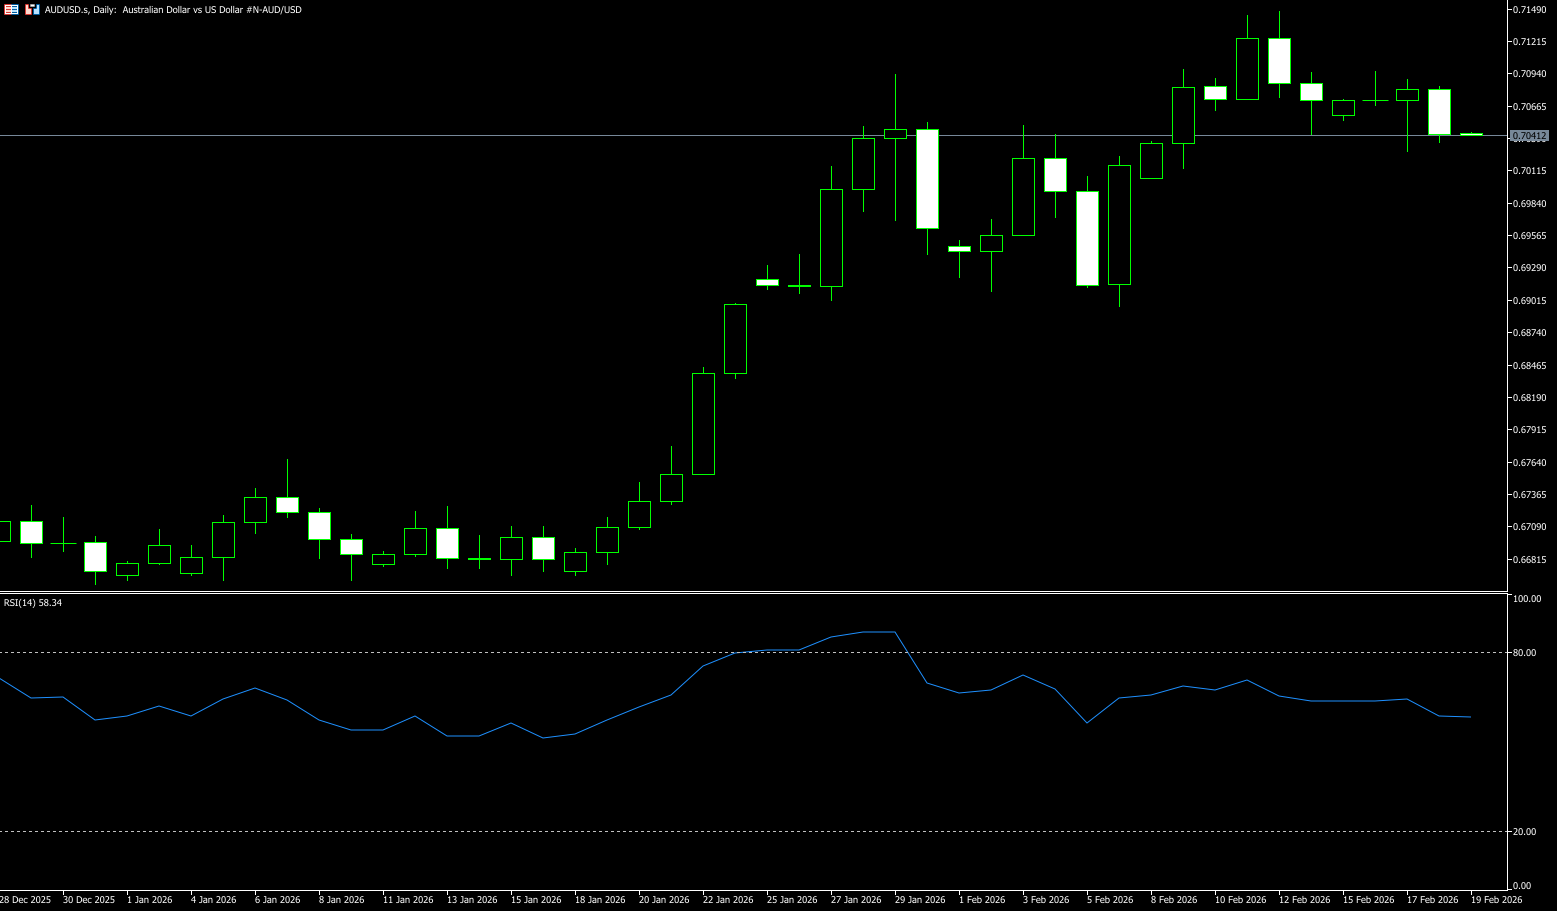
The Australian dollar dipped slightly below US$0.71 on Wednesday but remained near three-year highs as investors continued to assess the central bank's recent meeting minutes, with strong wage growth highlighting persistent inflationary pressures. Data showed that annual wage growth rose 3.4% in the December quarter, with public sector wages growing faster than private sector wages for the fourth consecutive quarter. These figures underscored the continued tightness in the labor market and reinforced the inflation challenges facing the Reserve Bank following its recent rate hike. Meanwhile, the recent RBA meeting minutes mentioned a "significant change" in inflation risks, justifying the recent rate hike to 3.85%. While the board did not commit to further rate hikes, high inflation and accommodative financial conditions increased the likelihood of another rate increase. Focus now shifts to Thursday's January employment data and the fourth-quarter GDP report early next month, which could provide further guidance on the RBA's policy outlook ahead of its March meeting.
From a technical perspective, the AUD/USD pair rebounded from the 100-period simple moving average on the 4-hour chart mid-week, which is currently near the 0.7040 area. The 100-period moving average is trending upwards, and AUD/USD is holding above it, maintaining a short-term positive bias. Furthermore, the MACD indicator is hovering near zero with narrowing negative values, suggesting easing bearish pressure. Additionally, the Relative Strength Index (RSI) is at 49 (neutral) and slightly rising, consistent with the stable tone. As long as the AUD/USD pair remains above the dynamic support of the rising moving averages, the bullish tone will continue, and any pullbacks are expected to remain within a manageable range. Immediate resistance lies at 0.7100 (the psychological level), and a sustained hold above these levels, followed by 0.7147 (the February 12 high), would open the way to the psychological resistance at 0.7200. Support is found at the 0.7015 (20-day simple moving average) and 0.7000 (psychological level) areas, providing initial support levels.
Consider going long on the Australian dollar today near 0.7030; Stop loss: 0.7020; Target: 0.7080; 0.7090
GBP/USD
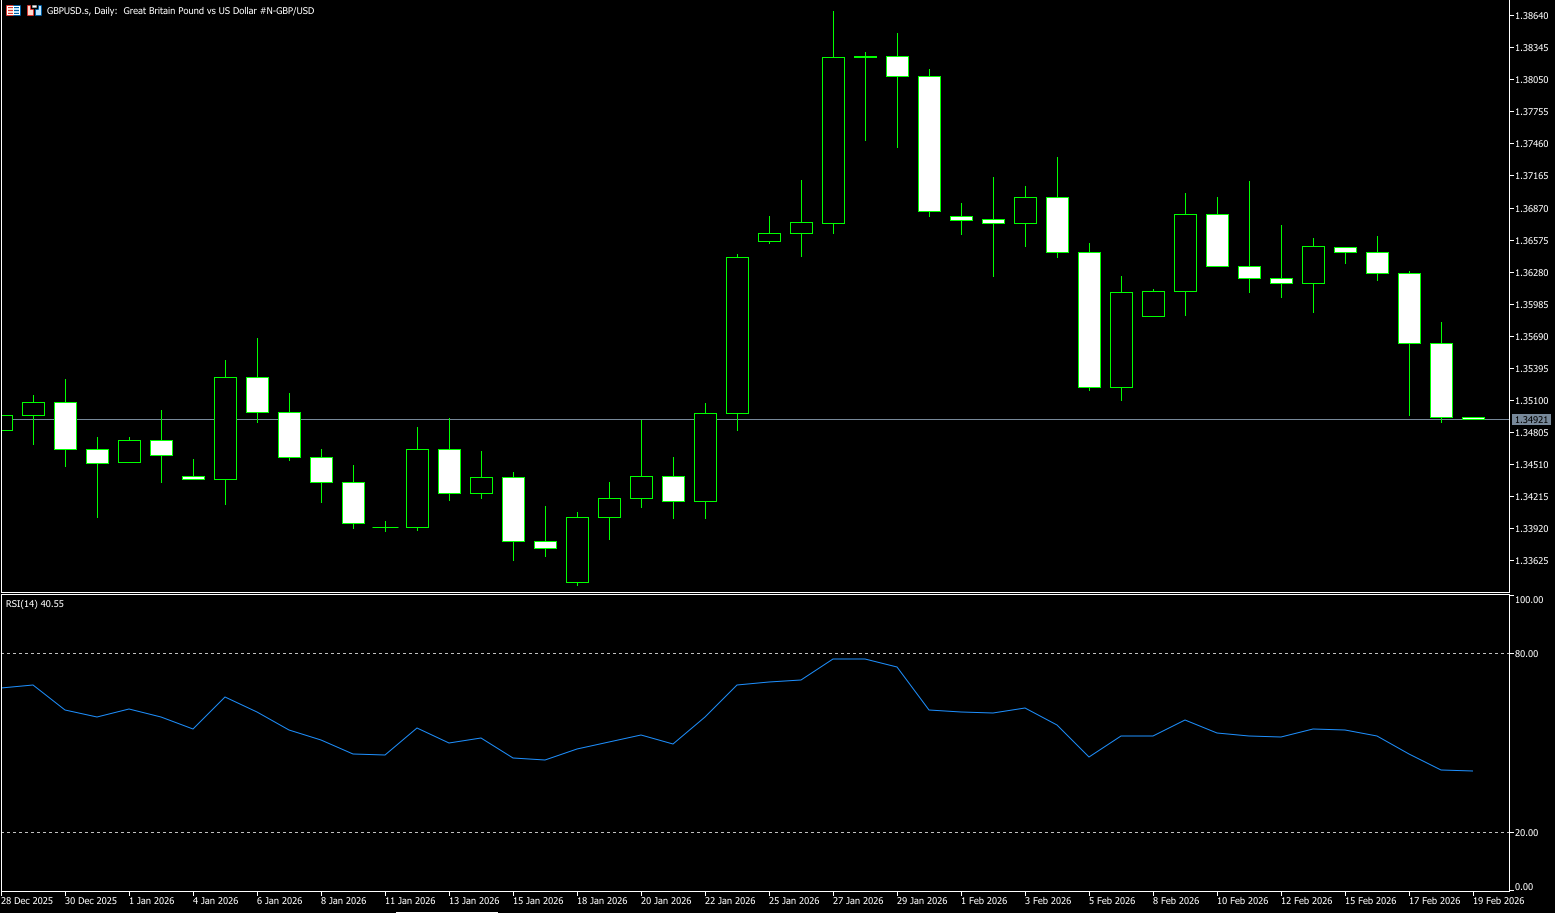
GBP/USD reversed its initial upward momentum and is now extending its previous decline, approaching the 1.3500 area on Wednesday. The pound's decline was based on a robust dollar and slowing UK inflation data, which appears to strengthen the case for a Bank of England rate cut in March. GBP/USD continued to trade negatively biased on Wednesday, struggling to capitalize on the previous day's rebound from a more than one-week low (below the psychological level of 1.3500), marking the third consecutive day of negative movement. However, downside risks remain somewhat supported as investors seem reluctant to make aggressive directional bets ahead of the latest UK consumer inflation data and the release of the FOMC meeting minutes. However, downside remains limited as investors appear reluctant to make aggressive directional bets ahead of the latest UK consumer inflation data and the release of the FOMC meeting minutes. Meanwhile, Tuesday's disappointing UK jobs report reaffirmed market bets on a Bank of England rate cut in March and continued to weaken the pound.
On the 4-hour chart, a break below the 200-period simple moving average at 1.3565 is considered a key trigger for bearish traders in GBP/USD. The MACD histogram is in negative territory but contracting, indicating the MACD line is below the signal line, and both are hovering near the zero line. The Relative Strength Index (RSI) is at 36 (bearish), recovering from oversold conditions. Meanwhile, the 200-period simple moving average is rising modestly, but the GBP/USD pair remains capped by this dynamic resistance. The short-term bias remains heavy, with the spot price holding below the 200-period simple moving average. In other words, a break above the aforementioned resistance would improve momentum towards the 1.3600 (psychological level) and the 1.3654 (20-day simple moving average) area. If GBP/USD is rejected here, sellers could continue to pressure the market towards the 1.3500 (psychological level) and 1.3495 (Tuesday's low), then targeting the 1.3443 (200-day simple moving average) level.
Consider going long GBP/USD near 1.3486 today; Stop loss: 1.3475; Target: 1.3550; 1.3560
USD/JPY
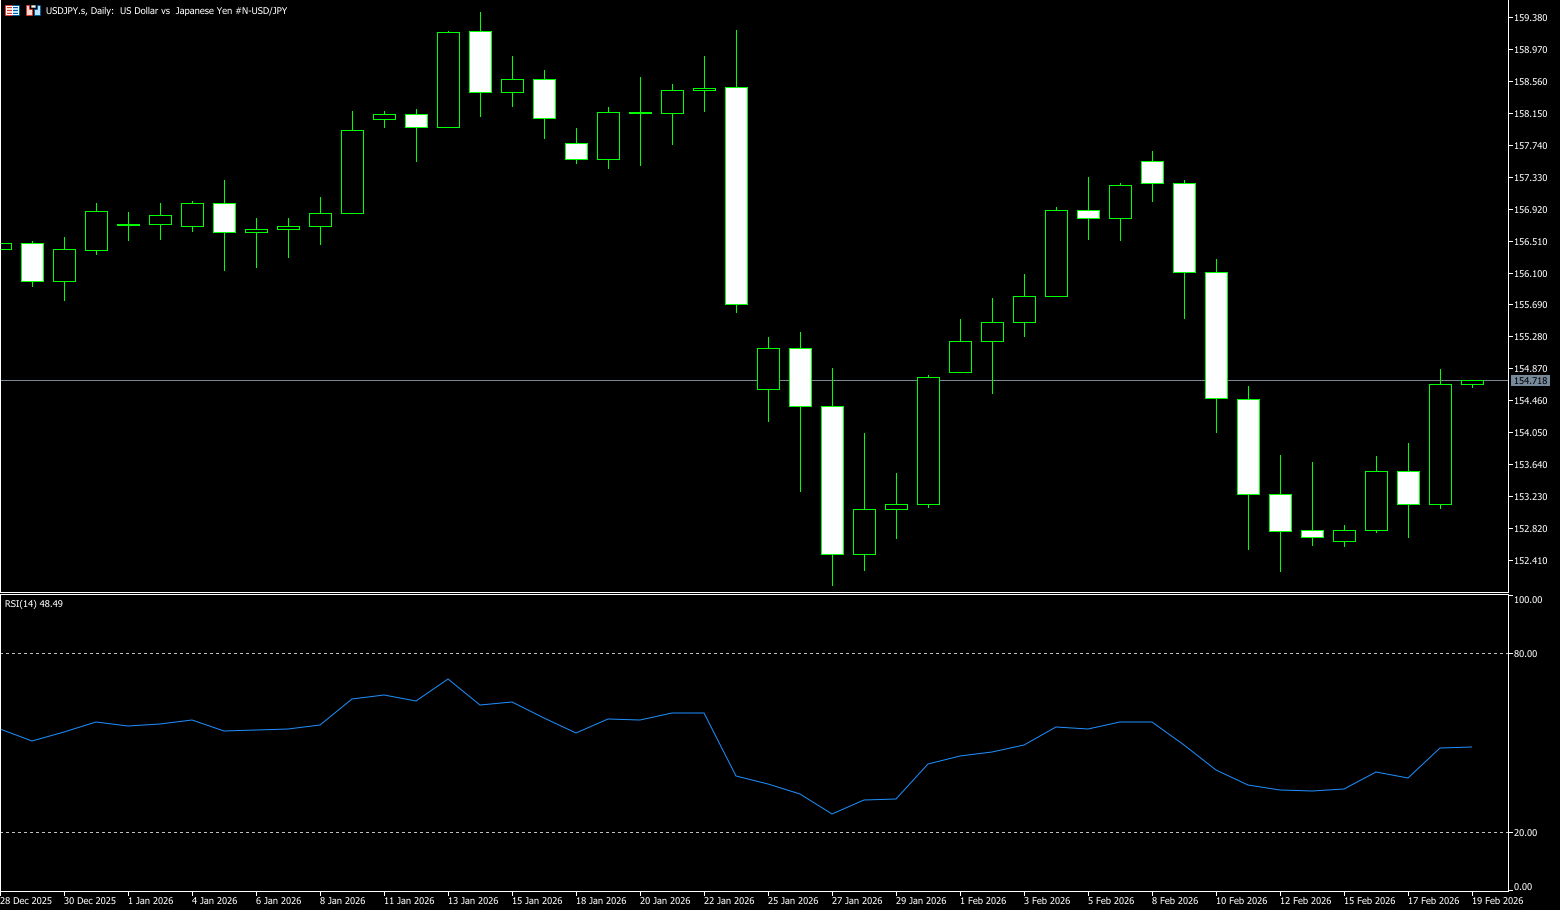
On Wednesday, the yen weakened against the dollar, with USD/JPY rising nearly 1.04% to 154.80, supported by renewed demand for the dollar. At the time of writing, USD/JPY was trading near 154.85. This move occurred against a backdrop of strong US economic data, prompting traders to lower their short-term expectations for further easing by the Federal Reserve. Meanwhile, Kaohsiung detailed her "smart stimulus" fiscal plan, explaining that it was based on rigorous calculations and aimed not at fueling runaway inflation, but at strengthening economic growth. Her comments eased some concerns about the sustainability of public debt, thus boosting the yen and creating headwinds for the pair. On the other hand, market expectations that US President Trump will take a less aggressive stance ahead of this year's midterm elections may limit the downside for the dollar.
Overall, the current macroeconomic backdrop suggests that USD/JPY lacks momentum for a trend breakout and is more likely to trade with a slightly bearish bias in the short term. Looking at the daily chart, USD/JPY is facing significant resistance at the 155 level, which is close to the recent rebound high. Multiple unsuccessful tests indicate that bears are gradually strengthening at higher levels. If the exchange rate breaks below the 154.00 level, support will be seen at the 152.50 and 152.00 areas; a breach of the 152.00 level could open up further downside potential. On the upside, only a firm hold and break above 155.00 can restore short-term bullish momentum to 155.45 (25-day moving average) and 156 (psychological level). Currently, the RSI is in neutral to weak territory, and momentum indicators do not show clear oversold signals, suggesting further downside potential. Considering both fundamentals and technicals, the USD/JPY pair is biased towards a short-term downside, but the movement may unfold in a range-bound manner.
Consider shorting the USD near 155.05 today; Stop loss: 155.30; Target: 154.10; 154.00
EUR/USD
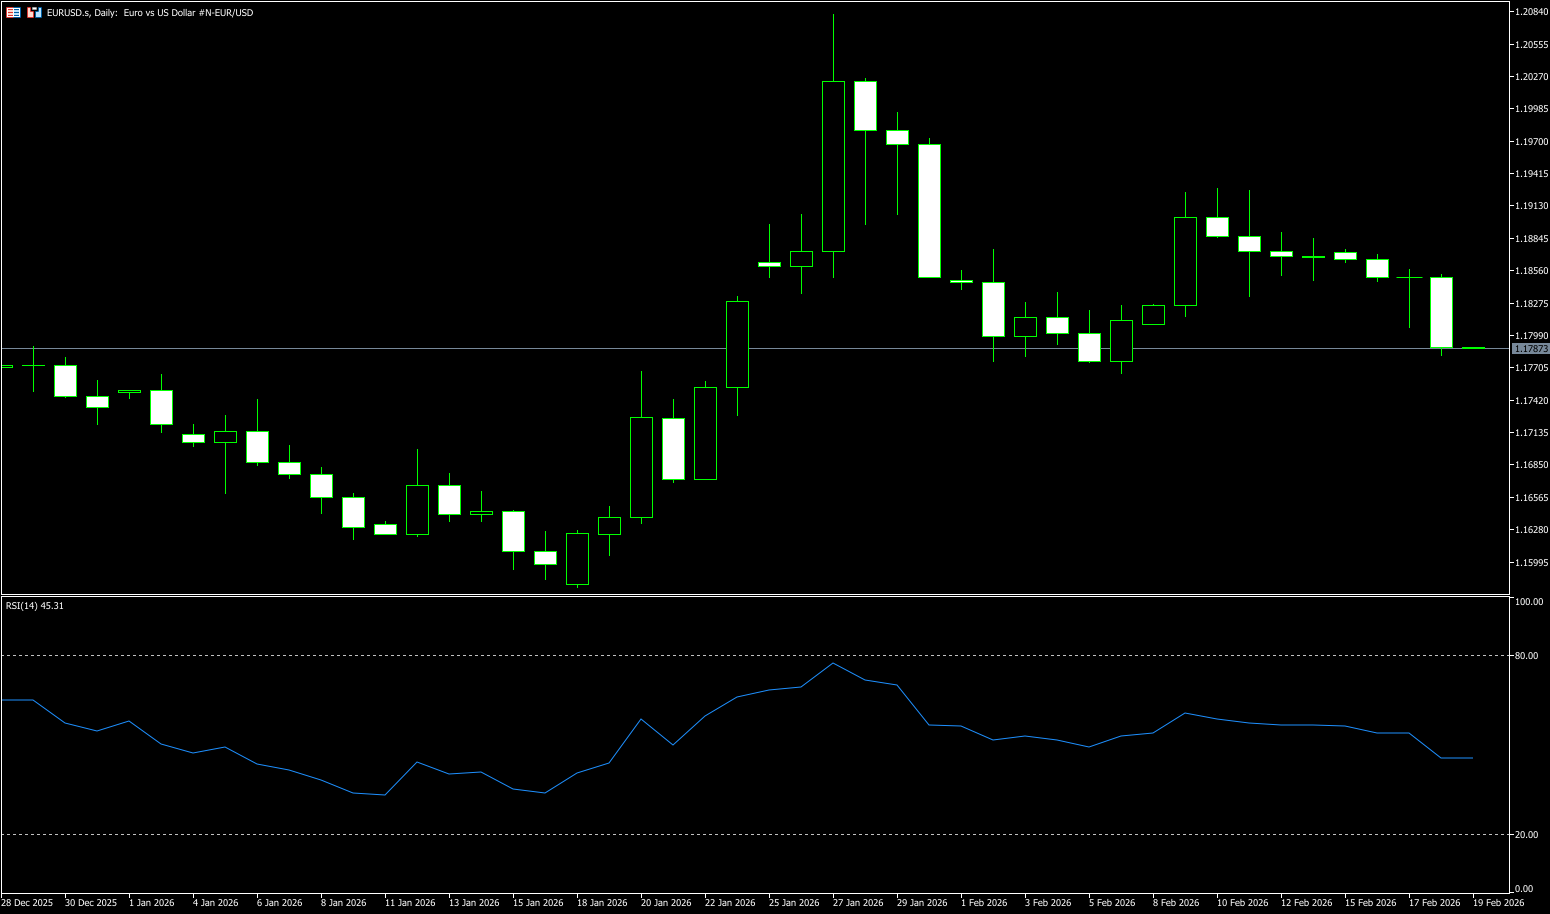
Selling pressure on EUR/USD is accelerating. The pair has clearly broken below the key 1.1800 level and slid to a two-week low by the close of trading on Wednesday. This decline was triggered by strong support for the US dollar following the release of the latest US data and the FOMC meeting minutes. The next key data point to watch is the US weekly initial jobless claims data. Meanwhile, market bets that the Federal Reserve will lower borrowing costs in June and cut rates at least twice more in 2026 are likely to continue to weigh on the dollar. Furthermore, concerns about the Fed's independence and signs of progress in US-Iran negotiations could limit the dollar's gains. This eases geopolitical risks, boosts investor confidence, typically leading to outflows from traditional safe-haven assets and putting dollar bulls on the defensive.
On the daily chart, EUR/USD is trading at 1.1787. The 55-day moving average has risen above the 100-day and 200-day simple moving averages, all of which are trending upwards, reinforcing the bullish bias. The spot price remains above these moving averages. The Relative Strength Index (14) has slipped to 47 (neutral), weakening immediate momentum. A positive tone would be maintained if trading continues above the rising simple moving averages. The Average Directional Index (14) has slightly declined to 26, indicating weakening trend strength as the price stabilizes above support on a higher timeframe. A daily close above 1.1800 would open the way to 1.1859 (the 20-day simple moving average) and further strengthen the upward momentum towards the 1.1900 (psychological level). On the downside, a break below 1.1747 (the 60-day simple moving average) would expose the 1.1700 level and risk a deeper pullback. Holding within the current range would allow the pair to consolidate within a bullish structure.
Consider going long on the Euro today around 1.1770; Stop loss: 1.1760; Targets: 1.1820, 1.1835
Disclaimer: The information contained herein (1) is proprietary to BCR and/or its content providers; (2) may not be copied or distributed; (3) is not warranted to be accurate, complete or timely; and, (4) does not constitute advice or a recommendation by BCR or its content providers in respect of the investment in financial instruments. Neither BCR or its content providers are responsible for any damages or losses arising from any use of this information. Past performance is no guarantee of future results.
Lebih Liputan


Pendedahan Risiko:Instrumen derivatif diniagakan di luar bursa dengan margin, yang bermakna ia membawa tahap risiko yang tinggi dan terdapat kemungkinan anda boleh kehilangan seluruh pelaburan anda. Produk-produk ini tidak sesuai untuk semua pelabur. Pastikan anda memahami sepenuhnya risiko dan pertimbangkan dengan teliti keadaan kewangan dan pengalaman dagangan anda sebelum berdagang. Cari nasihat kewangan bebas jika perlu sebelum membuka akaun dengan BCR.
BCR Co Pty Ltd (No. Syarikat 1975046) ialah syarikat yang diperbadankan di bawah undang-undang British Virgin Islands, dengan pejabat berdaftar di Trident Chambers, Wickham’s Cay 1, Road Town, Tortola, British Virgin Islands, dan dilesenkan serta dikawal selia oleh Suruhanjaya Perkhidmatan Kewangan British Virgin Islands di bawah Lesen No. SIBA/L/19/1122.
Open Bridge Limited (No. Syarikat 16701394) ialah syarikat yang diperbadankan di bawah Akta Syarikat 2006 dan berdaftar di England dan Wales, dengan alamat berdaftar di Kemp House, 160 City Road, London, City Road, London, England, EC1V 2NX. Entiti ini bertindak semata-mata sebagai pemproses pembayaran dan tidak menyediakan sebarang perkhidmatan perdagangan atau pelaburan.

 English
 简体中文
简体中文
 繁體中文
繁體中文
 Bahasa
Melayu
Bahasa
Melayu
 Tiếng
Việt
Tiếng
Việt
 ไทย
ไทย
 日本語
日本語
 한국어
한국어
 ភាសាខ្មែរ
 español