


0
The US Dollar Index
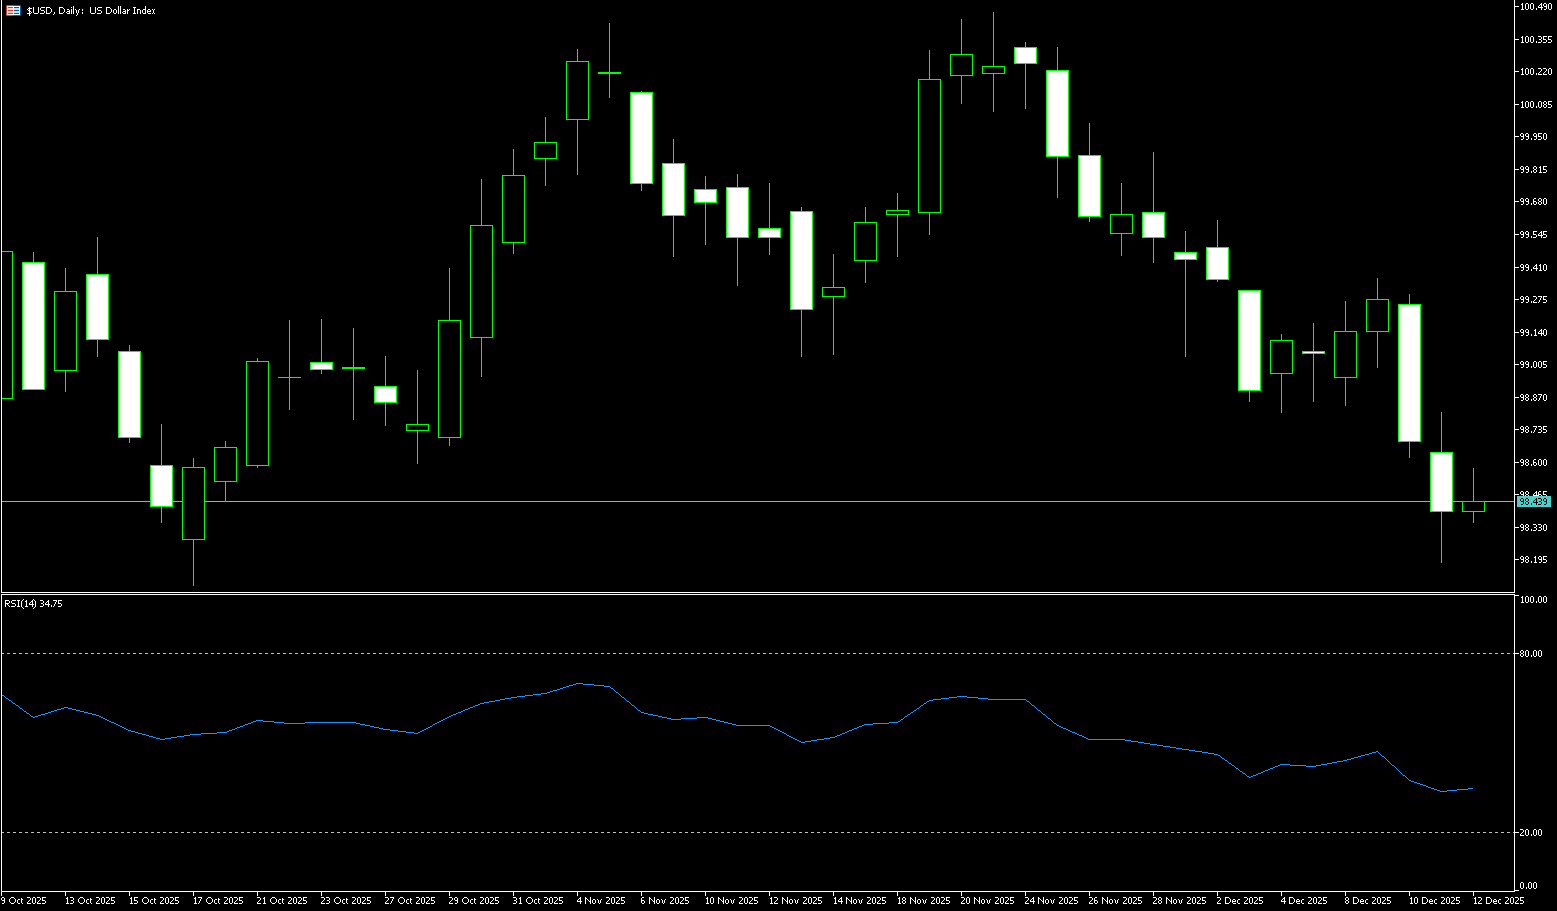
The US dollar index fell to a near two-month low last week, hovering just above 98.00, and is on track for its third consecutive week of declines. This followed the Federal Reserve's third consecutive rate cut this year, bringing the total cuts to 75 basis points. The dollar index declined as the Fed cut rates as expected and offered a less hawkish outlook than the market anticipated. Chairman Powell stated that further rate hikes were unlikely, and that the Fed's forecasts indicated only one rate cut next year. He also noted that "rate hikes are not anyone's baseline expectation at this time; the current policy divergence is between keeping rates unchanged or cutting them." This statement provided the market with a relatively clear boundary for policy expectations. The Fed also announced plans to purchase short-term Treasury bonds to support market liquidity, pushing yields lower and putting pressure on the dollar. Meanwhile, initial jobless claims last week saw their largest increase in nearly four and a half years, further reinforcing the dovish interest rate outlook. In contrast, other major economies, including Australia, Canada, and Europe, are experiencing a hawkish repricing, further pressuring the green-backed dollar. The dollar is expected to weaken against most major currencies last week, with the most significant decline anticipated against the euro.
The daily chart shows that the US dollar index entered a clear downward pressure channel after reaching a high of 100.39 in mid-November. Technical analysis indicates that the index formed a large bearish double top pattern above the psychological level of 100, further solidifying the medium- to long-term downtrend. The upward channel formed in October and November has been effectively broken, and the index is currently trading along the lower boundary of the downward channel, indicating a fundamental shift in the technical structure. The US dollar index is now in a clear downtrend. In December, the US dollar index exhibited a typical wave-like decline pattern of "fall - rebound - further fall." Specifically, starting from the high of 100.39 on November 21, the US dollar index experienced three waves of decline: the first wave fell from 100.390 to 98.50 (November 21 to December 2), the second wave rebounded to 99.60 (December 2 to December 4), and the third wave is currently underway (December 4 to present). From a technical perspective, the MACD indicator shows strong downward momentum. The RSI indicator is at 35.25, clearly in a bearish zone. The 98.00 (psychological level) and 98.13 (last week's low) range on the daily chart are currently the most important support area and the last line of defense above the psychological level of 98.00. A break below this area would open up further downside potential to the 97.46 (October 1st low) – 97.00 (psychological level) area. As for resistance, 98.79 (the 38.2% Fibonacci retracement of the rise from 96.22 to 100.39) has become the most important resistance level. This level is also important because it is a key watershed for whether the US dollar index can return to an upward trend. The 99.11-99.20 range contains several previously converted support levels. Looking at the trading data from December, the US dollar index repeatedly tested this area but failed to break through effectively, indicating strong resistance in this region.
Today, consider shorting the US dollar index around 98.52; Stop loss: 98.65; Target: 98.05; 98.00
WTI Crude Oil
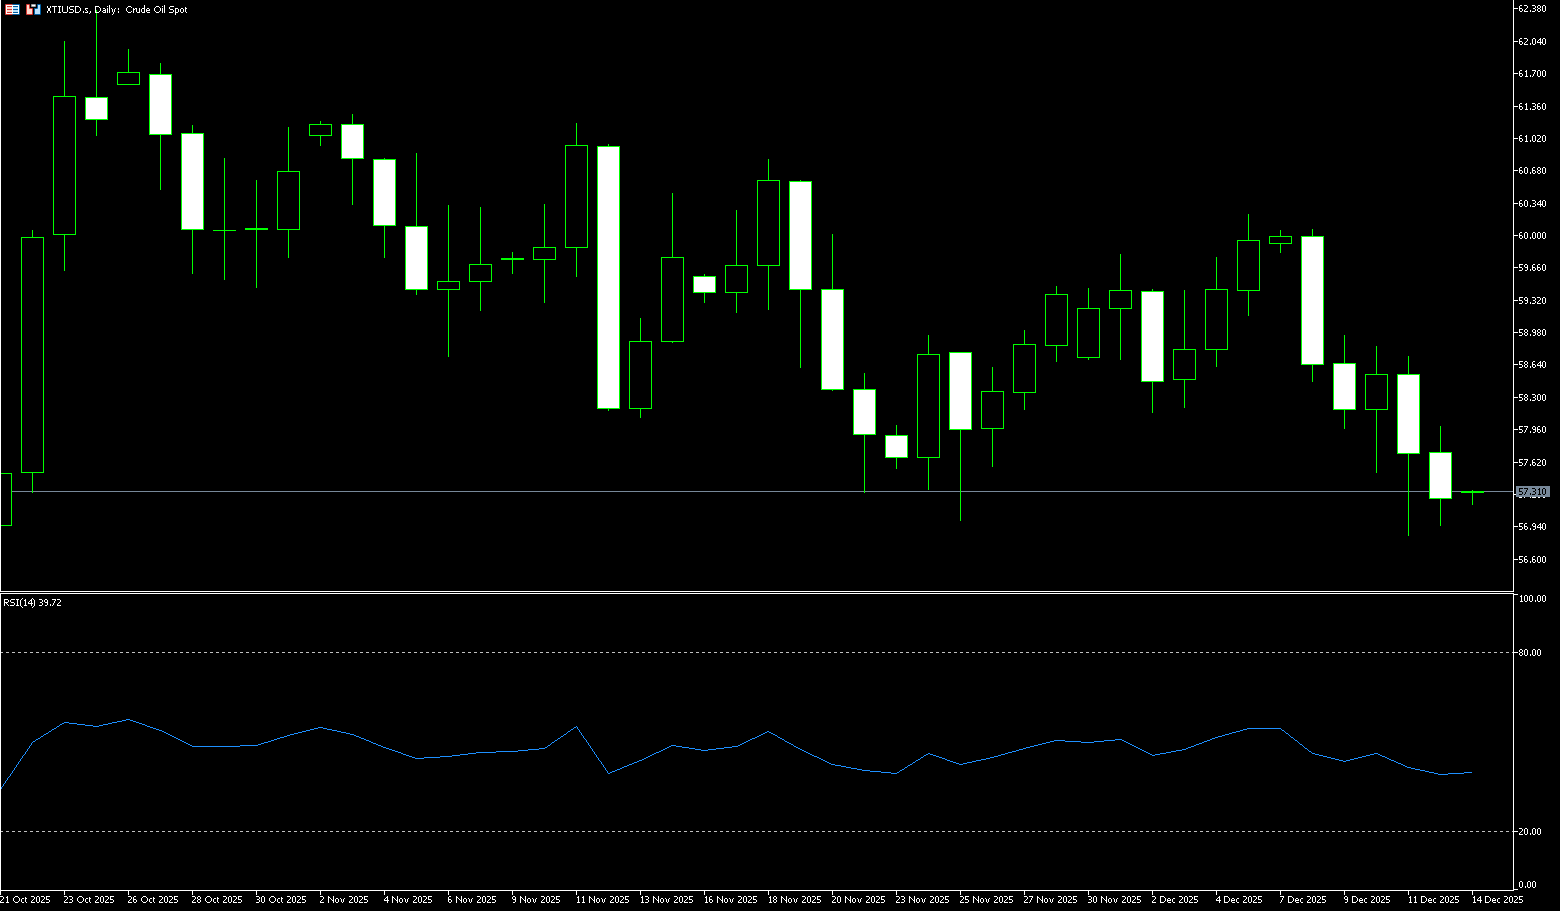
WTI crude oil fell below $57 last week to a near 8-week low of $56.88, recording a weekly loss of over 3%. The International Energy Agency reiterated its forecast of a record supply glut, although slightly lower than last month's estimate, and noted that global inventories have climbed to their highest level in four years. In contrast, OPEC maintained its 2026 outlook for global oil supply and demand, indicating a more balanced market. The impact of the macroeconomic environment on oil prices is mainly transmitted through two channels: the US dollar exchange rate and interest rate policy. Several Federal Reserve officials released dovish signals, with the probability of a rate cut in December reaching 80% at one point. Expectations of a rate cut boosted risk assets, providing short-term support for oil prices. On the other hand, from a micro-structural perspective, WTI crude oil exhibits the following characteristics: prices frequently show upper shadows near key resistance levels (such as $60), indicating heavy selling pressure; while lower shadows appear near support levels (such as $57), indicating buying support. This repeated testing reflects intense competition at key levels. Meanwhile, geopolitical risks are a significant variable influencing oil prices. The ongoing Russia-Ukraine conflict has provided some support for oil prices, with Ukraine's attack on Russian energy infrastructure leading to the suspension of operations in Novorossiysk. Geopolitical risks have limited the downside potential of WTI.
Last week, WTI crude oil showed a short-term technical rebound opportunity, but the medium- to long-term technical outlook remains bearish. Multiple key indicators, including moving averages, MACD, and KDJ, as well as price patterns, reflect this tug-of-war between bulls and bears. Currently, WTI crude oil prices remain below the 50-day moving average (around $59.36), and the 10-day, 20-day, and 30-day moving averages are in a bearish alignment. This pattern typically indicates a continuation of the medium- to long-term downtrend, which will continue to suppress any rebound in oil prices. The MACD indicator is showing signs of bullish divergence, suggesting a possible technical rebound in oil prices in the short term, which could alleviate some of the previous downward pressure. However, given the previous sustained low prices and the MACD's relatively weak position, the rebound momentum is insufficient to support a trend reversal. Combining technical and fundamental factors, WTI crude oil is likely to fluctuate within a range of $55.97 (October 20th low) to $61.50 (100-day moving average) in the short term. If oil prices can break through the resistance zone of $59.36 (50-day moving average) and $60.00 (psychological level) with the help of escalating geopolitical conflicts, they may further test the $61.50 (100-day moving average) area. If they fail to break through and geopolitical risks ease, oil prices will likely fall back to the support zone of $56.88 (last Thursday's low) - $57.00 (psychological level). If this zone is broken, the next key support level will be around $55.97 (October 20th low), and it may even touch the lower $50 level.
Today, consider going long on crude oil around 57.15; Stop loss: 57.00; Target: 58.50; 58.70
Spot Gold
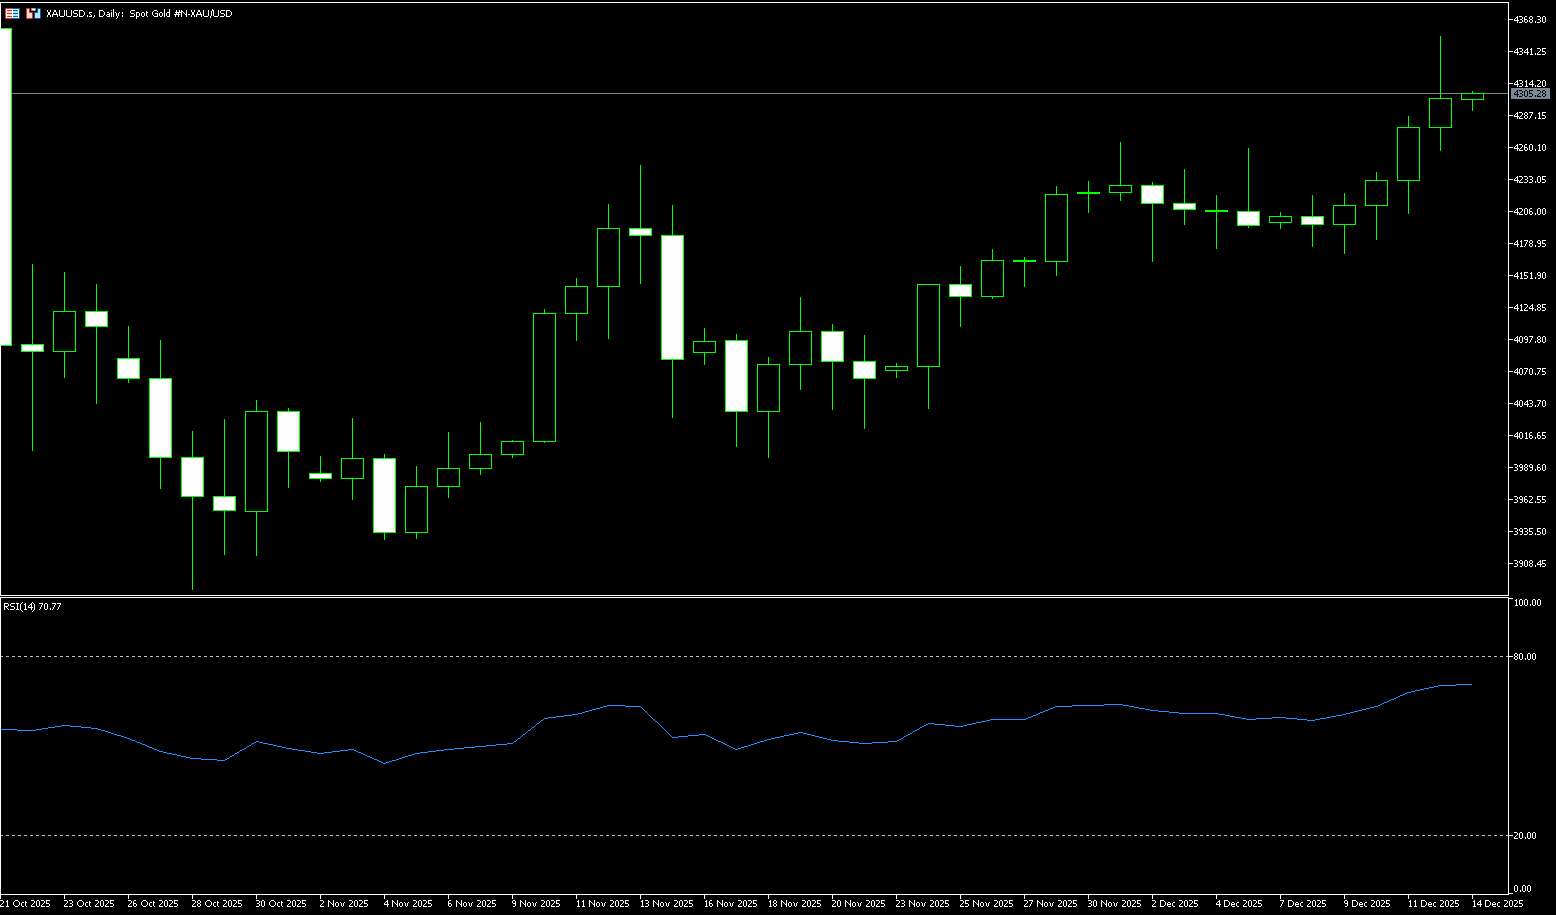
Gold rose above $4,300 per ounce on Friday, testing the record high of $4,353.60 set in October, and is on track to deliver its weekly gains, supported by expectations of further US monetary easing. New signs of a cooling labor market have reinforced the view that the Federal Reserve may cut interest rates twice in 2026. Jobless claims for the week ending December 6 rose more than expected, reaching their highest level in more than two months. Following this data release, the Fed implemented its third 25-basis-point rate cut of the year, taking a more dovish stance than the market had anticipated. Chairman Powell stated that additional rate hikes are essentially ruled out, prompting traders to price in two rate cuts in 2026, even though the Fed's projections only indicate one rate cut. Meanwhile, the Federal Reserve announced it would purchase approximately $40 billion in short-term Treasury bonds to ease pressure in the money market. This move is expected to limit short-term yields and support precious metals. On the other hand, following the Fed's rate cut last week, market expectations for further easing policies continued to rise, directly driving gold's strong upward trend. The Fed's dovish tone provided solid buying support for gold prices.
Spot gold generally trended upwards with some volatility last week, continuing the upward trend following the Fed's decision. Before the weekend, it broke through the key resistance level of $4,264, reaching a new high of $4,353.60 in over a month. The short-term bullish advantage is obvious, but there is also some potential for a pullback. Last week, gold closed with a bullish candlestick pattern, with strong support below. The 5-day, 10-day, and 20-day moving averages are in a bullish alignment, and the 5/10-day moving average has crossed above the 20-day moving average. This alignment provides strong support for the upward movement of gold prices, highlighting the current bullish trend. At the same time, the candlestick is trading near the upper Bollinger Band, suggesting a short-term strong position. The MACD indicator, with its sustained golden cross and increasing volume, signifies ample bullish momentum in the medium to long term. The RSI indicator, at 69.89, confirms the bulls' dominance but also suggests some short-term overbought pressure. Furthermore, regarding key levels, the previous resistance level of $4,264 has become a key support after being broken. Additionally, $4,241.80 is close to the 5-day moving average support, and the psychological level of $4,200 also provides strong support. On the resistance side, the core short-term resistance is focused on the psychological level of $4,300. A break above this level could lead to a move towards $4,353.60 (the high of December 12th) and potentially a test of the previous high or key level of $4,381.
Today, consider going long on spot gold around 4,295; Stop loss: 4,290; Target: 4,330; 4,340
AUD/USD
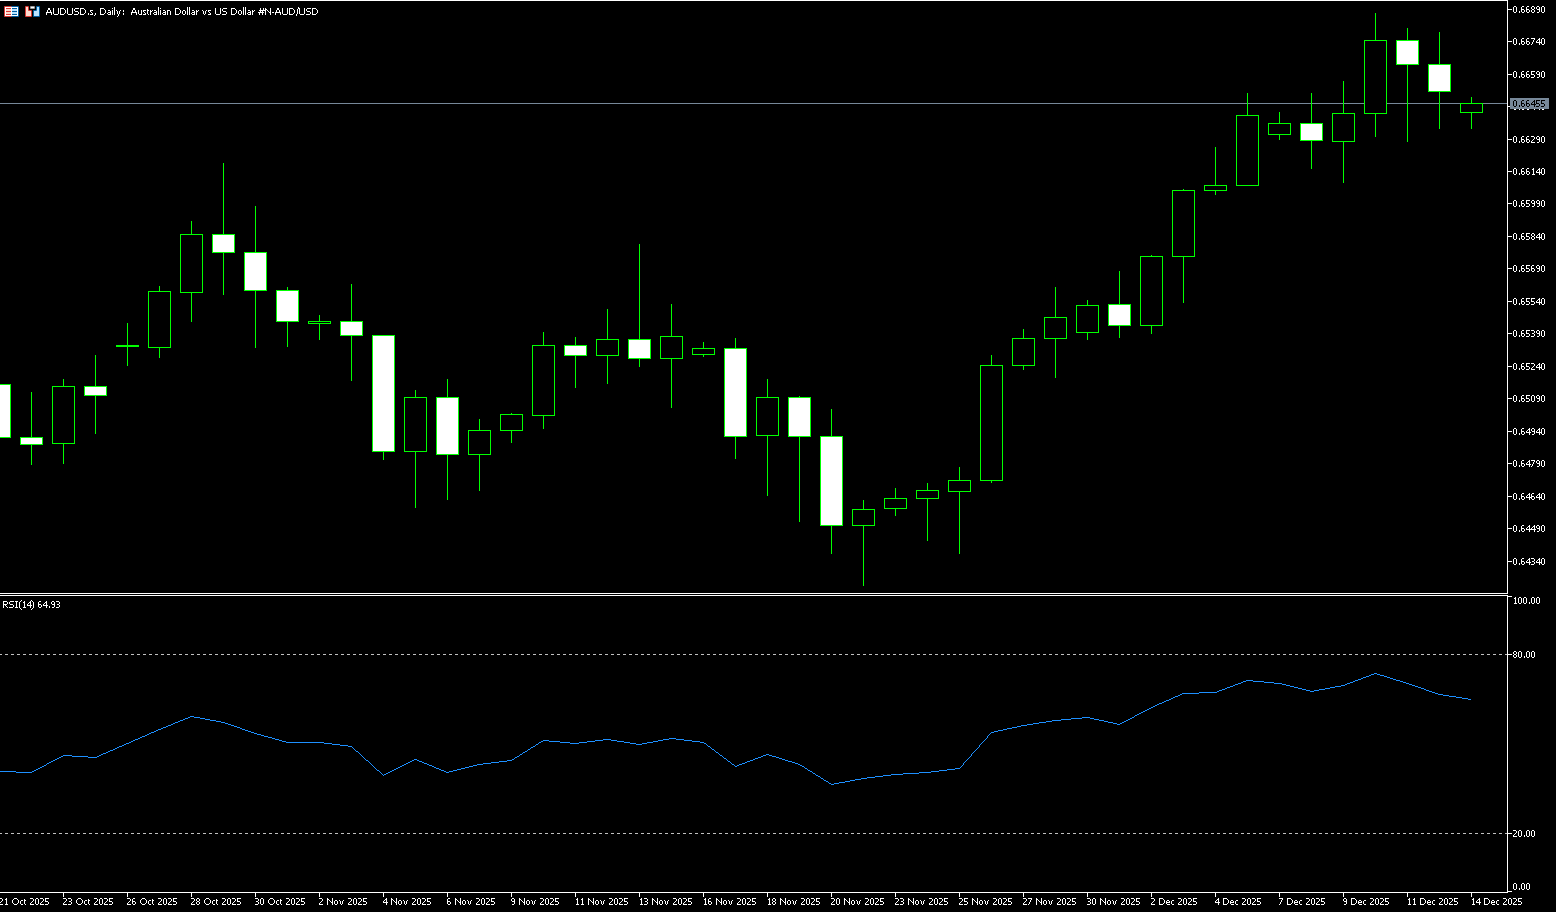
The Australian dollar remained strong against the US dollar last week, as traders disregarded the monetary policy announcements from the Reserve Bank of Australia (RBA) and the Federal Reserve, reassessing the near-term interest rate outlook. The RBA kept the cash rate unchanged at 3.60% last week, marking the third consecutive pause and signaling caution and data-dependentness amid persistent inflation risks. In contrast, the Federal Reserve cut rates by 25 basis points, lowering the federal funds rate to a range of 3.50%-3.75%, its third rate cut this year, further reinforcing expectations that US monetary policy is entering a phase of gradual easing. The market now increasingly expects the RBA to maintain its pause for an extended period, anticipating that the next policy move could be a rate hike in 2026 if inflation remains high. On the US side, despite limited forward guidance from the Federal Reserve, traders still expect two rate cuts next year. This policy divergence continues to support the Australian dollar, putting the AUD/USD pair on track for its third consecutive week of gains. With key policy events concluded, market focus shifts to next week's upcoming economic data. Traders will be closely watching Tuesday's preliminary S&P Global PMI data from Australia and the US for new signals on economic momentum. In the US, focus will be on the October and November non-farm payroll reports, Tuesday's retail sales, and Thursday's consumer price index.
Last week, the AUD/USD pair exhibited a clear short-term bullish trend, with multiple technical indicators converging in a bullish manner, and key support and resistance levels clearly defined. On the daily chart, the pair has stabilized above the 5-day, 10-day, and 20-day moving averages, with the moving average system in a bullish alignment. It also previously broke through the key psychological level of 0.6600, forming a favorable bullish technical pattern. The pair is approaching the yearly high of 0.6707 reached on September 17th, and the current movement is heading towards this resistance level. The MACD indicator remains in a golden cross above the zero line, indicating that the medium-term bullish momentum has not weakened. The RSI indicator remains around 64.42, in a strong range and not yet overbought, leaving room for further gains. Furthermore, the exchange rate has risen strongly from the 5-day moving average at 0.6652. If the closing price can stabilize above the 5-day moving average, it will further solidify the bullish pattern towards 0.6700 (the psychological level) and 0.6707 (the year's high). A break above this level would challenge 0.6750 (the high of October 14, 2024). On the support side, if there is a pullback, 0.6600 is a key psychological support level. The 0.6556–0.6541 area below forms strong support due to the superposition of the 21-day and 100-day moving averages. However, a decisive break below the 0.6500 psychological level could confirm a continuation of the downtrend.
Consider going long on the Australian dollar around 0.6638 today; Stop loss: 0.6626; Target: 0.6680; 0.6690
GBP/USD
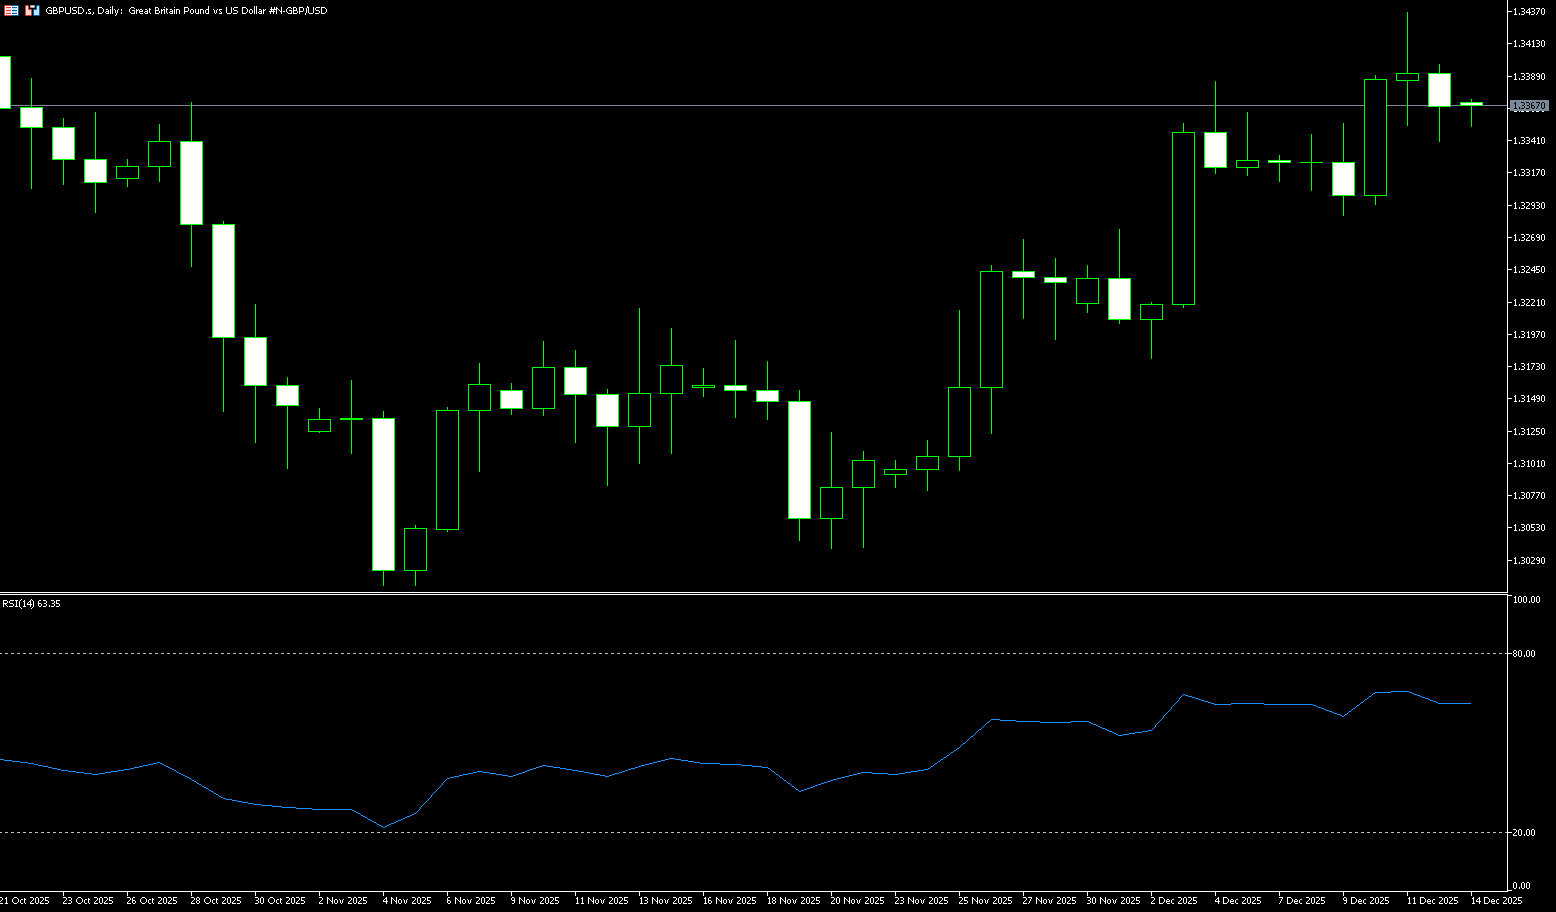
GBP/USD held firmly in bullish territory towards the end of last week, but sterling buyers encountered technical resistance at the 1.3400 level. The Federal Reserve implemented its third consecutive rate cut this week, boosting risk appetite across broad markets and weakening the dollar on all fronts. Data released on Friday showed that the UK economy continued to contract in October, with the latest figures showing a 0.1% decline in gross domestic product (GDP) compared to September, according to the Office for National Statistics (ONS). Following the Fed's latest rate cut, Fed Chairman Jerome Powell warned that further rate adjustments beyond 2026 were unlikely, with most Fed policymakers expecting only two rate cuts in the next two years. The market reacted by increasing bets that the Fed will be forced to accelerate its rate-cutting pace next year. Sterling traders will face four consecutive days of high-impact data releases, starting with the latest UK PMI survey results and Consumer Price Index (CPI) inflation data, while the real calendar shock will be the Bank of England's latest interest rate decision, scheduled for Thursday. UK retail sales data will be released after the Bank of England's report, concluding this week's UK data schedule on Friday.
On the daily chart, the exchange rate has gradually risen since rebounding from the psychological level of 1.3000, currently holding above the 75-day moving average of 1.3337. Over the past three weeks, the exchange rate has moved along short-term moving averages, with the 10-day moving average at 1.3320 repeatedly providing effective support, indicating some upward momentum in the medium term. However, last week's sharp rise in the pound may have been purely a "short-covering" move, as traders were forced to close out large net short positions accumulated before last week's budget, rather than a reassessment of UK sovereign risk. This suggests the pound's upward momentum is fragile. From a comprehensive technical perspective, the MACD indicator's upward trend structure remains intact, indicating that the bullish pattern persists. The RSI indicator is in the neutral-to-strong zone around 61.20 and has not reached overbought territory, meaning that the bulls still have some momentum, but lack sufficient strength to push the exchange rate significantly higher, making a clear one-sided trend unlikely in the short term. For the short-term trend of the GBP/USD exchange rate, the rate needs to stabilize above the key support level of 1.3256 (50-day moving average) – 1.3300 (psychological level) to create conditions for further rebound. The 1.3390 – 1.3400 range is currently the most important resistance area, having been tested multiple times without a successful breakout. 1.3390 has been designated as a key entry point for adding to positions, highlighting its importance. Further upside potential is expected towards the 1.3438 (last week's high) – 1.3450 range. Further upside targets include the 1.3500 (psychological level) and the 1.3527 (October 1st high) area. If the exchange rate encounters resistance and falls back, it may retrace to the 1.3300 level in the short term, with further support seen near the 50-day moving average at 1.3256. A break below 1.3256 could trigger a pullback to the 1.3200 level.
Today, consider going long on GBP/JPY around 1.3354; Stop loss: 1.3340; Target: 1.3400; 1.3410
USD/JPY
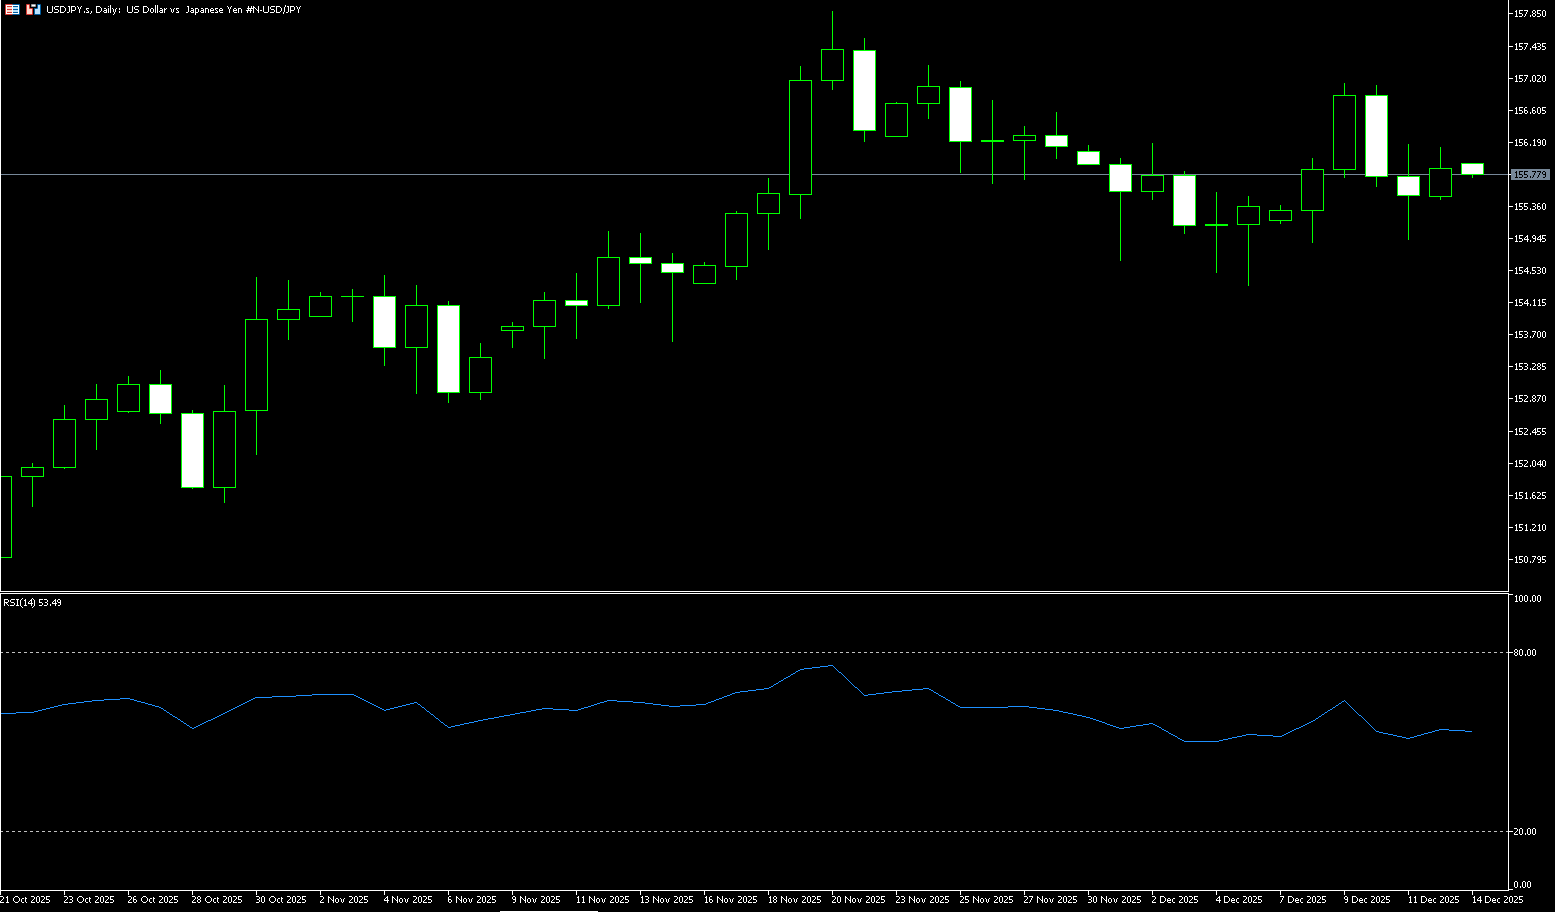
USD/JPY held around 155.60 on Friday, rebounding to around 155.80. The pair tracks a modest rebound in the US dollar as traders began to readjust positions after a less hawkish Fed result, anticipating next week's US non-farm payroll data and a rate cut by the Bank of Japan. Last week, the Fed announced a 25 basis point rate cut as expected, and Fed Chairman Powell reiterated downside risks to the US labor market, further increasing market expectations for another rate cut in 2026. This dovish stance directly weakened the dollar's appeal, resulting in a generally weak dollar tone, which in turn dragged down the USD/JPY exchange rate. The sharp drop in the exchange rate before the weekend was closely related to the market's digestion of the negative reaction to the Fed's rate cut decision. In Japan, expectations of a December rate hike by the Bank of Japan persisted throughout the week, with the probability continuing to rise. Bank of Japan Governor Kazuo Ueda further stated this week that the possibility of inflation consistently reaching 2% is increasing, reinforcing market bets on a rate hike and providing strong support for the yen. However, robust inflation data meant that the rate hike expectation was not significantly impacted, becoming a key force suppressing the USD/JPY exchange rate. Meanwhile, the yield on Japanese 10-year government bonds recently rose to 1.910%, the highest level since July 2007, while the Federal Reserve's rate cuts lowered US Treasury yields, leading to a continued decline in the spread between the two-year and 10-year US-Japan government bond yields. This narrowing spread broke the core logic that had previously supported the high levels of the USD/JPY exchange rate, pushing the exchange rate towards a medium-term downward correction.
Last week, the USD/JPY exchange rate exhibited a clear downward trend. Of the five daily candlesticks, three closed bearish and two closed bullish, but the bullish candlesticks generally had small bodies, indicating weak bullish momentum. Several important technical patterns formed last week. First, there was the "hammer" candlestick pattern on December 8th, with the lowest price of 154.90 becoming last week's low. The subsequent rebound showed strong support at this level. Second, there was the large bullish candlestick on December 9th, which briefly broke through the 156.50 area but failed to hold, indicating heavy upward pressure. Finally, there was the "descending three-step" pattern formed between December 10th and 12th, with three consecutive small candlesticks hovering at relatively low levels, suggesting a possible continuation of the downtrend. The USD/JPY pair has formed a multi-layered support system during its current decline. The primary support levels are the psychological level of 155.00 and 154.95 (last Thursday's low), which are not only important psychological levels but also technically significant. Secondary support levels include 154.05 (the 50-day moving average) and the 154.00 area, which repeatedly provided support last week. Stronger support lies in the 153.00-153.47 (55-day moving average) area. Additionally, USD/JPY faced multiple resistance levels during this week's rebound. The primary resistance is the 156.00-156.50 area, which repeatedly acted as the high point of the rebound this week, forming significant technical resistance. Stronger resistance lies in the 156.50-157.00 area, where several technical resistance factors converge. The most crucial resistance is the 157.00-158.00 area, which not only represents the downtrend line from the November 20th high of 157.89 but also a significant high point area for 2025.
Consider shorting the US dollar around 156.05 today; Stop loss: 156.28; Target: 155.10; 155.00
EUR/USD
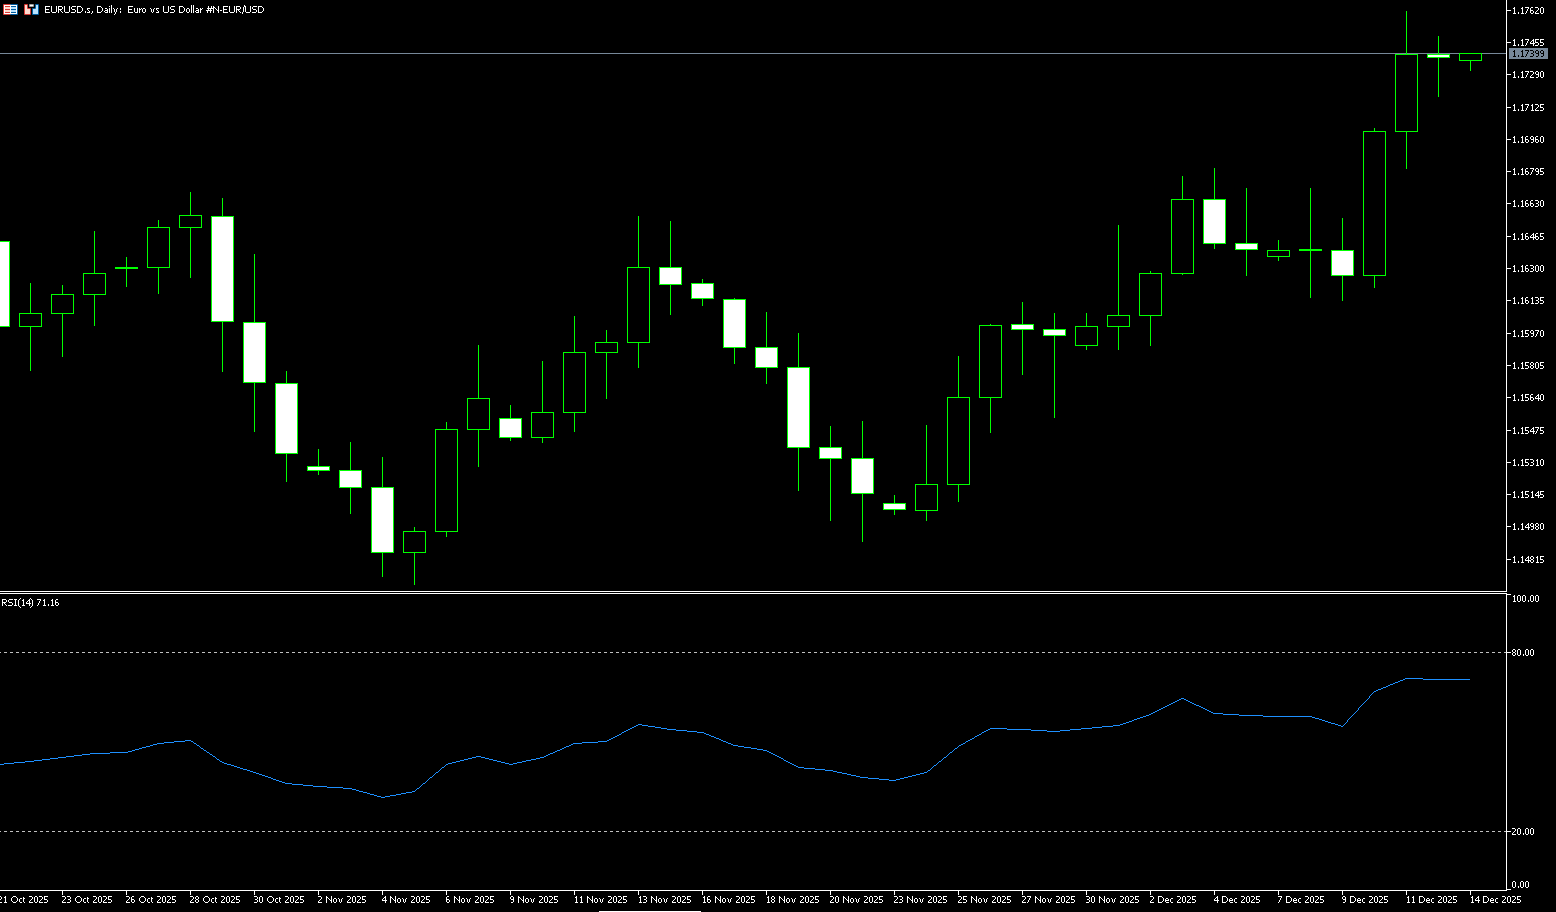
The EUR/USD pair climbed back above 1.1700 last week, retreating from a more than two-month high of 1.1762 last Thursday. This was its strongest level since mid-October, supported by a generally weaker dollar, hawkish rhetoric from ECB officials, and progress on France's 2026 social security budget. Meanwhile, ECB officials indicated that further rate cuts might not be needed in 2026, prompting investors to reduce their expectations for further ECB easing. The widening monetary policy divergence between the ECB and the US Federal Reserve has supported the pair, which has risen nearly 2% over the past three weeks. The Fed cut rates last week and indicated that another cut might be possible in 2026. However, investors still expect the Fed to cut rates at least twice, as Chairman Jerome Powell may be replaced by the more dovish Kevin Hassett. Hassett, a White House economic advisor, has repeatedly expressed his desire to significantly reduce borrowing costs. On the macroeconomic front, German consumer inflation data confirmed increased price pressures in November, despite a slight contraction in monthly inflation. In the US, a group of Federal Reserve policymakers will take the stage, potentially further clarifying the central bank's monetary policy.
In terms of technical indicators, the euro/dollar exchange rate is currently exhibiting a complex, mixed bullish/bearish pattern. According to the latest technical analysis data, daily technical indicators show that bullish momentum is dominant, laying the foundation for further gains. Although the short-term RSI is in neutral territory and the MACD histogram is flat, the strong trend of medium- and long-term indicators remains unchanged. On the daily chart, the euro's overall price movement is currently consolidating around the upper Bollinger Band at 1.1738, exhibiting a typical pattern of mild, upward oscillation along the Bollinger Band, indicating that the overall price movement remains strong, with the advantage significantly favoring the bulls. The euro/dollar pair is expected to consolidate within the 1.1642 (100-day moving average) to 1.1820 (September 23 high) range, with a key focus on the 1.1731-1.1747 area. A successful break and hold above 1.1747 would open up upside potential to 1.1778 (October 1 high) and the 1.1800 (psychological level). A break above this level could lead to a challenge of the 1.1878 (September 16 high) area. Even with a long-term upward trend, short-term technical pullbacks are inevitable. Especially in the 1.1731-1.1747 area, repeated tests without a breakout could trigger a significant correction. The 1.1700 level is a support zone, and a break below this level would represent the long-term key support at the 1.1642 (100-day moving average), which also coincides with the 38.2% Fibonacci retracement level of this year's gains. A decisive break below this support level would signify a change in the core logic driving this year's gains, potentially signaling a trend reversal. The exchange rate could then accelerate its decline, erasing all of the year's gains, and potentially reach support levels at 1.1612 (the 20-day moving average) and 1.1600 (the psychological level).
Today, consider going long on the Euro around 1.1728; Stop-loss: 1.1715; Target: 1.1780; 1.1790
Disclaimer: The information contained herein (1) is proprietary to BCR and/or its content providers; (2) may not be copied or distributed; (3) is not warranted to be accurate, complete or timely; and, (4) does not constitute advice or a recommendation by BCR or its content providers in respect of the investment in financial instruments. Neither BCR or its content providers are responsible for any damages or losses arising from any use of this information. Past performance is no guarantee of future results.
Lebih Liputan


Pendedahan Risiko:Instrumen derivatif diniagakan di luar bursa dengan margin, yang bermakna ia membawa tahap risiko yang tinggi dan terdapat kemungkinan anda boleh kehilangan seluruh pelaburan anda. Produk-produk ini tidak sesuai untuk semua pelabur. Pastikan anda memahami sepenuhnya risiko dan pertimbangkan dengan teliti keadaan kewangan dan pengalaman dagangan anda sebelum berdagang. Cari nasihat kewangan bebas jika perlu sebelum membuka akaun dengan BCR.
BCR Co Pty Ltd (No. Syarikat 1975046) ialah syarikat yang diperbadankan di bawah undang-undang British Virgin Islands, dengan pejabat berdaftar di Trident Chambers, Wickham’s Cay 1, Road Town, Tortola, British Virgin Islands, dan dilesenkan serta dikawal selia oleh Suruhanjaya Perkhidmatan Kewangan British Virgin Islands di bawah Lesen No. SIBA/L/19/1122.
Open Bridge Limited (No. Syarikat 16701394) ialah syarikat yang diperbadankan di bawah Akta Syarikat 2006 dan berdaftar di England dan Wales, dengan alamat berdaftar di Kemp House, 160 City Road, London, City Road, London, England, EC1V 2NX. Entiti ini bertindak semata-mata sebagai pemproses pembayaran dan tidak menyediakan sebarang perkhidmatan perdagangan atau pelaburan.

 English
 简体中文
简体中文
 繁體中文
繁體中文
 Bahasa
Melayu
Bahasa
Melayu
 Tiếng
Việt
Tiếng
Việt
 ไทย
ไทย
 日本語
日本語
 한국어
한국어
 ភាសាខ្មែរ
 español