


0
US Dollar Index
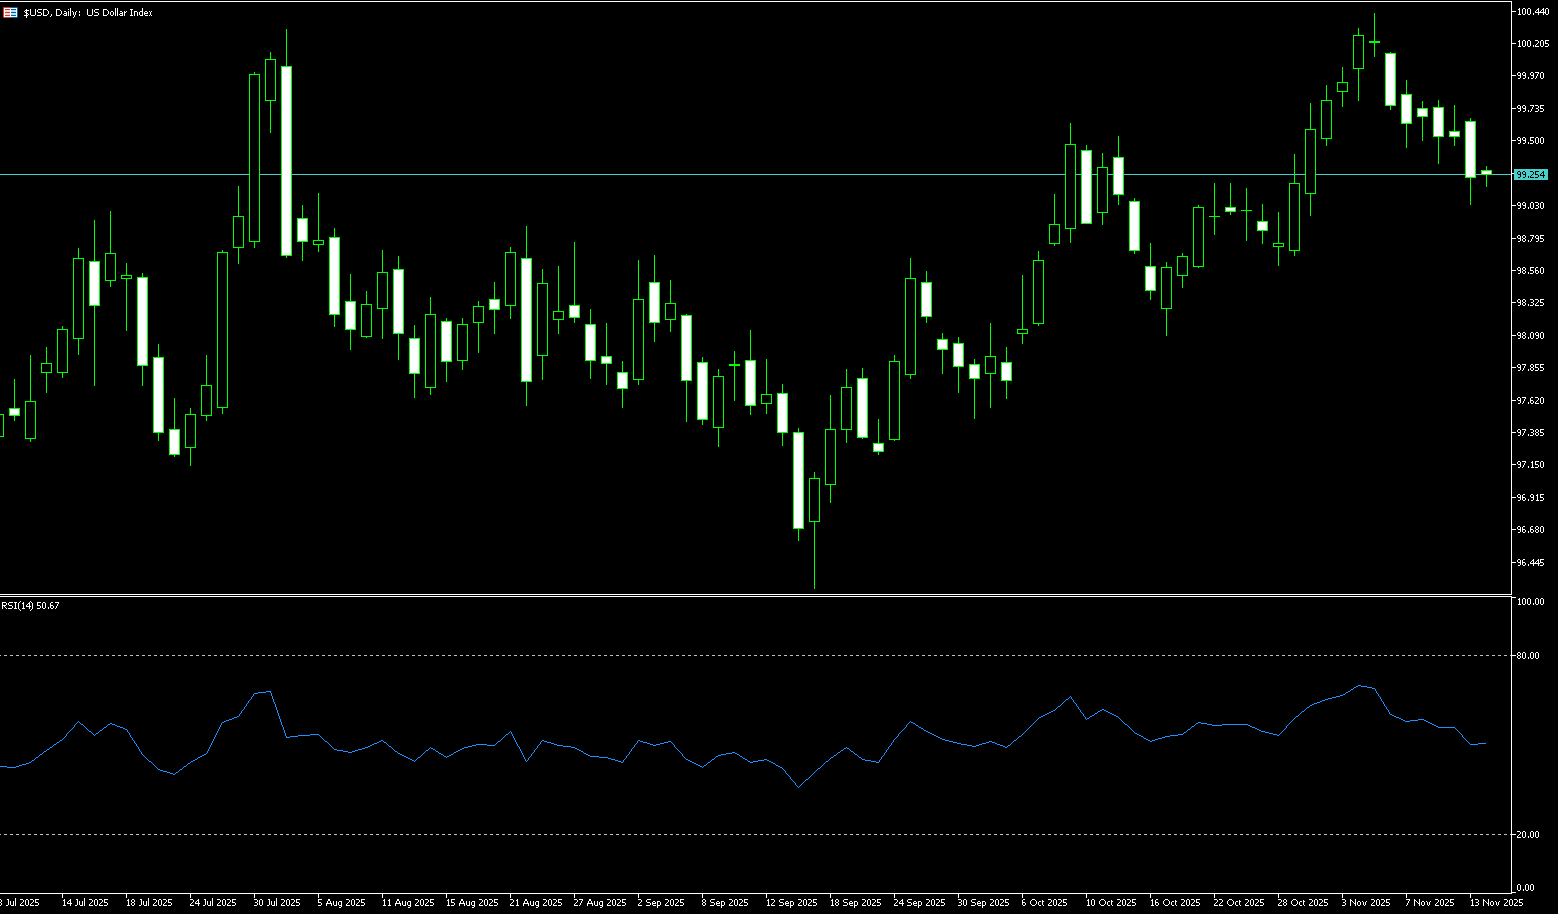
The US dollar index hovered around 99.00 on Monday, near a two-week low, as investors prepared for a possible final rate cut of the year by the Federal Reserve in a crucial month. Global currency markets experienced a volatile storm last week, primarily influenced by expectations of a US rate cut, the Reserve Bank of New Zealand's interest rate decision, the UK budget, and rumors of yen intervention. These intertwined events drove sharp fluctuations in exchange rates, further amplified by the thin market liquidity caused by the US Thanksgiving holiday. The US dollar faced heavy pressure, posting its biggest weekly decline since July, while other currencies such as the pound and the New Zealand dollar performed well on policy support, and the yen oscillated between the risks of rate hikes and intervention. The market also focused on a potential boost to the euro from the Ukraine peace agreement negotiations and the continued bearish sentiment surrounding the Korean won. Looking ahead, uncertainty in the currency markets will persist as more economic data is released and the selection of a new Federal Reserve chairman is finalized.
From a technical analysis perspective, as long as the US dollar index remains below the resistance zone formed by the 200-day simple moving average at 99.64 and the 9-day simple moving average at 99.84, the overall market structure will continue to lean bearish. If the key support levels of the 50-day simple moving average at 99.06 and the psychological level of 99.00 are effectively breached, accompanied by increased trading volume, then the selling pressure on the US dollar index may further intensify, potentially opening up downside potential to the 98.65 level (the 150-day simple moving average). In summary, coupled with the soaring expectations of a Fed rate cut and the low market liquidity at the end of the month, the short-term trend of the US dollar index is likely to remain bearish, unless the bulls can decisively reclaim the key psychological level of 100.00 with strong buying power.
Today, consider shorting the US Dollar Index around 99.50; Stop loss: 99.60; Target: 99.10; 99.00
WTI Crude Oil
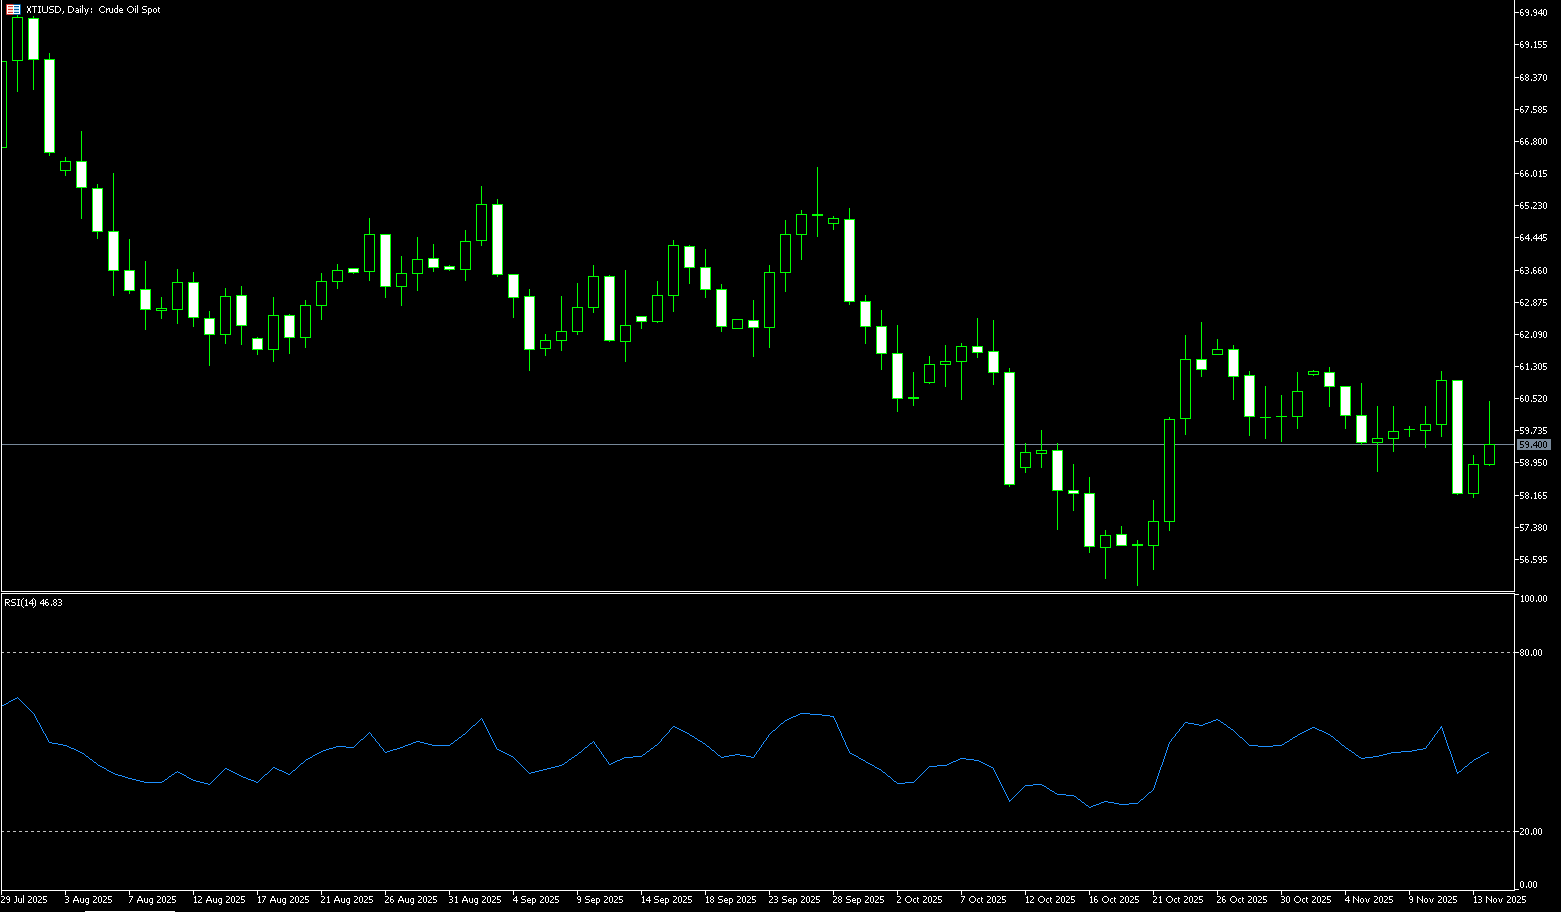
WTI crude oil started the week trading around $59.40 per barrel. The "very likely" peace agreement between Russia and Ukraine limited price gains. The pressure on oil prices stemmed mainly from the following factors: Continued supply pressure: Data from the US Energy Information Administration last Friday showed that US crude oil production increased by 44,000 barrels per day in September, reaching a record 13.84 million barrels per day, deepening market concerns about an oil glut. Progress in the peace talks between Ukraine and Russia continued to influence the market. Earlier last week, signs of a possible peace agreement pushed oil prices sharply lower, but prices have recovered somewhat in the past three trading days as negotiations dragged on. Stronger fuel oil refining margins supported crude oil demand in some areas, but the negative impact of expectations of an oil glut is putting downward pressure on prices. Brent crude and WTI crude oil both fell for the fourth consecutive month, marking their longest losing streak since 2023. Geopolitical risks, expectations surrounding the Federal Reserve's monetary policy, and the prospect of a global supply glut intertwined, dominating every market fluctuation.
Looking at the current technical chart for WTI crude oil, prices are fluctuating near the psychological level of $60.00. The overall trend has been one of consolidation and adjustment recently. Firstly, the daily chart shows that oil prices briefly touched a high of $62.38 on October 24th, but subsequently gradually fell back to around $57, before stabilizing and rebounding near the support level of $58. Currently, prices are approaching the resistance level of $60, and may face some selling pressure in the short term. In terms of technical indicators, the MACD indicator shows weak momentum, suggesting that the current bullish strength is weak and upward momentum is limited. The RSI indicator remains around 48, indicating that the market is within a consolidation range and there are no obvious overbought or oversold conditions. In summary, WTI crude oil is likely to continue its oscillating pattern in the short term, with prices potentially encountering resistance around $60 and $62.38, while support lies around $58 and $57 (the low of November 25th).
Today, consider going long on spot crude oil around 59.18; Stop loss: 59.00; Target: 60.80; 61.20
Spot Gold
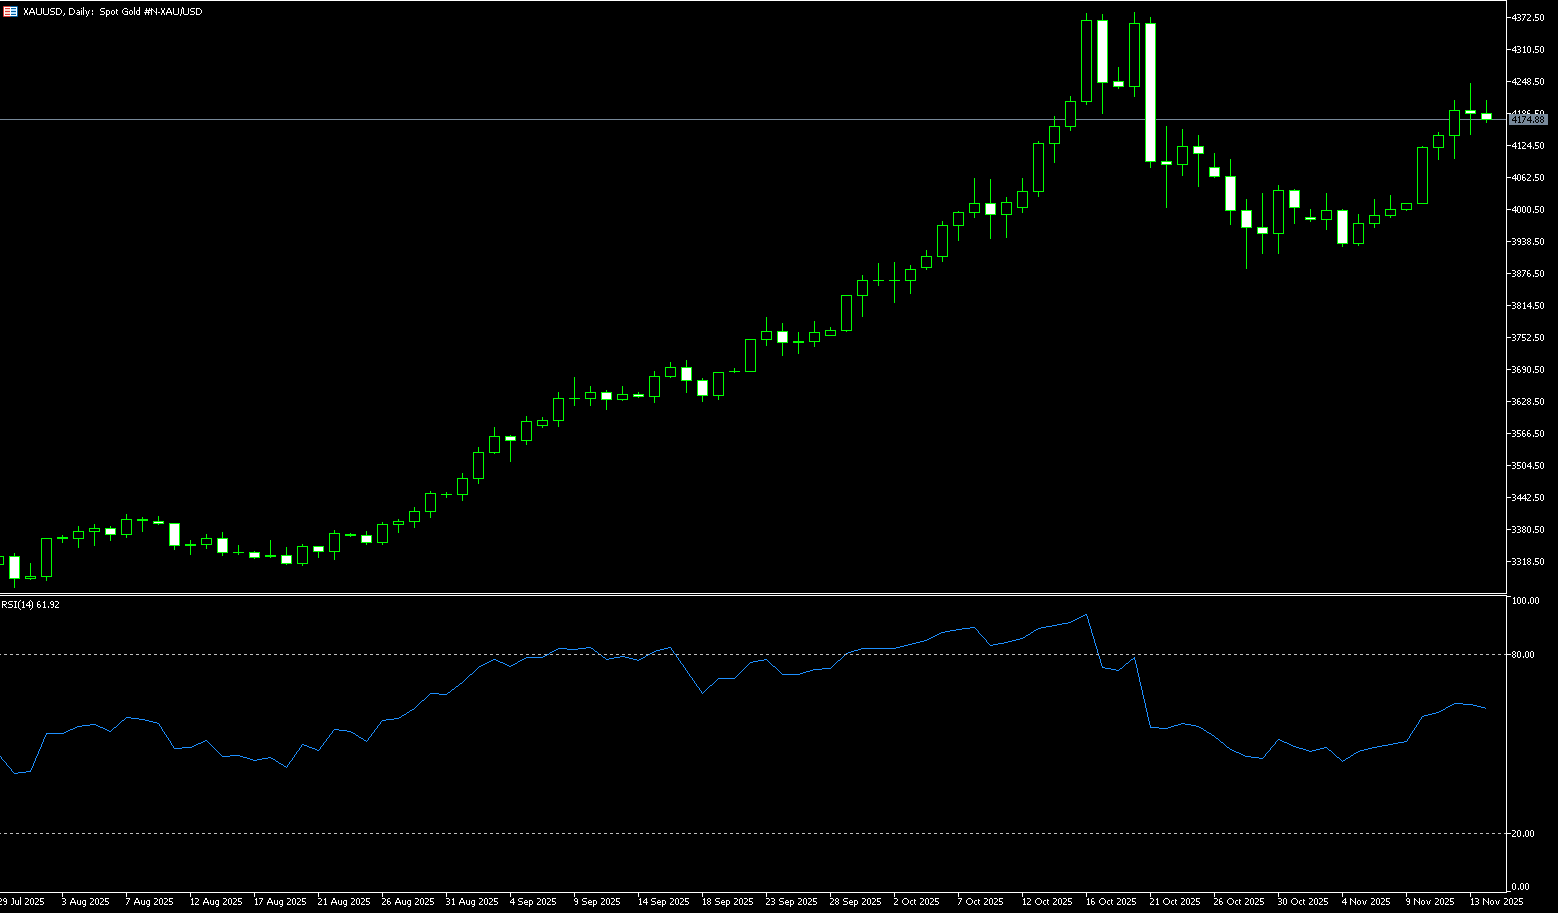
Gold prices rebounded throughout Monday's European session, reaching a high of around $4,262 per ounce, the highest level since October 21st. Driven by rising expectations of a Federal Reserve rate cut, the precious metals market saw a comprehensive rise in November. Spot gold touched a two-week high of $4,226.50 per ounce last Friday, while silver even hit a new historical record, demonstrating the strong momentum of the precious metals market. Recent dovish statements from Federal Reserve officials, coupled with weak economic data released after the US government shutdown, have strengthened market expectations for rate cuts, providing strong support for gold. Economic growth is expected to continue to slow until 2026, and the Federal Reserve is likely to cut rates, prompting some investors to return to the gold market. In addition to macroeconomic factors, geopolitical risks have also injected additional uncertainty into the gold market. In the short term, the latest round of talks between US and Ukrainian delegations regarding the Russia-Ukraine "peace plan" is attracting significant attention. Despite strong performance in precious metal prices, physical demand is showing signs of divergence. Gold demand in major Asian markets is suppressed, and while the Indian wedding season has begun, high gold prices have clearly dampened retail buying interest.
Over the past two weeks, gold has been consolidating within a large rectangular range between $4,000 (a psychological level) and $4,180 (the 5-day simple moving average). The recent surge broke through the upper edge of this range, exhibiting a typical "breakout-pullback-re-attack" pattern. Currently, the $4,180-$4,175 range has transformed from resistance into solid support. As long as it doesn't fall back below this area in the short term, the bullish trend remains unbreakable. If it successfully holds above $4,200 this week, the next target is the $4,300 high, and a break above that could even lead to a push towards the $4,350 psychological level, and then a challenge of the all-time high of $4,381.20. Even if a pullback occurs, the first solid support level is at 4,180-4,175 (former resistance now support). Further down, there is a densely traded support zone around $4,150, with 4,100-4,115 serving as a medium-term support/resistance level.
Today, consider going long on spot gold around 4,234; Stop loss: 4,230; Target: 4,260; 4,270
AUD/USD
The AUD/USD pair started the week on a sluggish note, reacting to disappointing official Chinese PMI data released over the weekend, although downside remains limited. The spot price is currently trading in the lower half of 0.6500, near the two-week high reached on Friday, and appears poised to continue its strong rally seen over the past week or so. The National Bureau of Statistics survey showed that China's official manufacturing PMI fell below 50.0 for the eighth consecutive month in November, remaining in contraction territory. Furthermore, China's non-manufacturing PMI fell to 49.5 from 50.1 last month, marking its lowest reading since December 2022 and its first contraction in nearly three years. However, the market's immediate reaction appears to be short-lived, as easing trade tensions and recently announced government measures to boost consumption have provided support for the world's second-largest economy. Coupled with a reduced likelihood of further policy easing by the Reserve Bank of Australia, this has provided a tailwind for the Australian dollar amid a weaker US dollar.
The AUD/USD pair continued its upward trend this week, firmly breaking through the 0.6500 level, opening the door for further gains in the near term. Momentum indicators remain mixed, with the Relative Strength Index (RSI) climbing to near 56, while the Average Directional Index (ADX) has weakened slightly to the 13 area, suggesting a lack of momentum in the current trend. If it moves further upward, the pair could retest the November high of 0.6580 (November 13th), and a break above that would test the psychological level of 0.6600, potentially bringing the October high of 0.6629 (October 1st) back into focus, followed by the 2025 high of 0.6707 (September 17th). On the other hand, a break below the key 200-day moving average of 0.6464 would reveal a move towards the November low of 0.6421 (November 21st), followed by the August low of 0.6414 (August 21st). Further declines from there could reveal a deeper pullback, targeting the June low of 0.6372 (June 23rd).
Consider going long on the Australian dollar around 0.6530 today; Stop loss: 0.6520; Target: 0.6580; 0.6590

GBP/USD
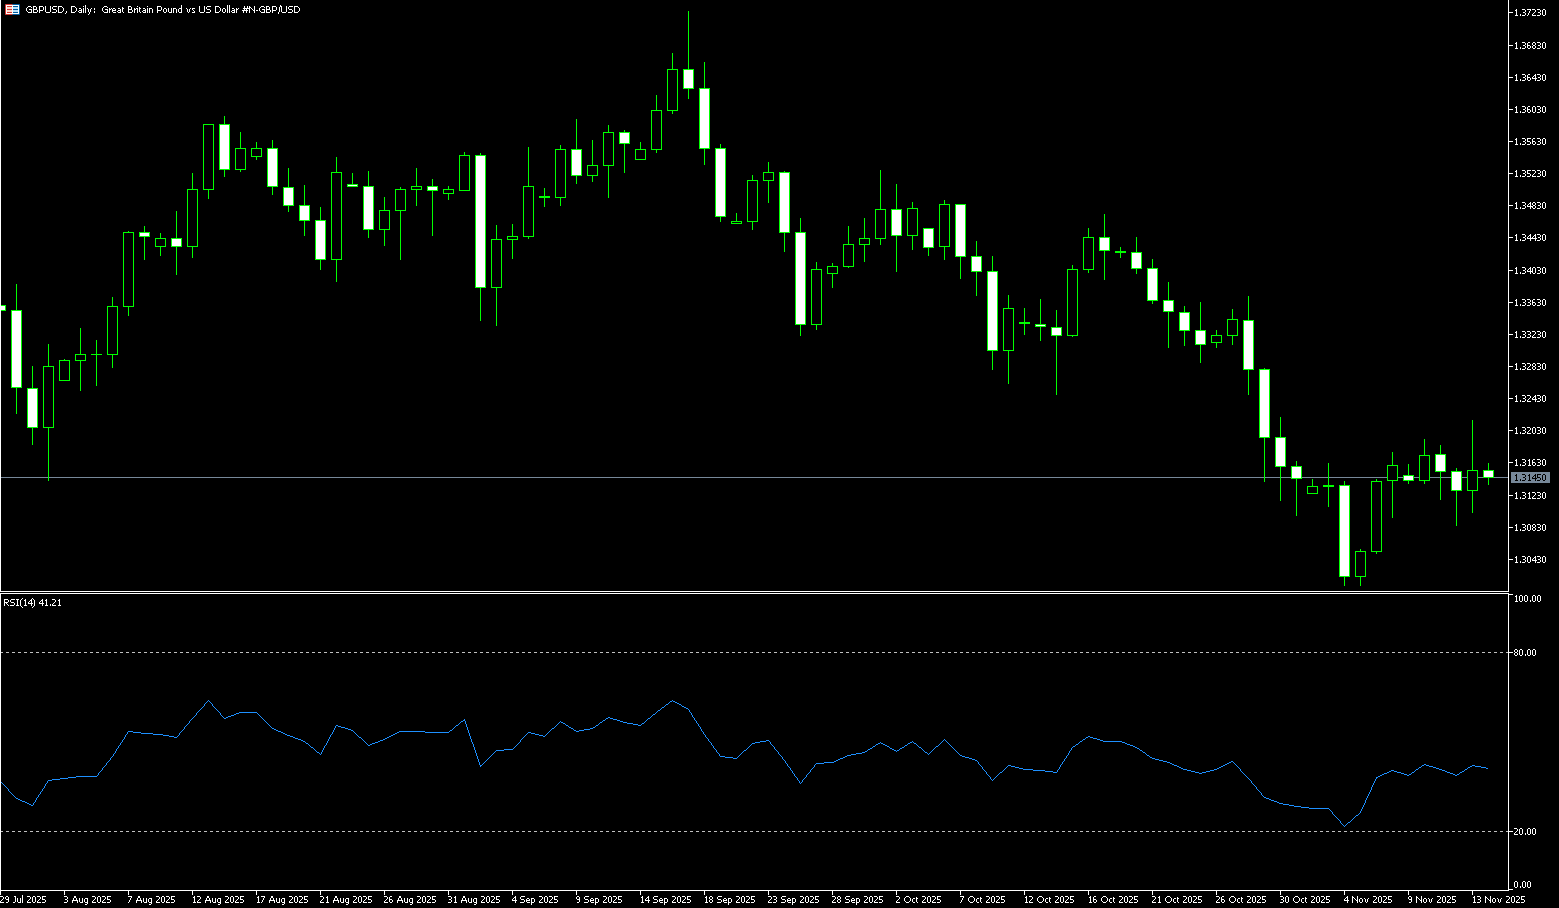
UK Chancellor Reeves' budget was a strong driver of the pound's rise last week. The budget provided more room for government borrowing targets, significantly easing market anxieties about the UK's long-term fiscal situation. An assessment by the Office for Budget Responsibility showed that even with increased welfare spending, the fiscal buffer would more than double. Following the budget announcement, the pound rose rapidly by about 0.5%, its best weekly performance since early August. Analysts attributed this to the market's prior digestion of bad news and the more restrained borrowing signals in the budget. Nevertheless, lingering concerns about slow economic growth, weak productivity, and persistent inflation may limit further upside for the pound.
A close above 1.3200 last week favored GBP/USD bulls, with positive oscillators on the daily chart showing positive signals. This level may now provide immediate support for spot prices. Any further weakness is more likely to attract new buyers at 1.3161 (the 9-day simple moving average) and find considerable support near 1.3100. However, a clear break below the latter would negate the positive bias and expose support at 1.3040-1.3035. On the other hand, the daily highs around the 1.3265-1.3270 area now appear to be an immediate hurdle; a break above this area could see the pair climb to the psychological level of 1.3300. This represents the technically important 200-day simple moving average at 1.3315, and a decisive break above this level would pave the way for further gains towards the 1.3365-1.3370 area.
Consider going long on GBP/USD around 1.3200 today; Stop loss: 1.3190; Target: 1.3250; 1.3260
USD/JPY
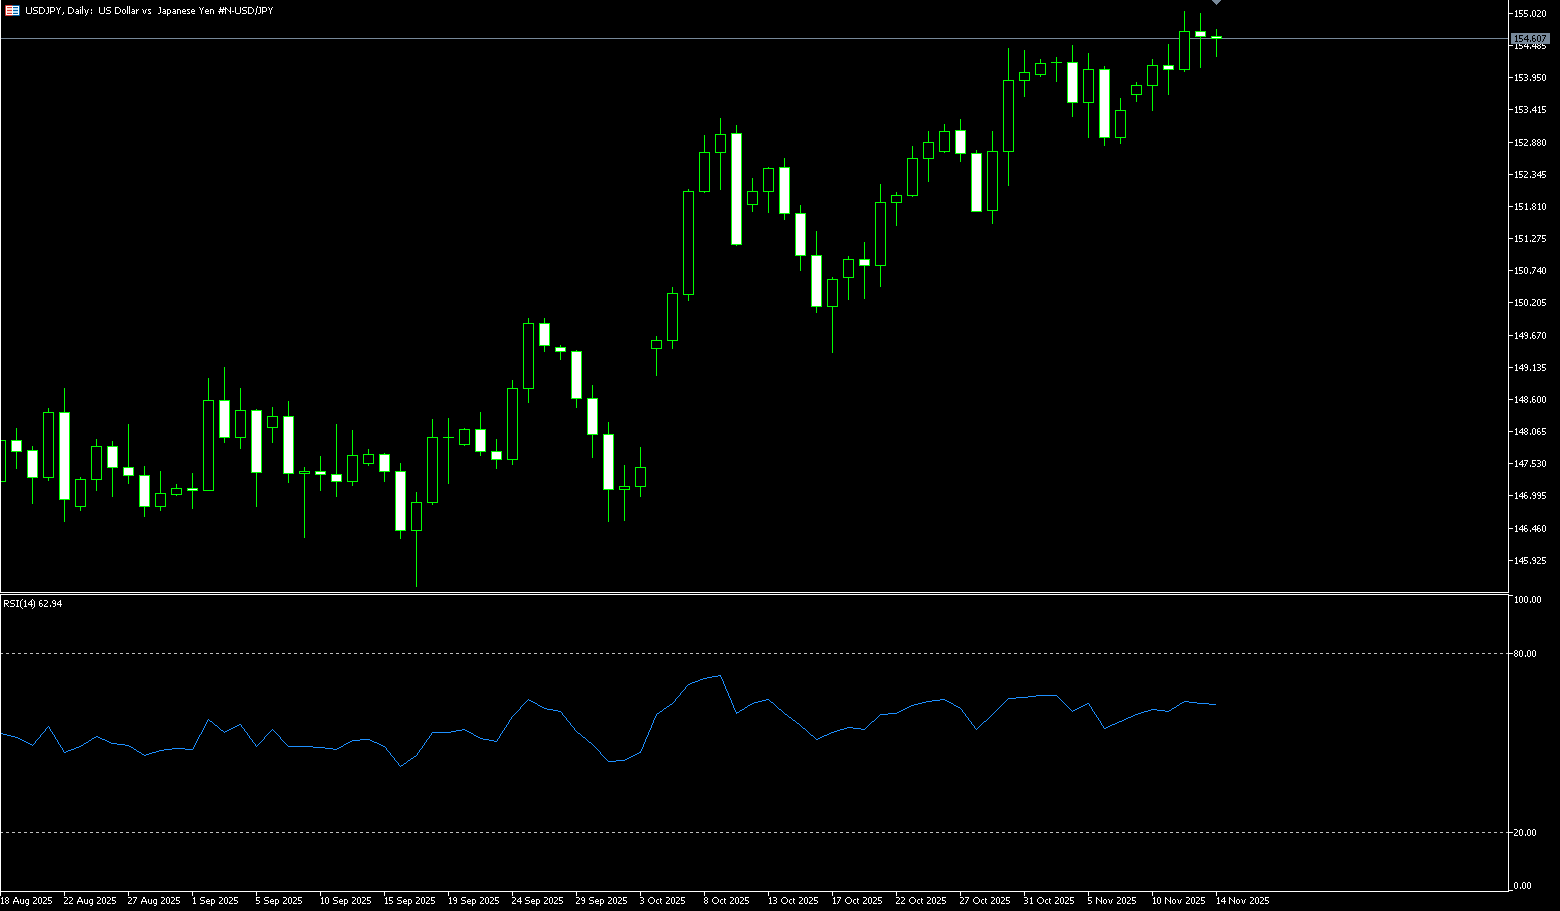
USD/JPY traded around 155.40 in early European trading on Monday. Traders increased their bets on another rate cut by the Federal Reserve at its December policy meeting, putting pressure on the dollar against the yen. Later on Monday, Bank of Japan Governor Kazuo Ueda will speak. The yen was in the market spotlight last week, remaining defensive since hitting a 10-month low, with investors closely watching for potential government intervention to support its exchange rate. The yen has depreciated by nearly 10 yen against the dollar since October. Sources revealed that the Bank of Japan is preparing for a possible rate hike in December, reiterating its hawkish stance in response to the sharp yen decline and easing political pressure, which initially pushed the yen higher but subsequently retreated. Unless the Bank of Japan commits to continued interest rate hikes to control inflation, a single rate hike is unlikely to significantly alter the yen's trajectory due to the large and low-volatility interest rate differential between the US and Japan. Given the current USD/JPY level and the fiscal package, a December rate hike is quite likely, which could further push the yen higher.
The daily chart shows that bears are now awaiting a sustained break above 155.20, which represents the 21-day simple moving average. Meanwhile, the oscillator on the chart is gaining negative momentum, although technical indicators on the daily chart remain in positive territory. This, in turn, suggests that USD/JPY is more likely to find good support near the psychological level of 155.00. However, some follow-through selling would confirm the break and lay the foundation for a week-long downtrend to 154.50, as well as the psychological level of 154.00. On the other hand, any meaningful attempt at a rally is now likely to face immediate resistance at the psychological level of 156.00. A sustained strong breakout could trigger a short-term pullback to the 156.65-156.70 area. A move above that level could see USD/JPY reclaim the 157.00 level. Momentum could extend further to the intermediate resistance of 157.45-157.50, pushing towards the multi-month high near 158.00 reached in November.
Consider shorting USD near 155.65 today; Stop loss: 155.85; Target: 154.80; 154.60
EUR/USD
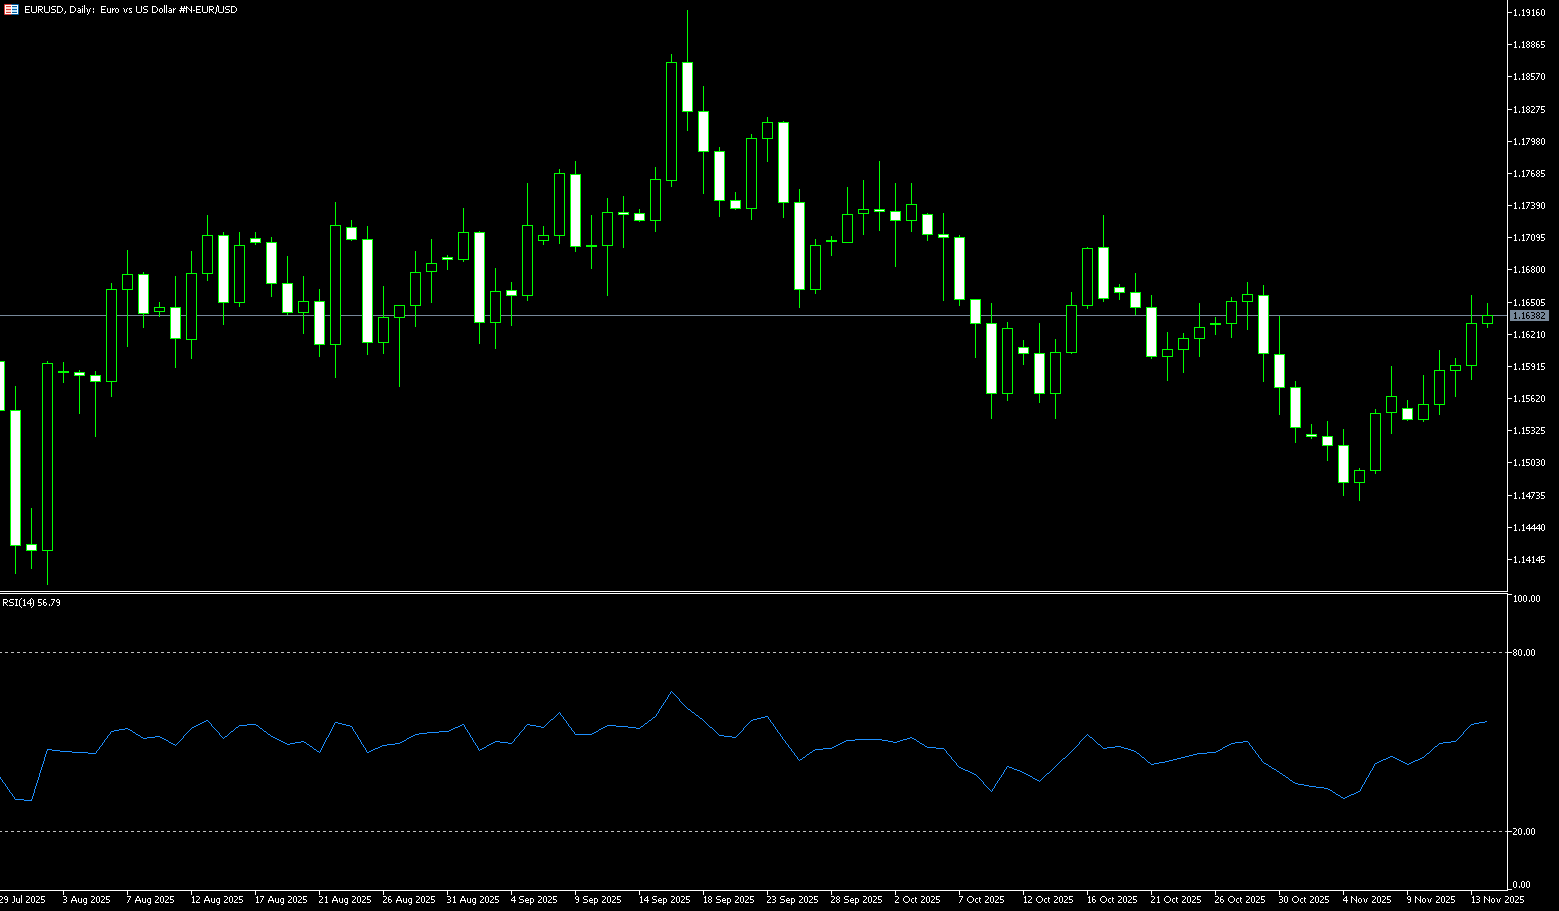
EUR/USD regained positive momentum at the start of the new week, rising above the 1.1600 level during Asian trading. Bulls are now waiting for a break above the technically important 200-day simple moving average before making new bets and preparing to extend the upward trend from a week ago, amid broad dollar selling. On the other hand, traders have increased their bets on the US central bank lowering borrowing costs again in December, driven by recent comments from several Fed officials. This, along with the generally bullish sentiment in financial markets, is seen as weakening the safe-haven dollar and providing support for the EUR/USD pair. Meanwhile, the euro continues to receive increasing support based on the view that the European Central Bank has stopped cutting interest rates. Indeed, the latest ECB meeting minutes released on Friday showed unanimous support for keeping all three key policy rates unchanged in October.
The daily chart for EUR/USD shows it trading around 1.1600. The pair is above the flat 20-day simple moving average at 1.1564, while resistance is provided near 1.1655 (the November 13 high). Meanwhile, the 14-day Relative Strength Index (RSI) is above its midline (currently around 53) and has slowed, indicating easing buying pressure. The risks for EUR/USD are also skewed to the downside. Immediate support lies at the 20-day simple moving average at 1.1564 and the 1.1500 (psychological level) area. Further down, the November 5 low of 1.1468 will pose a challenge to the bears. Conversely, for a trend reversal to be confirmed, the bulls need to break through 1.1655 (the high of November 13th) and the high of October 28th (close to 1.1670) to be monitored. The next target is the 1.1700 level.
Today, consider trading the Euro around 1.1590; Stop loss: 1.1576; Target: 1.1640; 1.1650
Disclaimer: The information contained herein (1) is proprietary to BCR and/or its content providers; (2) may not be copied or distributed; (3) is not warranted to be accurate, complete or timely; and, (4) does not constitute advice or a recommendation by BCR or its content providers in respect of the investment in financial instruments. Neither BCR or its content providers are responsible for any damages or losses arising from any use of this information. Past performance is no guarantee of future results.
Lebih Liputan


Pendedahan Risiko:Instrumen derivatif diniagakan di luar bursa dengan margin, yang bermakna ia membawa tahap risiko yang tinggi dan terdapat kemungkinan anda boleh kehilangan seluruh pelaburan anda. Produk-produk ini tidak sesuai untuk semua pelabur. Pastikan anda memahami sepenuhnya risiko dan pertimbangkan dengan teliti keadaan kewangan dan pengalaman dagangan anda sebelum berdagang. Cari nasihat kewangan bebas jika perlu sebelum membuka akaun dengan BCR.
BCR Co Pty Ltd (No. Syarikat 1975046) ialah syarikat yang diperbadankan di bawah undang-undang British Virgin Islands, dengan pejabat berdaftar di Trident Chambers, Wickham’s Cay 1, Road Town, Tortola, British Virgin Islands, dan dilesenkan serta dikawal selia oleh Suruhanjaya Perkhidmatan Kewangan British Virgin Islands di bawah Lesen No. SIBA/L/19/1122.
Open Bridge Limited (No. Syarikat 16701394) ialah syarikat yang diperbadankan di bawah Akta Syarikat 2006 dan berdaftar di England dan Wales, dengan alamat berdaftar di Kemp House, 160 City Road, London, City Road, London, England, EC1V 2NX. Entiti ini bertindak semata-mata sebagai pemproses pembayaran dan tidak menyediakan sebarang perkhidmatan perdagangan atau pelaburan.

 English
 简体中文
简体中文
 繁體中文
繁體中文
 Bahasa
Melayu
Bahasa
Melayu
 Tiếng
Việt
Tiếng
Việt
 ไทย
ไทย
 日本語
日本語
 한국어
한국어
 ភាសាខ្មែរ
 español