


0
US Dollar Index
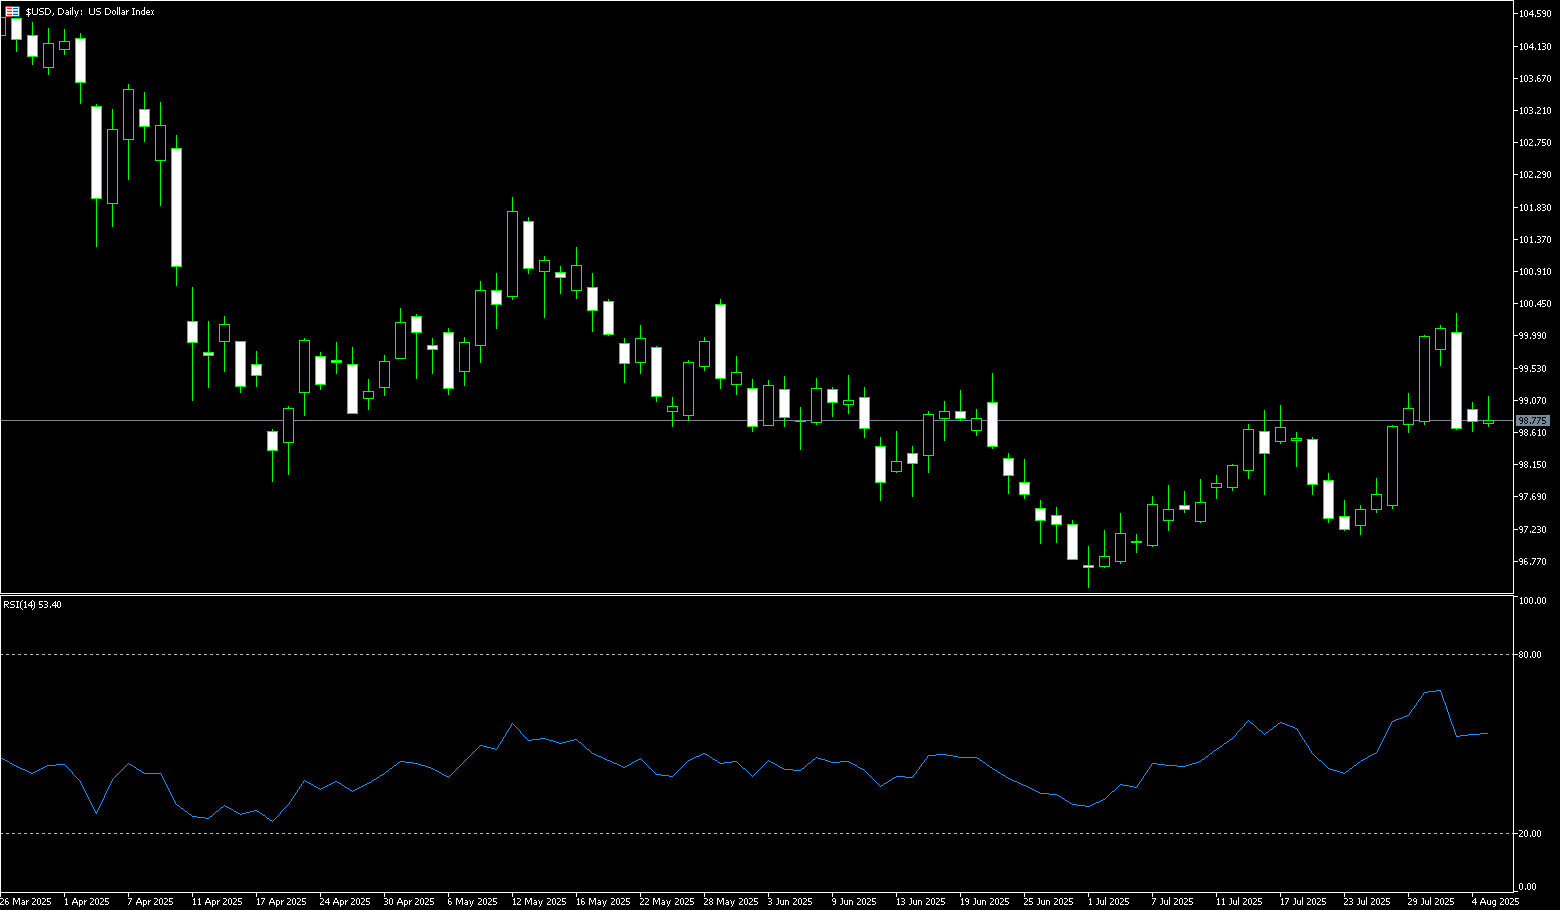
The US dollar index hovered around 98.80 on Tuesday, showing little volatility as traders weighed the latest global trade developments and shifting monetary policy expectations. President Trump threatened to impose higher tariffs on India for continued Russian oil imports, while the European Union announced a six-month suspension of planned retaliatory tariffs against the United States to allow time for further negotiations. Last week, the dollar came under pressure after a weaker-than-expected July jobs report reinforced market expectations for a September rate cut by the Federal Reserve. The market is now pricing in more than 60 basis points of easing by year-end. Increased investor uncertainty stems from the recent resignation of a Fed governor and Trump's dismissal of a senior government statistics official.
The daily chart of the US dollar index shows that the rebound from a low of 96.37 stalled after a recent move to 100.25, forming a false breakout signal. The Bollinger Bands are currently showing signs of contraction, indicating a period of volatility compression, suggesting the start of a new trend in the short term. Regarding the MACD indicator, while the DIFF and DEA indicators maintain a golden cross, a subsequent decline would trigger a death cross warning, significantly weakening technical momentum. The 14-day relative strength index (RSI) hovers around 54, remaining within the neutral zone, and the short-term direction remains unclear. The US dollar index faces short-term support near 98.33 (the Bollinger Band's middle axis) and 98.00 (a round number). Initial upward resistance lies at 99.00. A break above 99, followed by 99.46 (the 95-day simple moving average), could alleviate short-term downward pressure.
Consider shorting the US Dollar Index at 98.90 today, with a stop loss of 99.05 and a target of 98.40 or 98.45.
WTI Spot Crude Oil
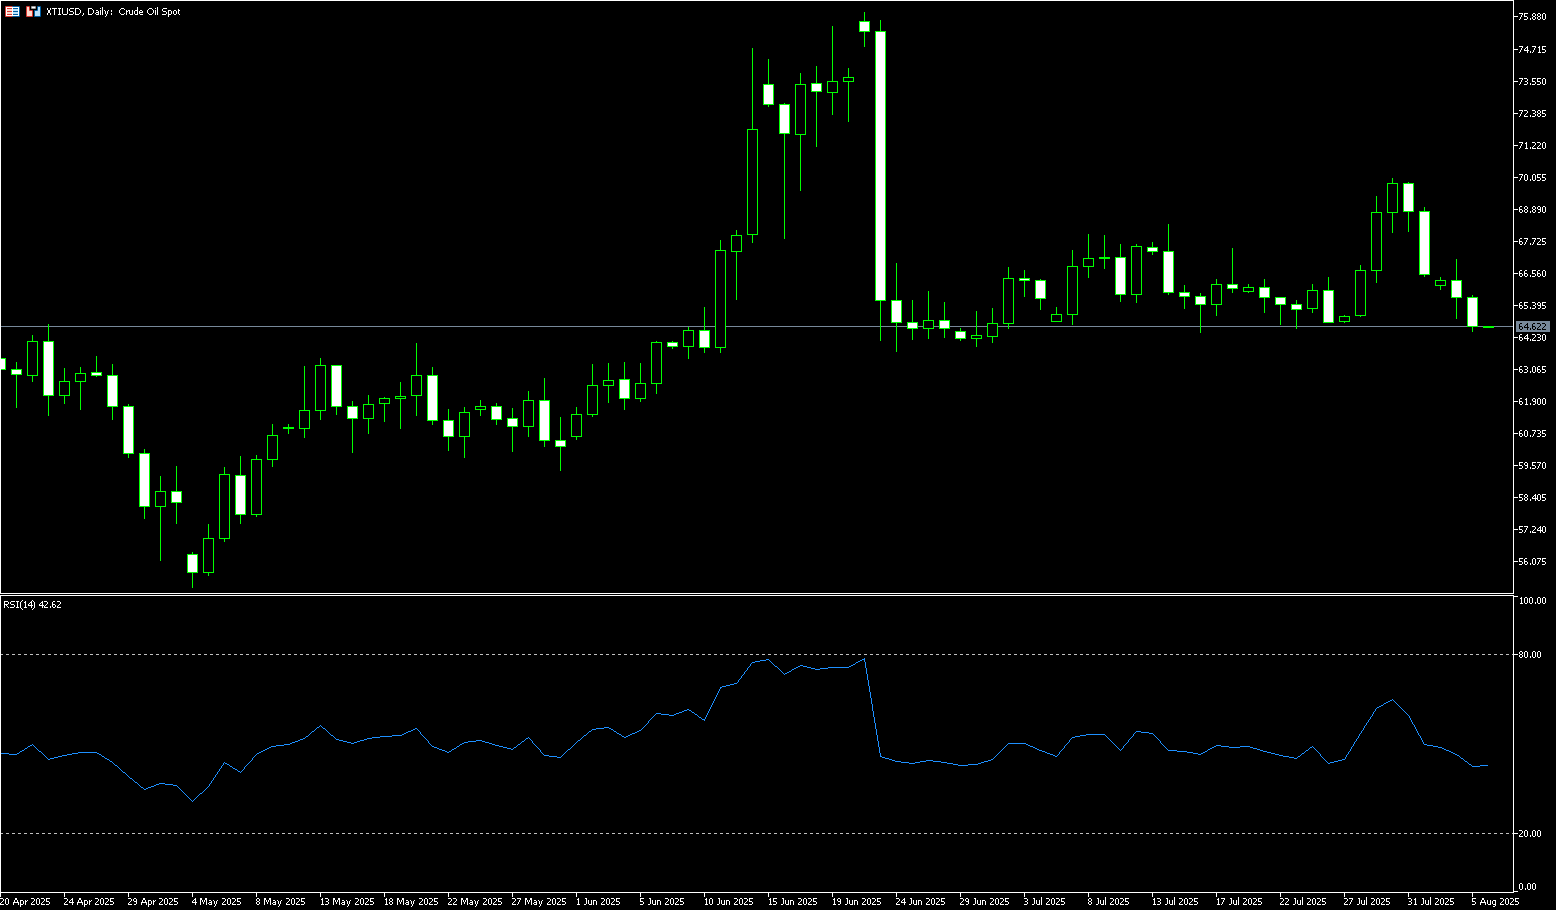
WTI crude oil fell below $64.50 per barrel on Tuesday, marking its fourth consecutive day of decline, as concerns about oversupply grew after OPEC+'s decision to increase production outweighed the potential impact of tightening Russian crude oil supplies. OPEC+ decided to increase production despite potential Russian supply risks. On Sunday, OPEC+ agreed to increase production by 547,000 barrels per day in September, reversing the 2.2 million barrels per day cuts the eight-member group had enacted in 2023. Meanwhile, the United States is exerting new pressure on India to stop buying Russian oil as Washington's attempts to push Moscow into a peace deal with Ukraine have raised concerns about potential disruptions to global supply flows. President Trump said he would "significantly increase" tariffs on India in response to its continued imports of Russian oil. India currently faces a 25% tariff on its exports to the United States.
On the daily chart, WTI crude oil prices continue to fluctuate between the key support level of $64.00 and the resistance level of $72.00. Buyers are likely to continue entering the market near this support level, with clear risk below this level, targeting a move back towards the $72.00 resistance level. On the other hand, sellers will need to break through $64.81 (the July 28 low), further support at $64.12 (the 89-day moving average), and $64.00 (the round-figure mark), opening the way for a further decline to $63.48 (the June 9 low). On the upside, the 200-day moving average of $67.64 will initially pose significant resistance; a re-establishment at this level would increase the potential for a rebound. Further upside potential remains, with close attention paid to the $69.13 support line and the $70.00 psychological level.
Consider going long on crude oil at 64.30 today. Stop-loss: 64.10, target: 66.00, 66.50.
Spot Gold
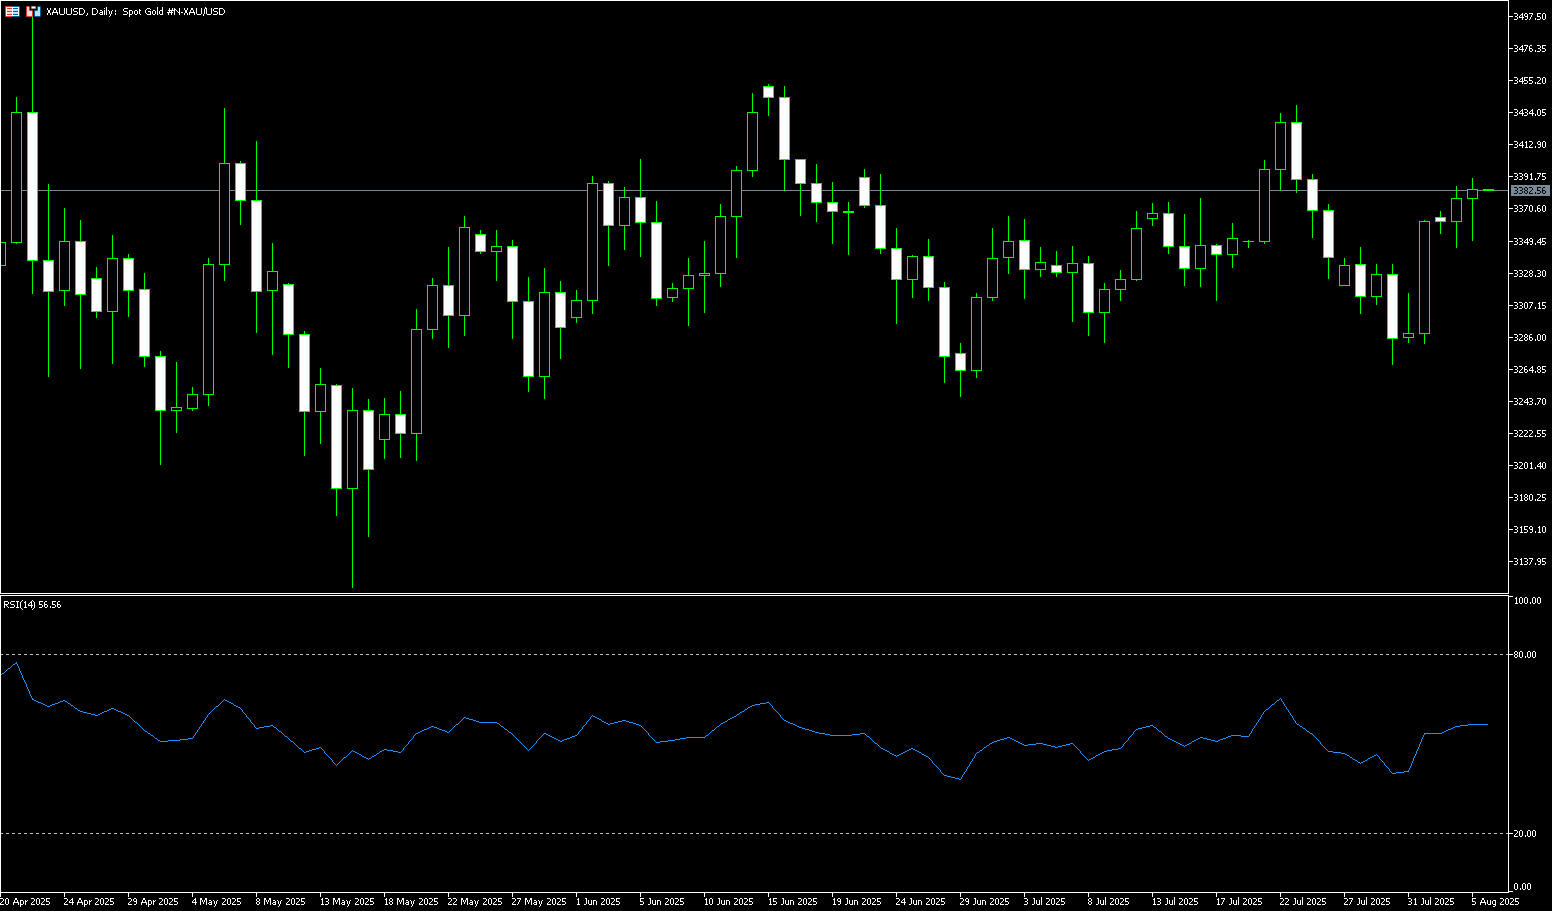
Gold prices rose slightly on Tuesday. Spot gold traded around $3,378.50 per ounce, marking its third consecutive day of gains on Monday. Last week's economic data fueled expectations of a Federal Reserve rate cut, while Trump's pressure on India heightened risk aversion. Gold rebounded strongly late last week, breaking away from early-week declines and surging towards key resistance at $3,400 per ounce. This was as weak US jobs data rekindled hopes for a September rate cut by the Federal Reserve. The weaker-than-expected jobs report undermined confidence in the US economy and put pressure on the US dollar, as markets anticipate a more dovish Fed and potential rate cuts to stimulate economic growth. For gold, the disappointing jobs data reinforced its role as a hedge against economic uncertainty, supporting price gains as investors seek stability.
From the chart, gold prices rebounded sharply last week from a low of $2,268 to a high of $3,382 at the beginning of this week, just shy of $3,400. With gold breaking through the psychological resistance level of $3,330, the weekly trend is significantly bullish. A weekly close above this level could signal a move towards $3,400. Technically, a break above $3,382 (Tuesday's high resistance level) could lead to further challenges at $3,400/oz in the short term, as well as further upward pressure at $3,414.10 (the Bollinger Band), and $3,439 (the July 23 high). A pullback would likely target the intersection of the 50-day moving average at $3,342.80 and the Bollinger Band at $3,347, providing bullish resistance. A continued decline would target the 89-day moving average at $3,306.60 and the psychologically important $3,300.00 area.
Consider going long on gold at 3,375 today, stop loss: 3,370, targets: 3,395, 3,400.
AUD/USD
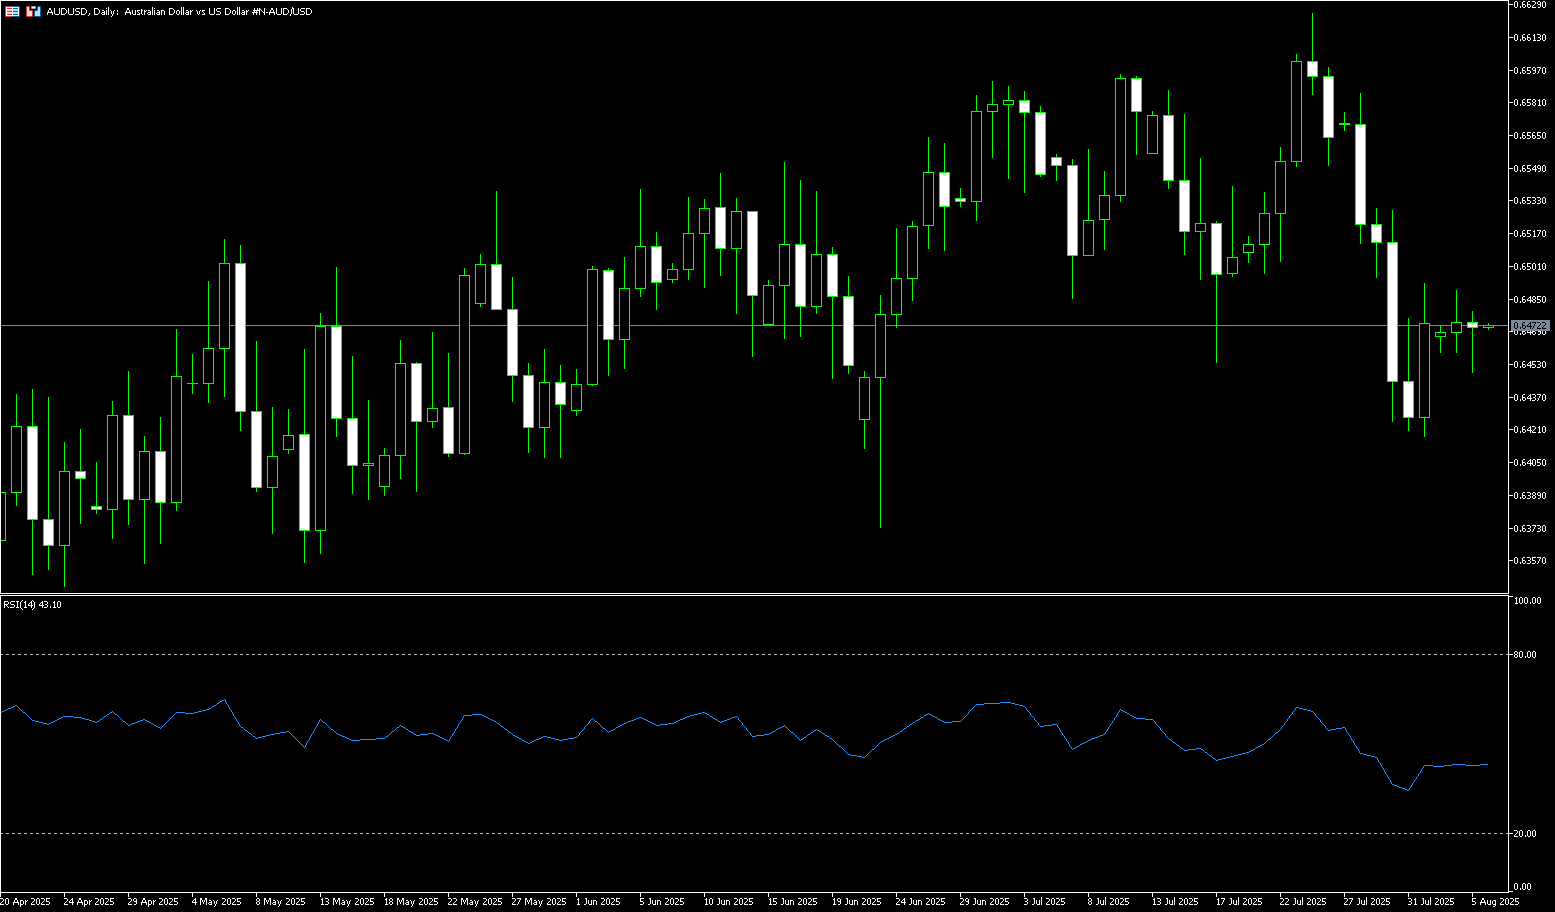
The Australian dollar fell to around $0.6465 on Tuesday, with market sentiment subdued as expectations for a rate cut grew. The Reserve Bank of Australia is widely expected to cut the cash rate to 3.60% at its upcoming two-day policy meeting, ending on August 12th, as core inflation, the RBA's preferred indicator, slowed to 2.7% in June, well within the central bank's 2-3% target range. The market has now priced in a nearly 95% probability of a rate cut from the RBA and expects two more cuts by early next year. On the economic front, the ANZ-Indeed Australian Job Advertisements Index recorded its largest monthly decline since February in July 2025, its fourth decline so far this year, suggesting cooling labor market conditions.
AUD/USD traded around 0.6470 on Tuesday. Technical analysis on the daily chart suggests a bearish bias, with the 14-day relative strength index (RSI) remaining below the 50-level. The pair is also trading below its 50-day simple moving average at 0.6512, suggesting weakening short-term momentum. On the downside, key support lies at the two-month low of 0.6419, recorded on August 1. A break below this level could put downward pressure on the pair, potentially testing the three-month low of 0.6372 recorded on June 23. AUD/USD could approach initial resistance at the 50-day simple moving average at 0.6512. A break above these levels could strengthen short- and medium-term price momentum and support the pair's exploration of the 0.6576 area, the 76.4% Fibonacci retracement level from 0.6625 to 0.6420.
Consider a long position on the Australian dollar at 0.6455 today, with a stop-loss of 0.6440 and targets of 0.6520 and 0.6530.
GBP/USD
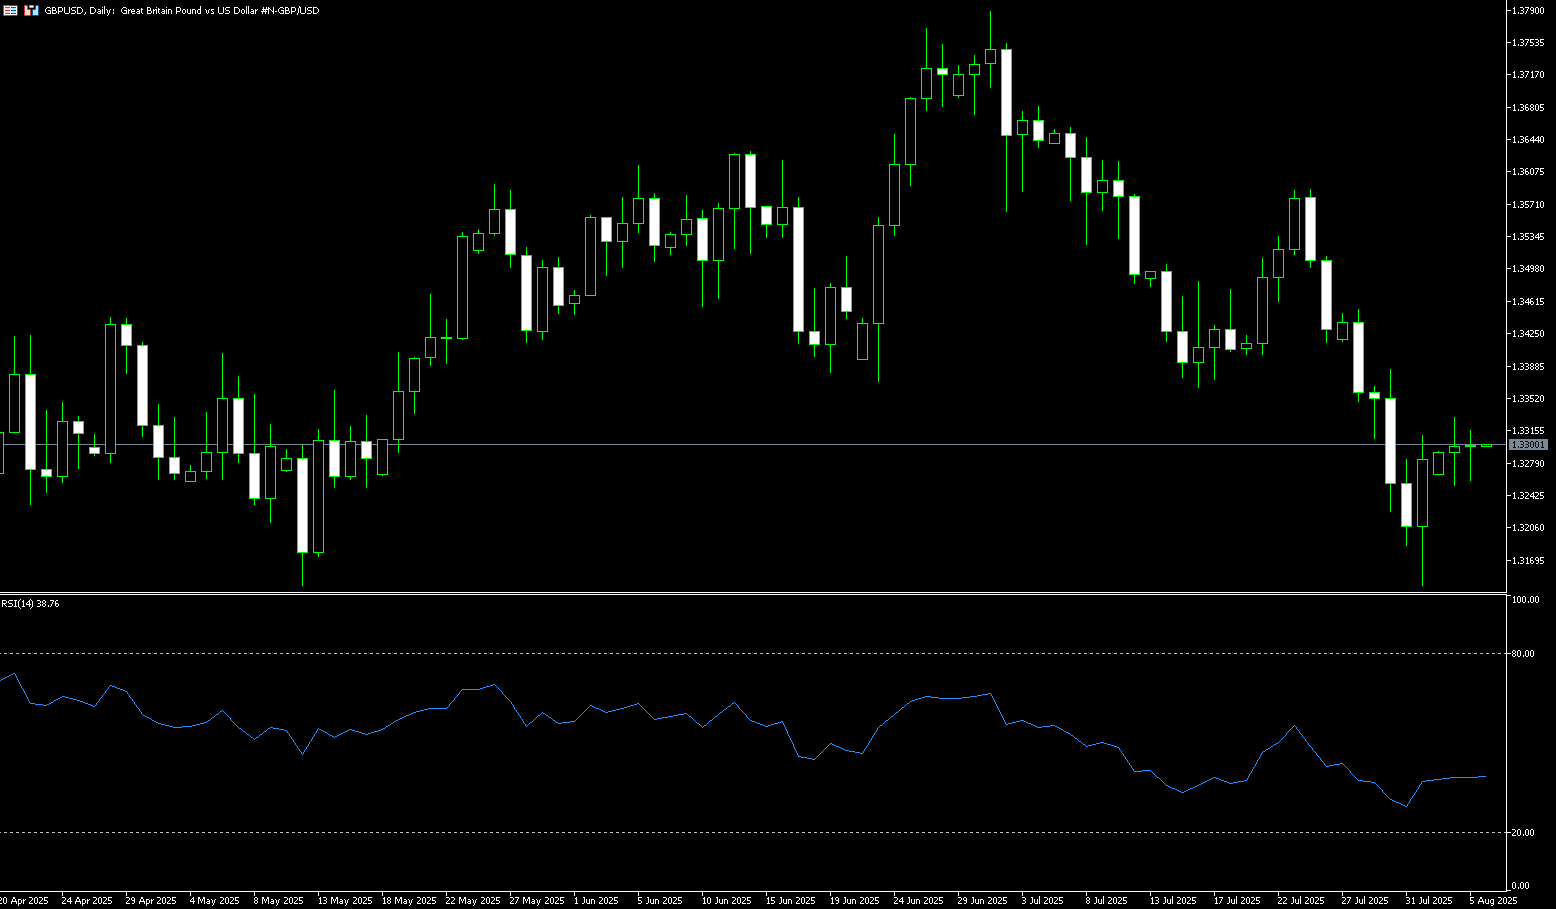
During Tuesday's Asian trading session, the GBP/USD pair traded steadily around 1.3290. However, the rising likelihood of a Fed rate cut could put pressure on the US dollar. The British pound rebounded from an 11-week low of $1.3210 to $1.3330 on July 31st, as the dollar weakened following a weaker-than-expected US jobs report that indicated a cooling labor market. However, the pound sterling fell sharply by 3.8% in July, its worst performance since September 2022, as concerns about the UK's economic outlook and fiscal health continued to weigh on sentiment. Investors' growing pessimism about the UK's growth outlook has heightened expectations that the Bank of England may cut interest rates by 25 basis points in August, with the possibility of another cut by the end of the year, as it shifts its focus toward supporting growth.
GBP/USD slowed down at the start of the week, stabilizing just below 1.3300. Following a sharp technical rebound from the 140-day simple moving average at 1.3142 and last week's low of 1.3141, the pair had weakened following unexpectedly slowing US labor market data over the weekend. This shift in US dollar flows helped GBP/USD snap a six-day losing streak. After hitting a daily high of 1.3330 earlier in the week, the pair fell nearly 50 pips, forming an inverted hammer or shooting star pattern. This suggests traders are reluctant to push prices higher, and a daily close below 1.3250 could lead to a test of lower prices. This could be followed by 1.3200 and the July bottom of 1.3141. Conversely, a daily close above 1.3330 could test the June 23 support-turned-resistance level of 1.3369, followed by the 1.3400 round-figure mark.
Consider a long position on the British pound at 1.3276 today, with a stop loss of 1.3260 and targets of 1.3330 and 1.3340.
USD/JPY
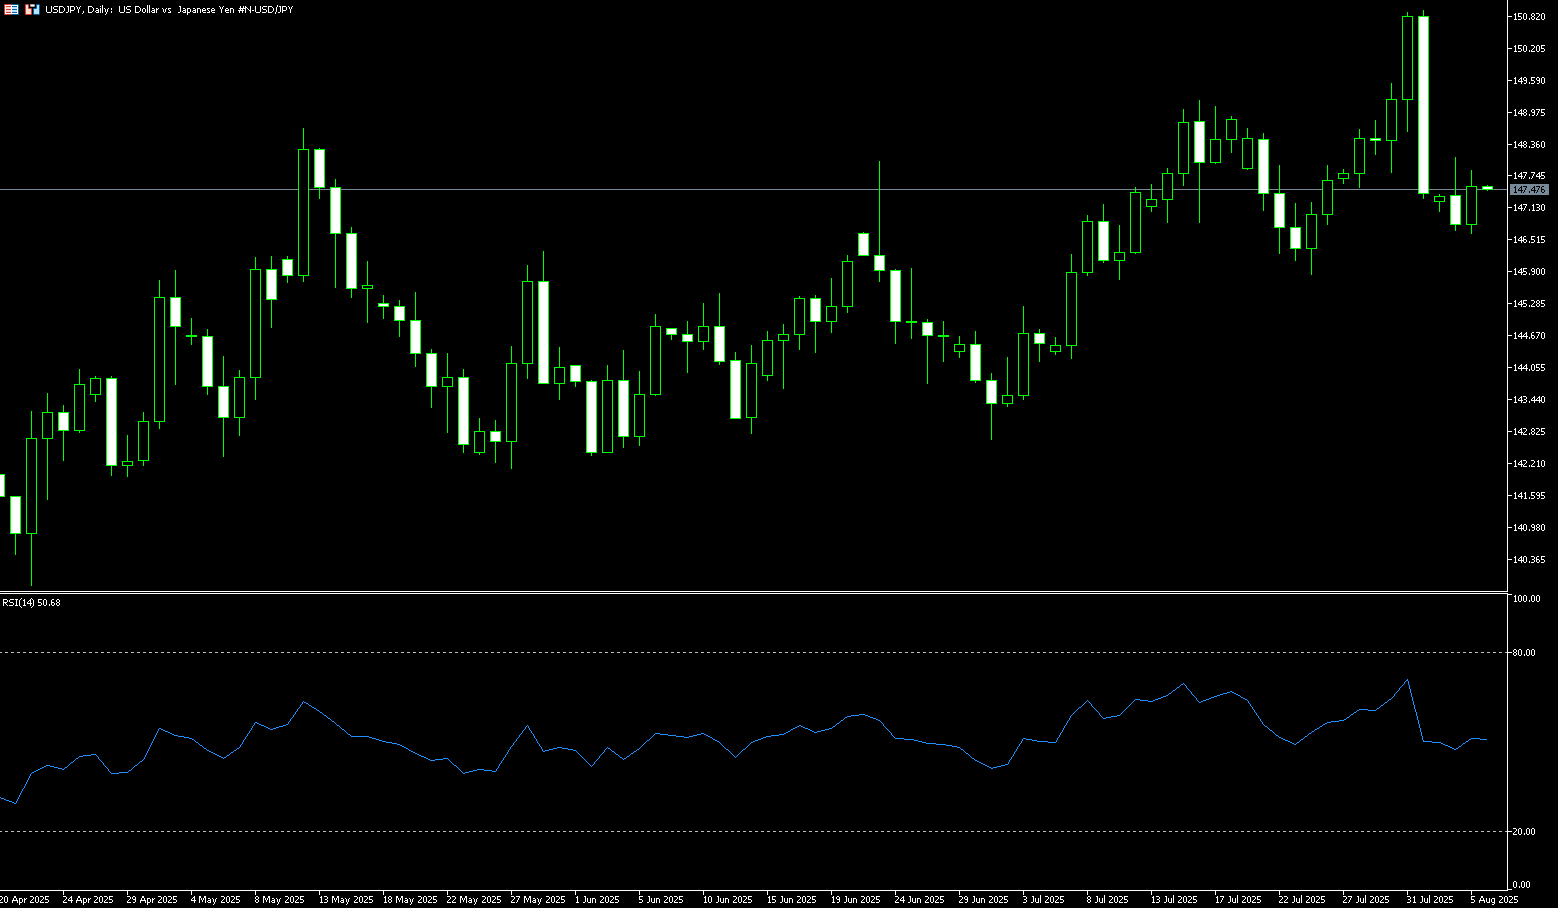
The yen hovered around 147.50 per dollar on Tuesday, maintaining its recent gains after the Bank of Japan's June meeting minutes indicated that policymakers remain willing to raise interest rates further if trade tensions ease. However, the board still believes that current interest rates are appropriate in the face of ongoing uncertainty. Ministry of Finance officials also emphasized the need for the central bank to respond flexibly, particularly in managing its bond purchases to maintain market stability. Last week, the Bank of Japan kept interest rates unchanged but raised its inflation forecast while warning of growing risks from global trade tensions. Meanwhile, the dollar weakened after a weak US jobs report, fueling bets on an imminent Federal Reserve rate cut, sending the yen up over 2% over the past two trading sessions.
From a technical perspective, spot prices showed some resilience below the 50% retracement of the rally from the July lows before retracing above 147.00, suggesting caution for USD/JPY shorts. Meanwhile, neutral oscillators on the daily chart suggest that any further rallies are more likely to face immediate resistance near 147.75, followed by the 148.00 round number. A sustained strong break above the latter would indicate a short-term bottom has been formed for USD/JPY, paving the way for the 148.60 and 149.00 levels. On the other hand, the 50% retracement level at 146.85 now appears to be acting as immediate support. Any follow-through selling below the Asian session lows in the 146.60 area could put the USD/JPY pair at risk of accelerating its decline towards the 146.33 (40-day moving average) and the 146.00 round number. This downward trajectory could extend further, ultimately dragging the pair to the 145.57 (lower Bollinger Band) area.
Consider shorting the US dollar at 147.85 today. Stop-loss: 148.10. Target: 146.80, 146.60.
EUR/USD
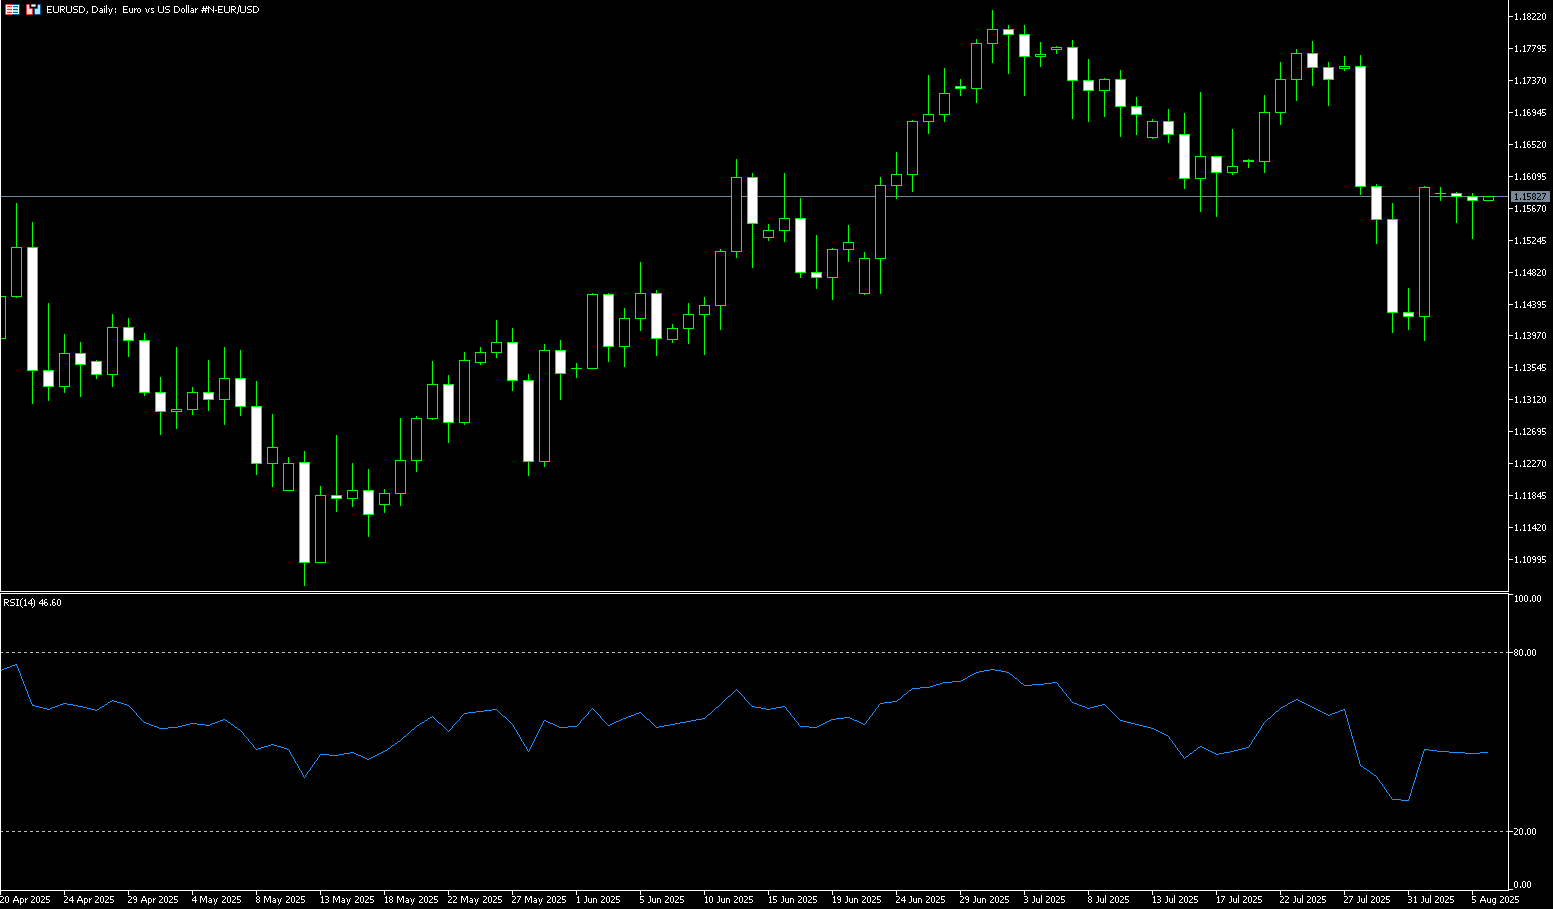
The euro stabilized above $1.15, rebounding from a seven-week low of $1.139 reached on August 1st, as the US dollar weakened broadly following disappointing US jobs data. The weaker-than-expected July nonfarm payroll report, coupled with significant downward revisions to May and June figures, heightened market expectations of a September Federal Reserve rate cut. In response, President Trump fired a senior Labor Department official, adding to market uncertainty. Money markets now price in two more Fed rate cuts this year, starting in September, while the European Central Bank is expected to keep rates unchanged. In the eurozone, annual inflation remained at 2.0% in July, slightly above the 1.9% forecast. Meanwhile, investor sentiment remained cautious amid the US's 15% tariff on EU exports.
The daily chart suggests that if buyers fail to break through the 1.1600 level, EUR/USD will continue to consolidate above the current price level of 1.1500. Momentum remains bearish, as indicated by the 14-day relative strength index (RSI), but is moving towards the neutral line, suggesting bullish intervention. A break above 1.1600 would expose the 20-day simple moving average at 1.1631, followed by the 1.1650 and 1.1700 round numbers. On the other hand, a break below 1.1500 would clear the way towards the 89-day simple moving average at 1.1440, followed by the 1.1400 level.
Consider a long EUR at 1.1560 today, with a stop loss at 1.1550 and targets at 1.1620 and 1.1630.
Disclaimer: The information contained herein (1) is proprietary to BCR and/or its content providers; (2) may not be copied or distributed; (3) is not warranted to be accurate, complete or timely; and, (4) does not constitute advice or a recommendation by BCR or its content providers in respect of the investment in financial instruments. Neither BCR or its content providers are responsible for any damages or losses arising from any use of this information. Past performance is no guarantee of future results.
更多報導


 English
 简体中文
简体中文
 繁體中文
繁體中文
 Bahasa
Melayu
Bahasa
Melayu
 Tiếng
Việt
Tiếng
Việt
 ไทย
ไทย
 日本語
日本語
 한국어
한국어
 ភាសាខ្មែរ
 español


